
About the project
We set out to give PMs the power to see, understand, and act. T‑Insight stitches together fragmented signals into a single intelligence layer: what’s happening, where it’s happening, how bad it is, and what to do next. We built a scalable ingestion pipeline, a thoughtful UI that emphasizes clarity, and an AI layer that transforms insights into prioritized opportunities. Along the way, we solved SSR pitfalls, map layering/z‑index issues, and model compatibility quirks. This helped deliver a focused, production‑ready experience that PMs can trust.
Inspiration
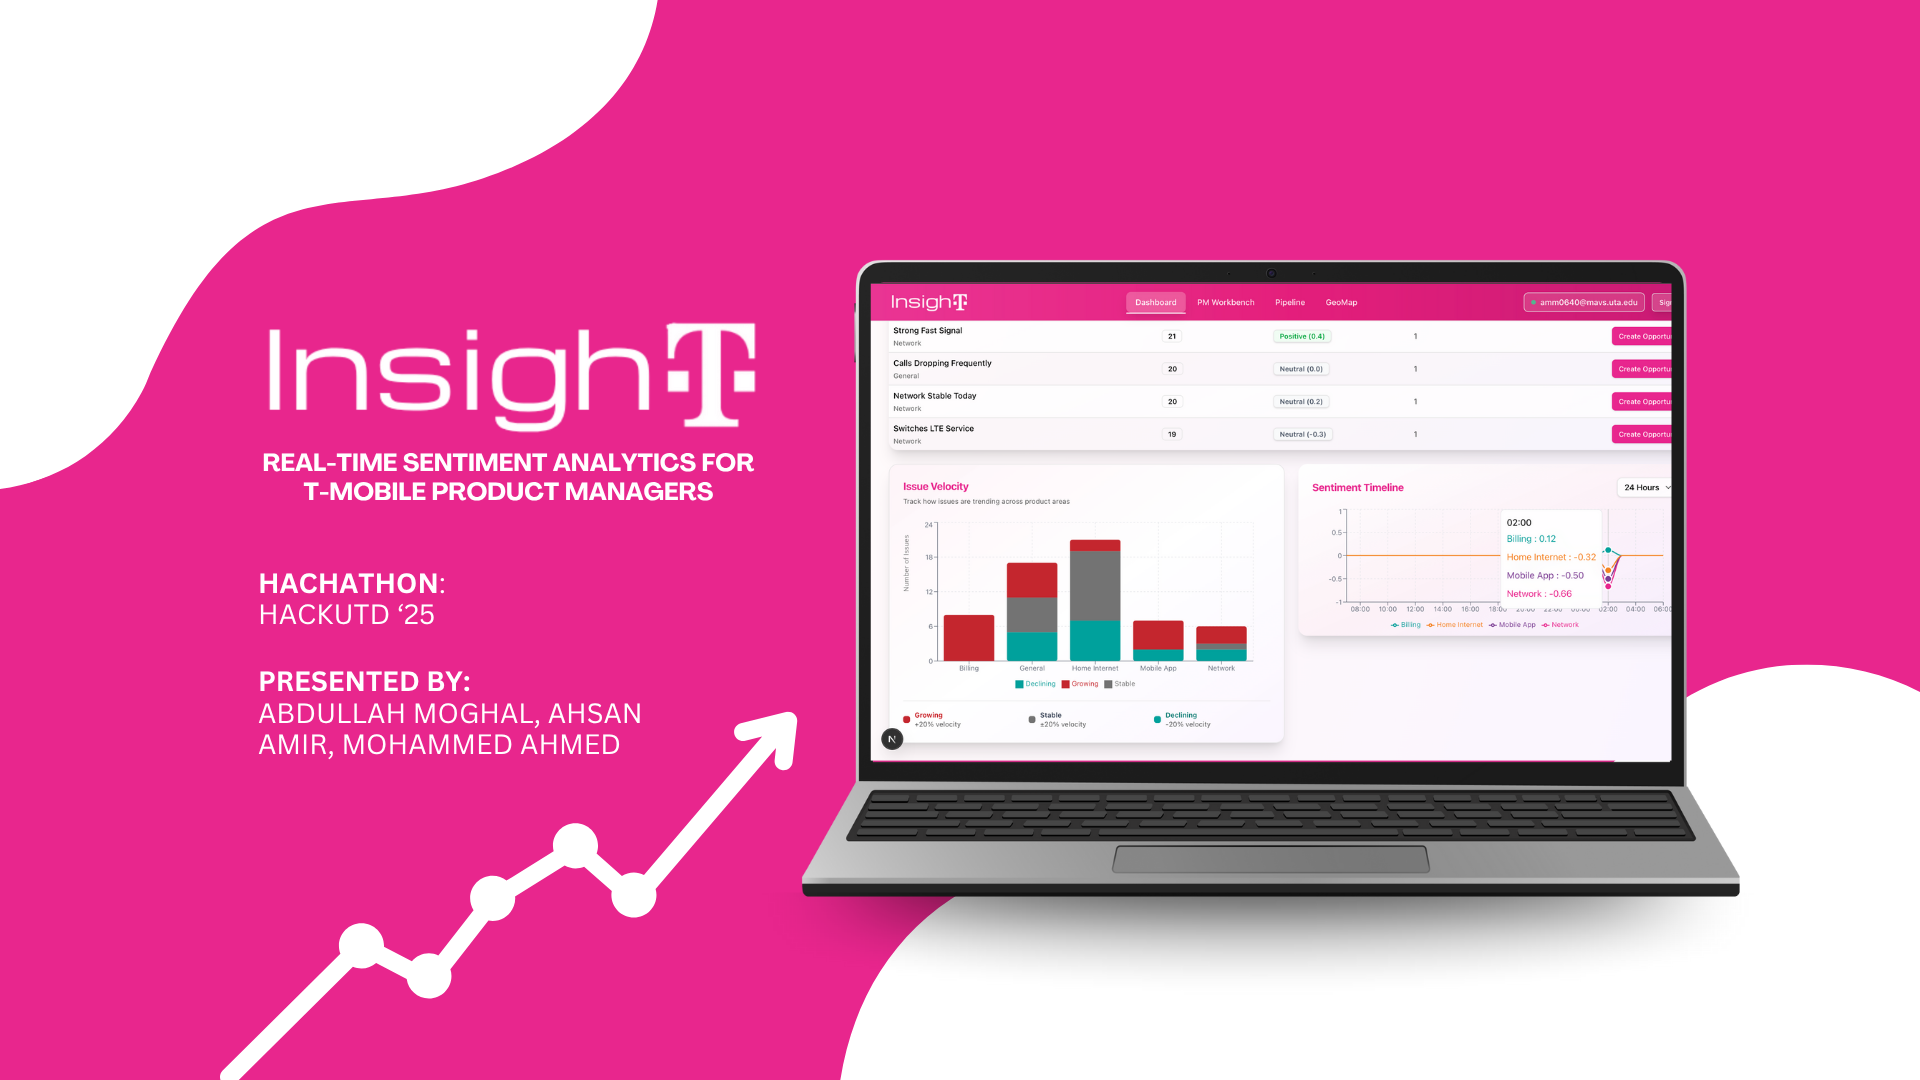
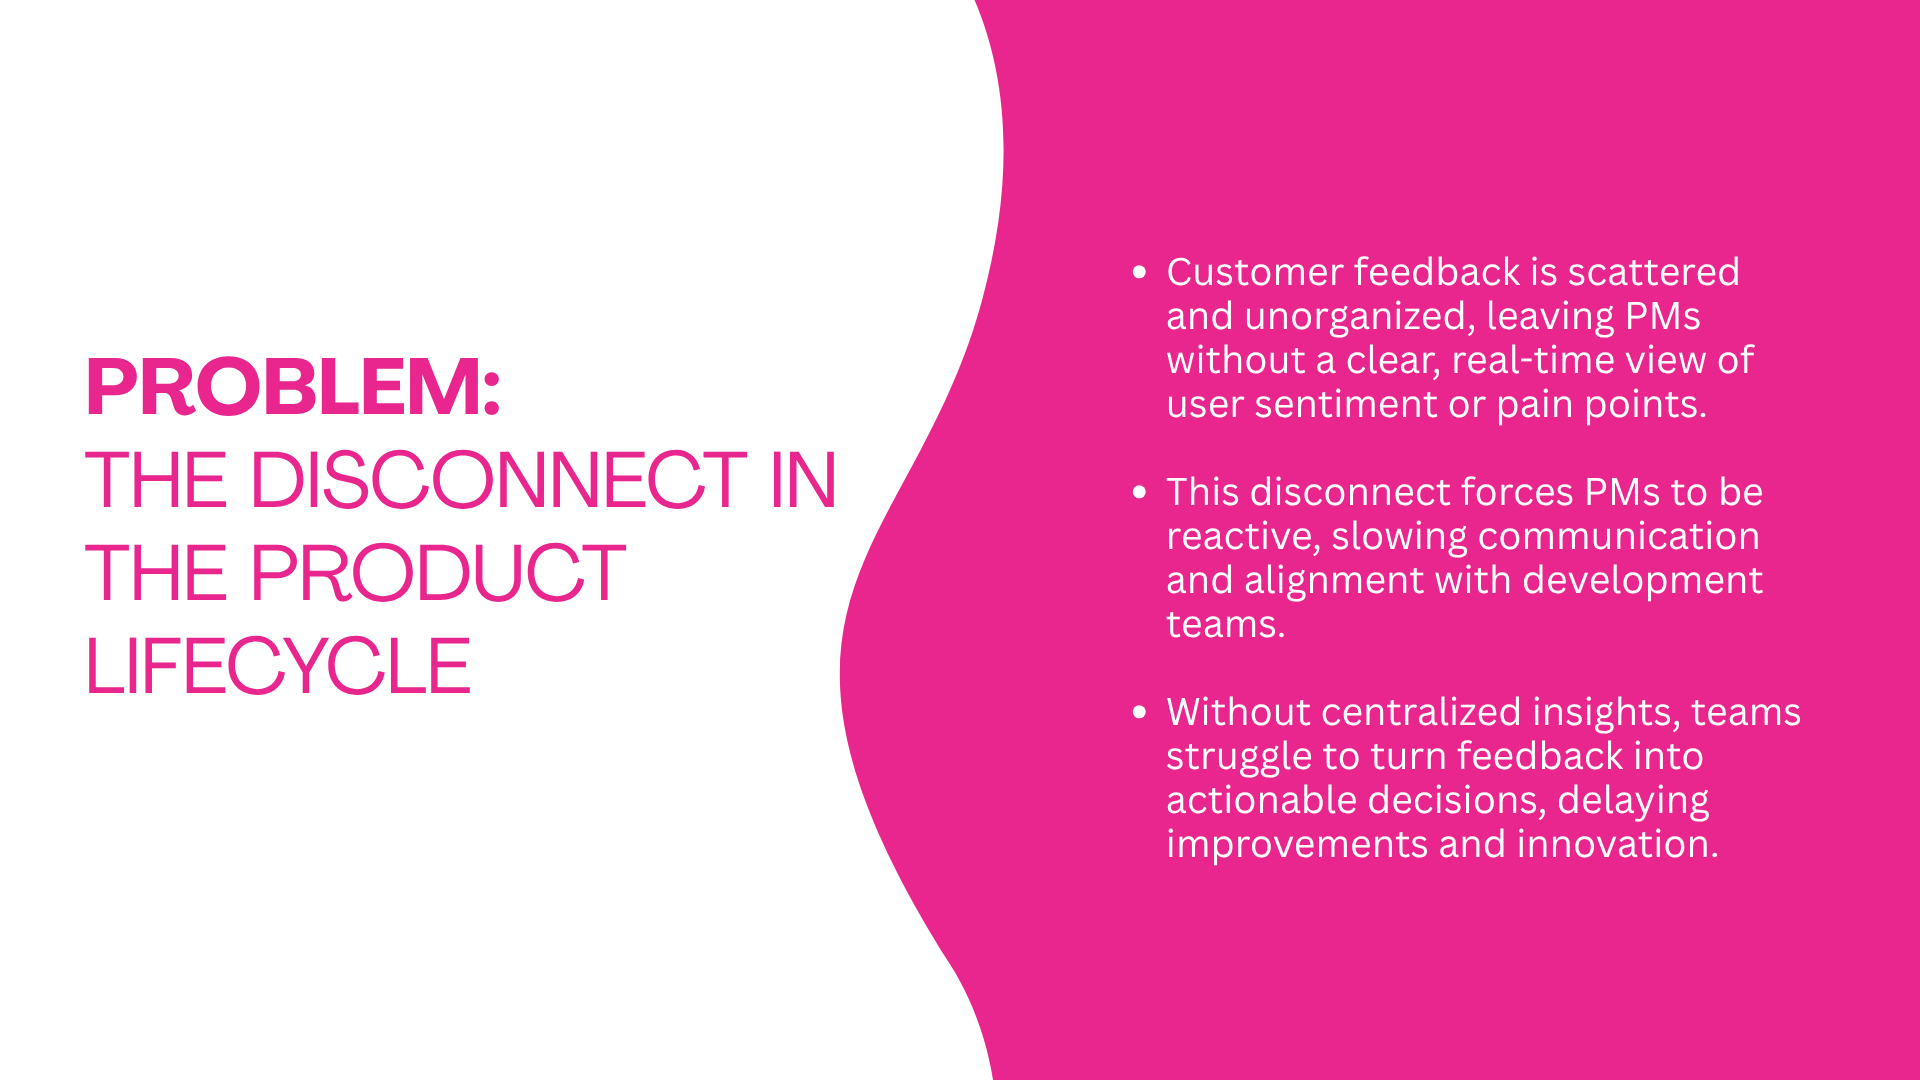
T‑Insight was born from a simple question PMs ask daily: “Where are customers hurting right now, and what should we do about it?” Feedback is scattered across social media, outage trackers, forums, and support logs. We wanted a single pane of glass that turns raw noise into prioritized, location‑aware, actionable intelligence.
What it does
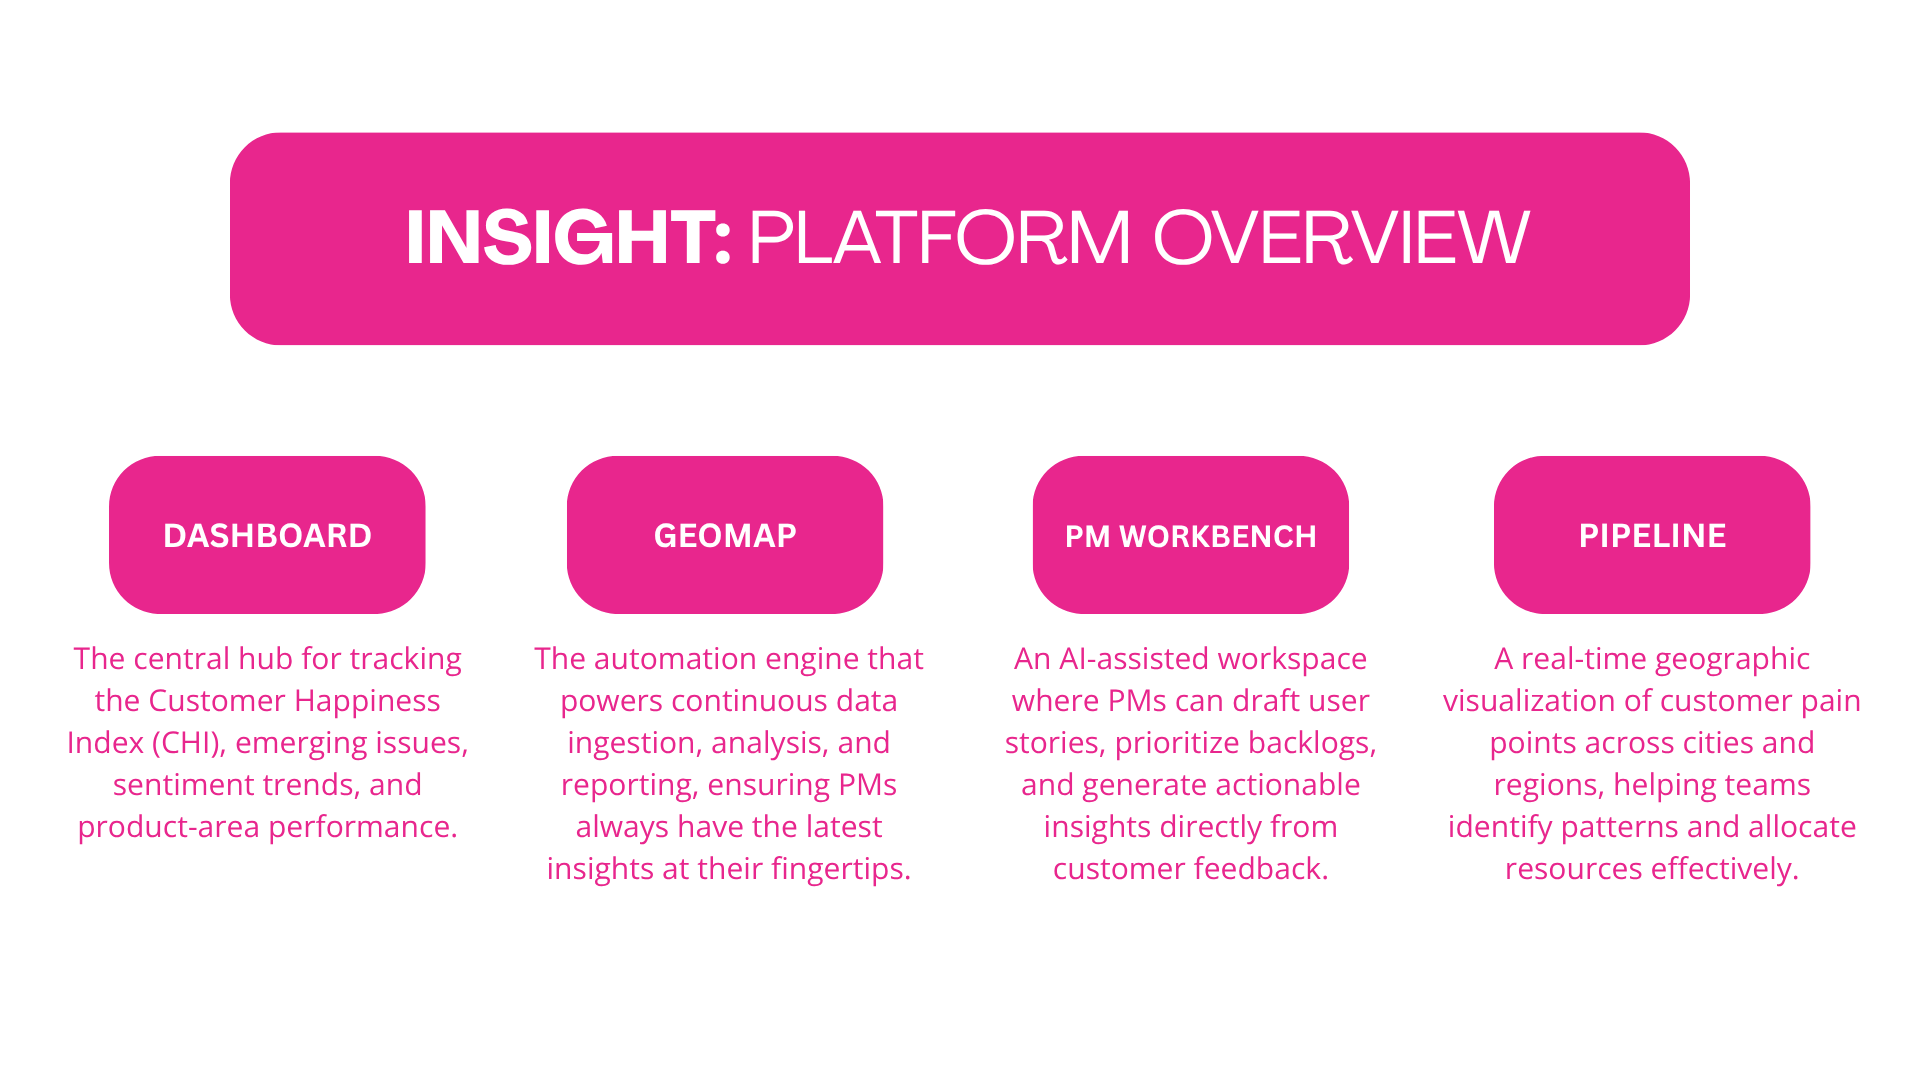
- Consolidates multi‑source customer signals (Reddit, outage trackers, community forums, internal feedback) into a unified timeline.
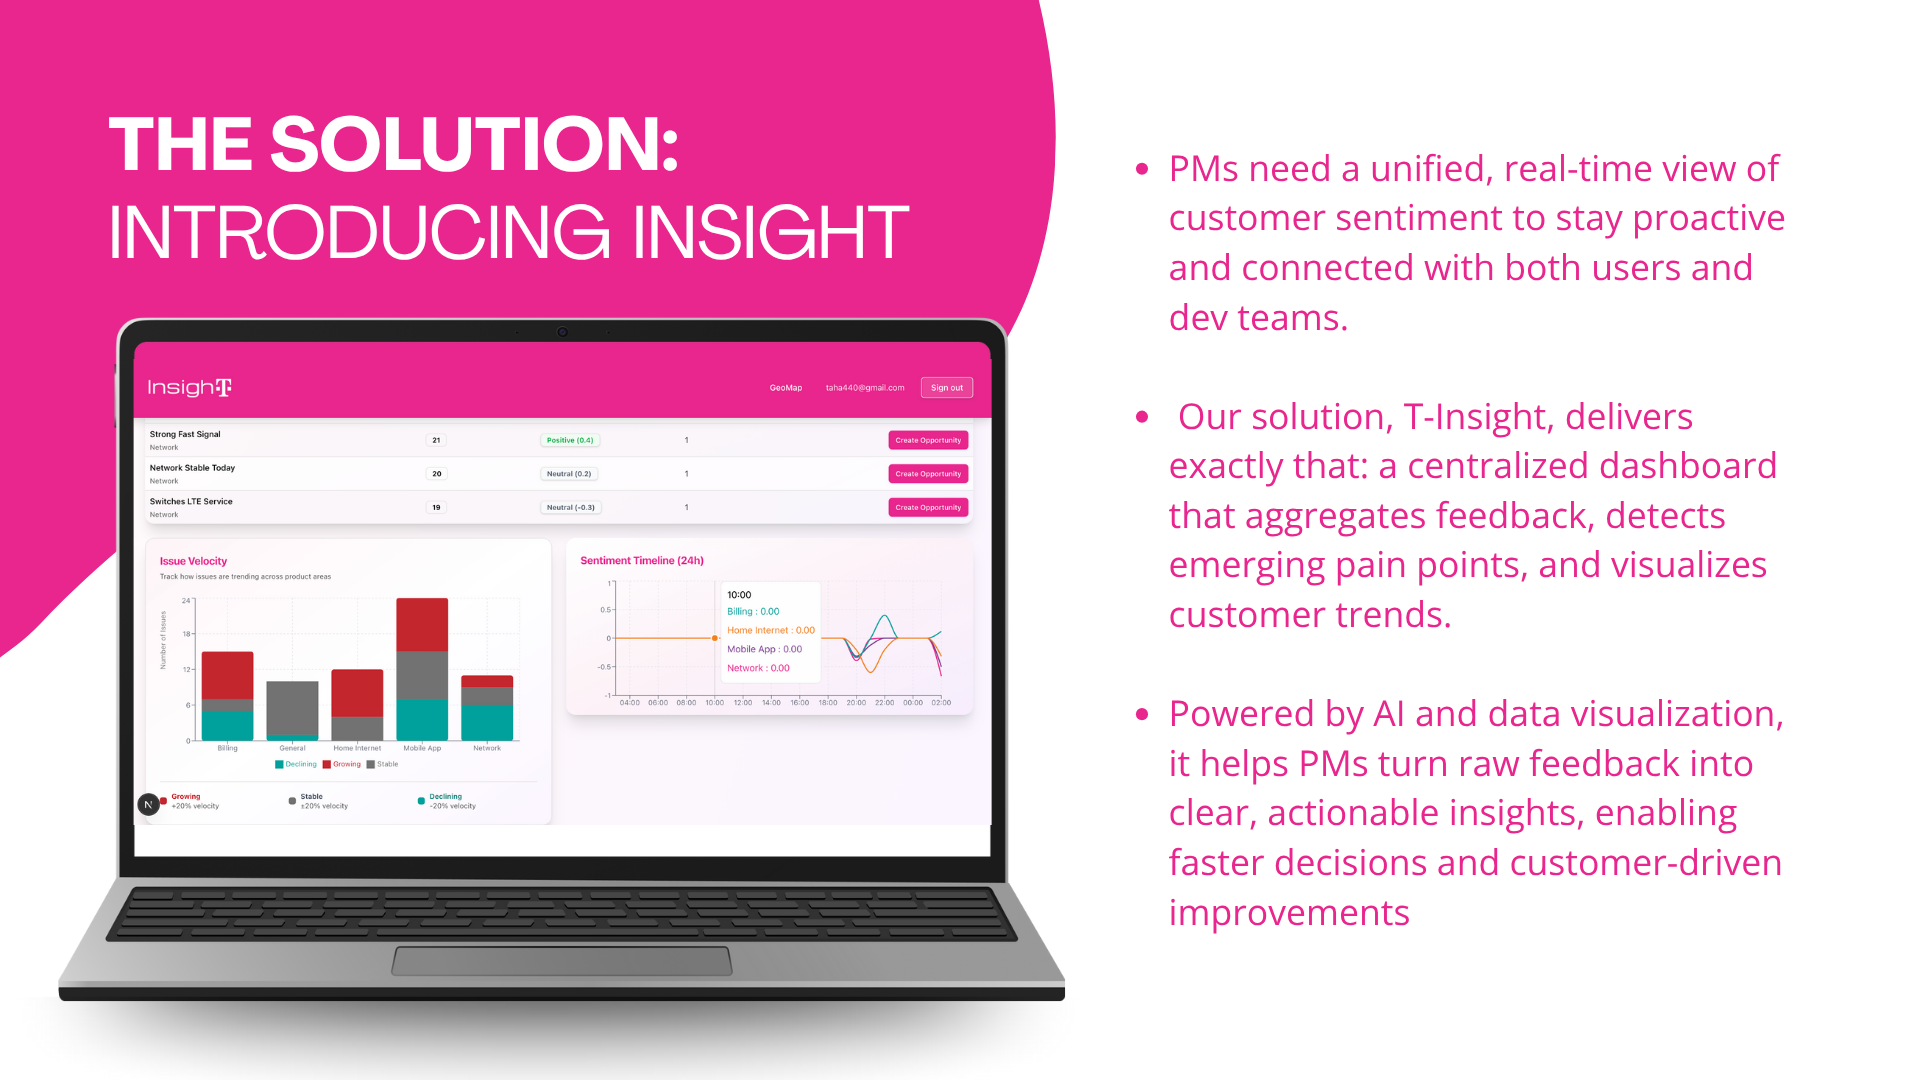
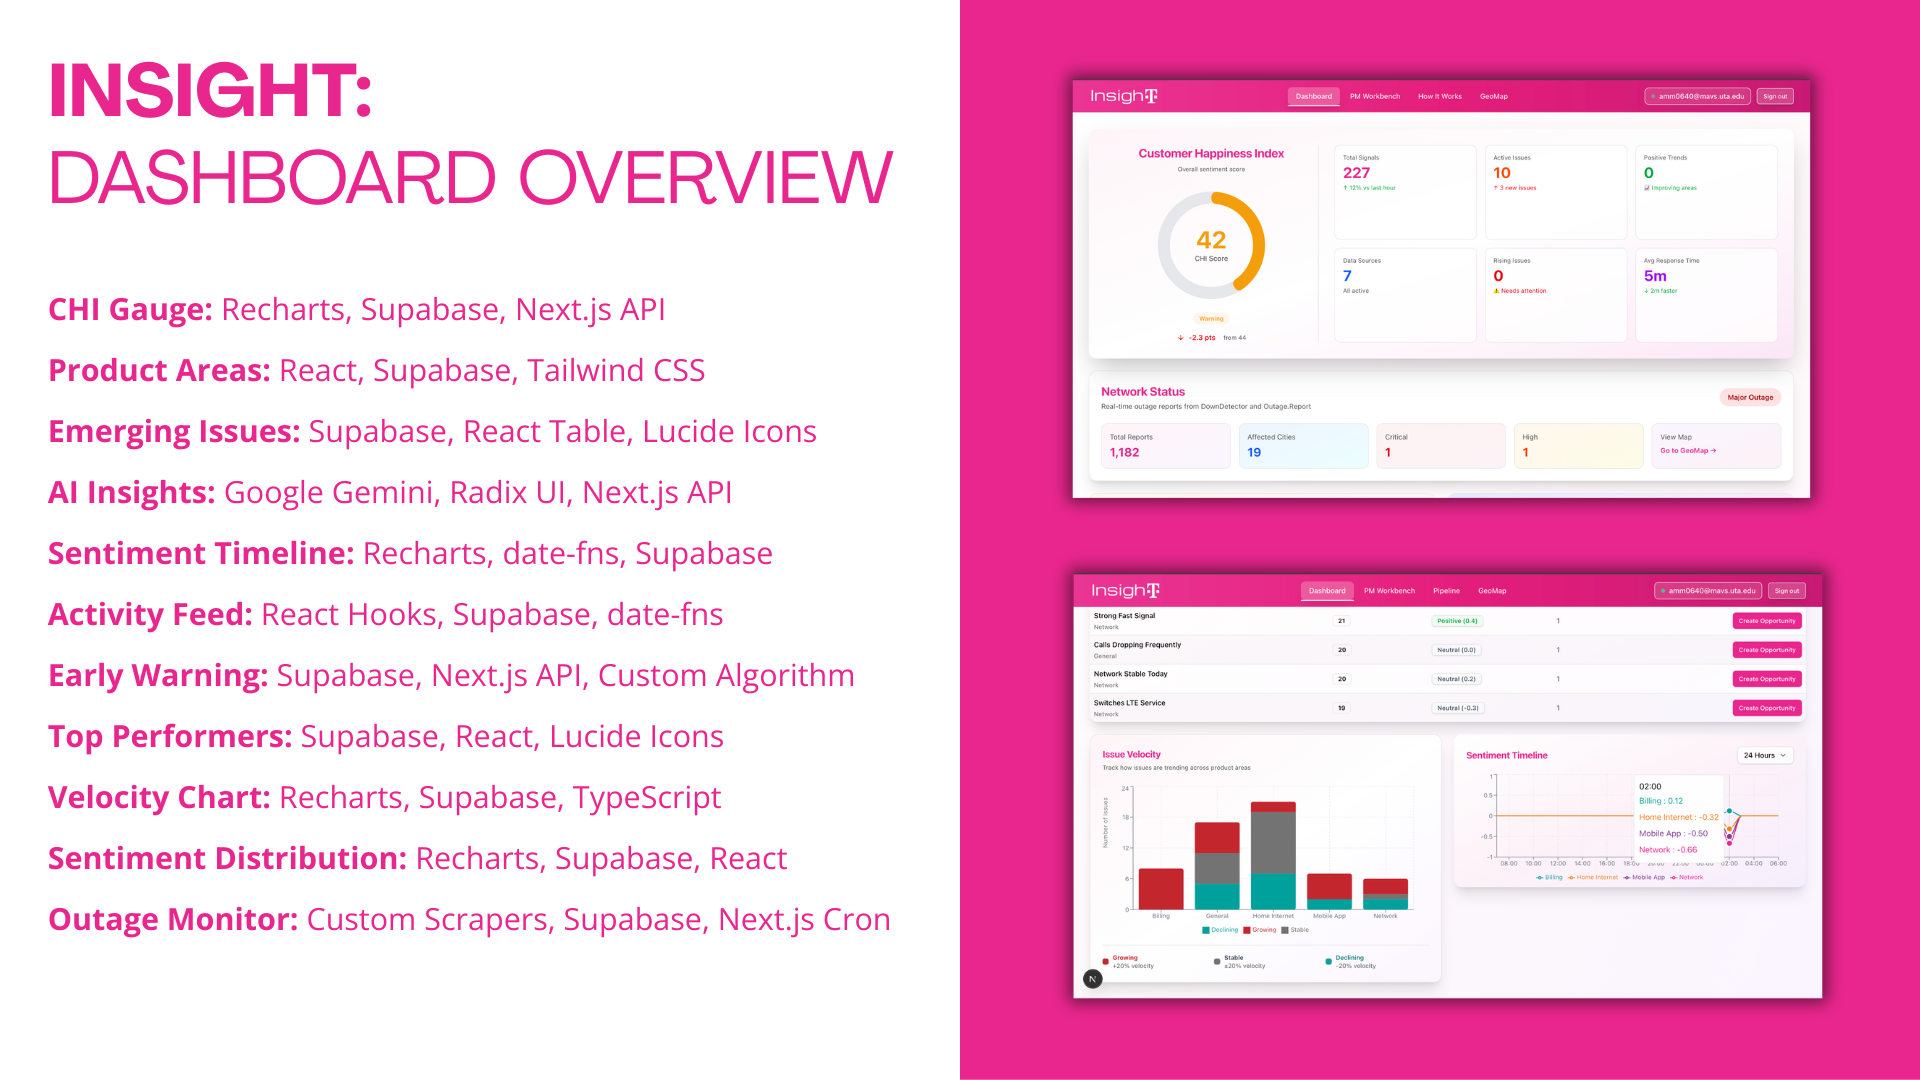
- Computes a Customer Happiness Index (CHI) and trends by product area (Network, Mobile App, Billing, Home Internet).
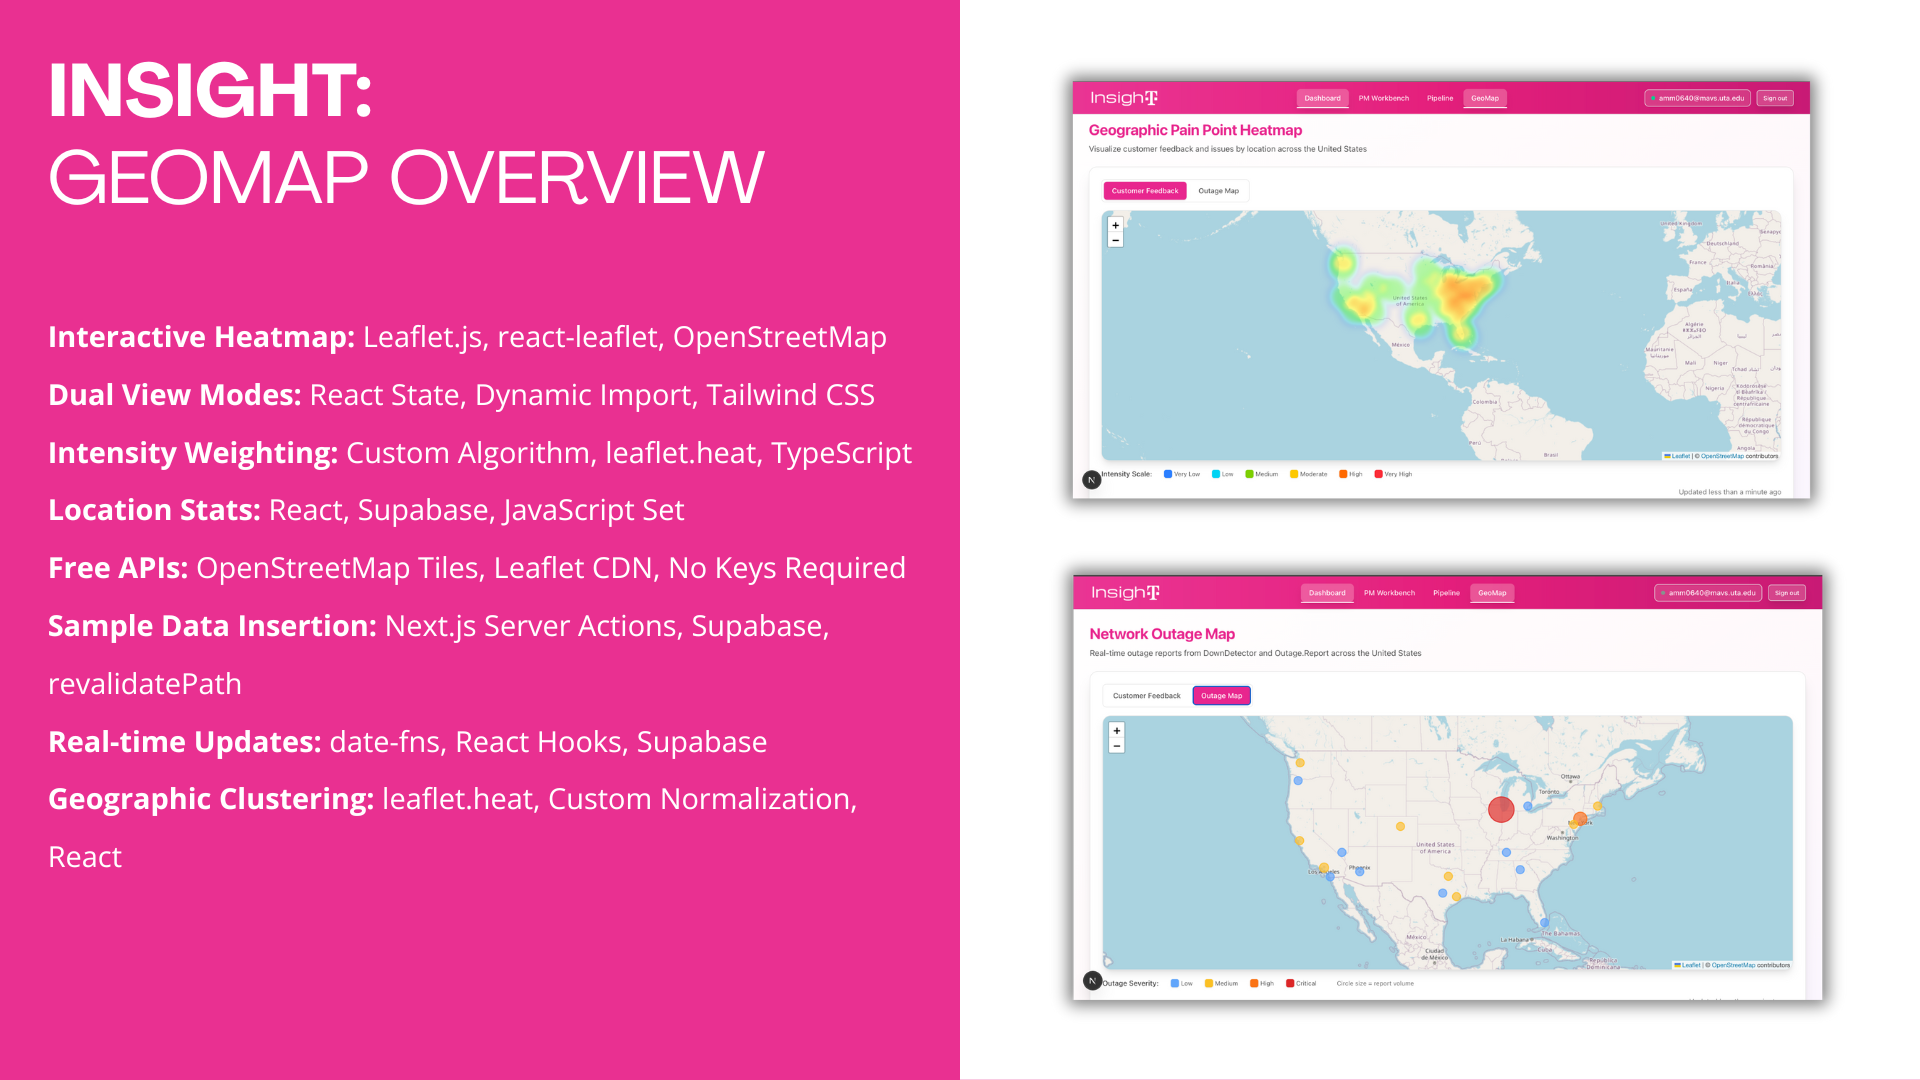
- Visualizes geographic clusters via a Leaflet heatmap and overlays live outage markers.
- Surfaces “Top Emerging Issues” ranked by intensity and sentiment.
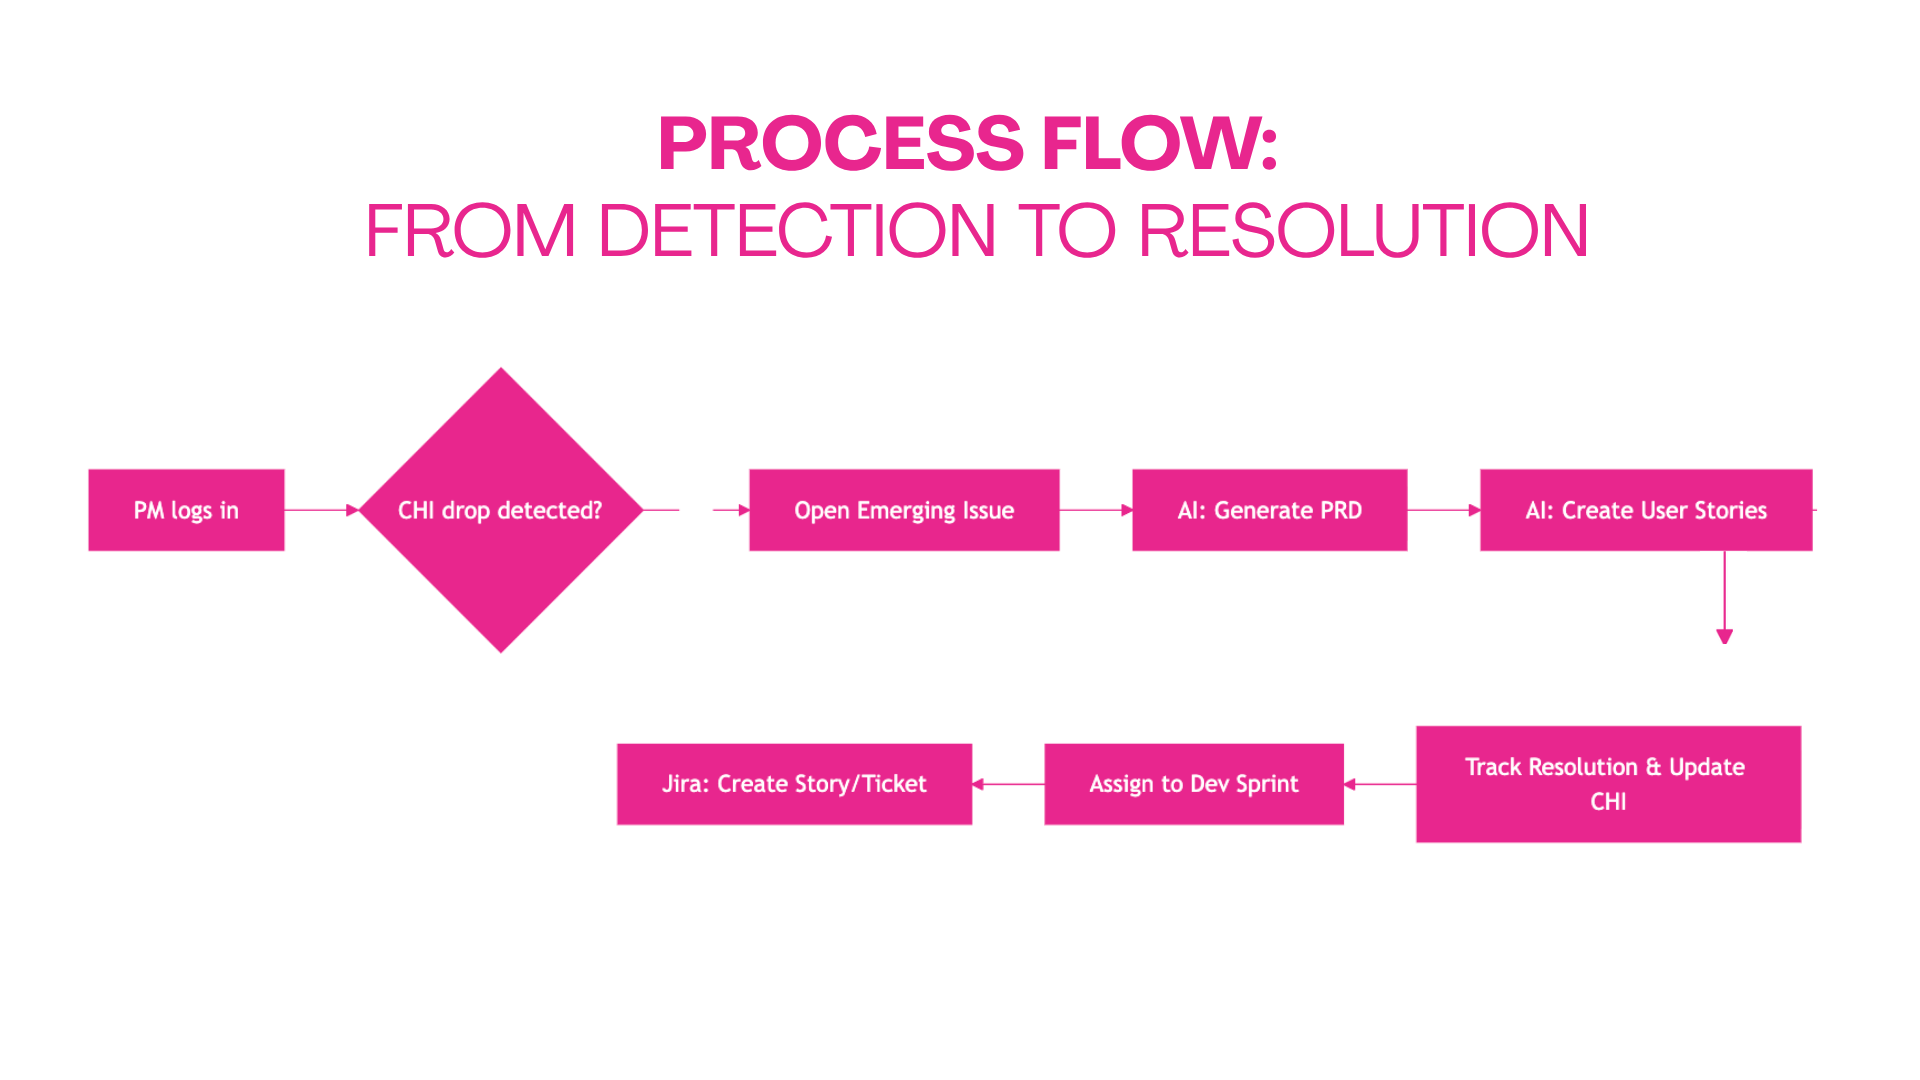
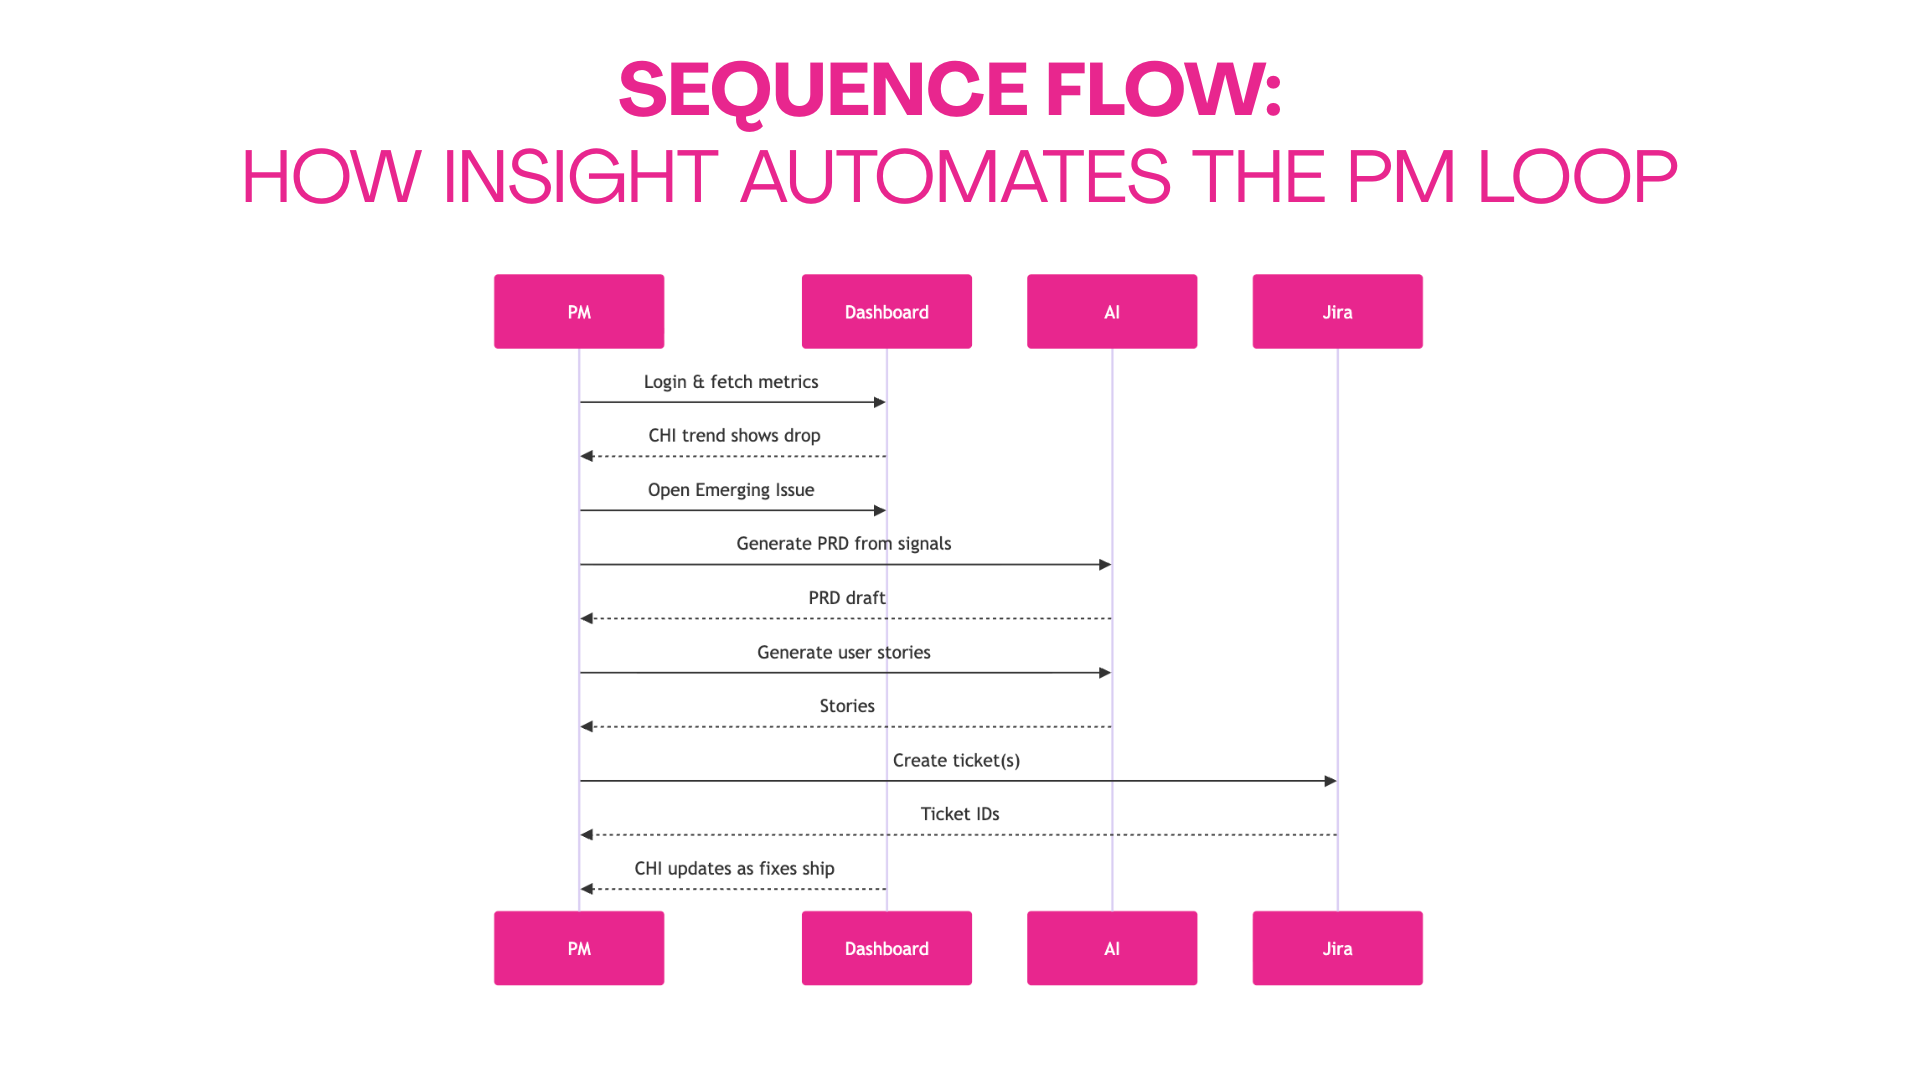
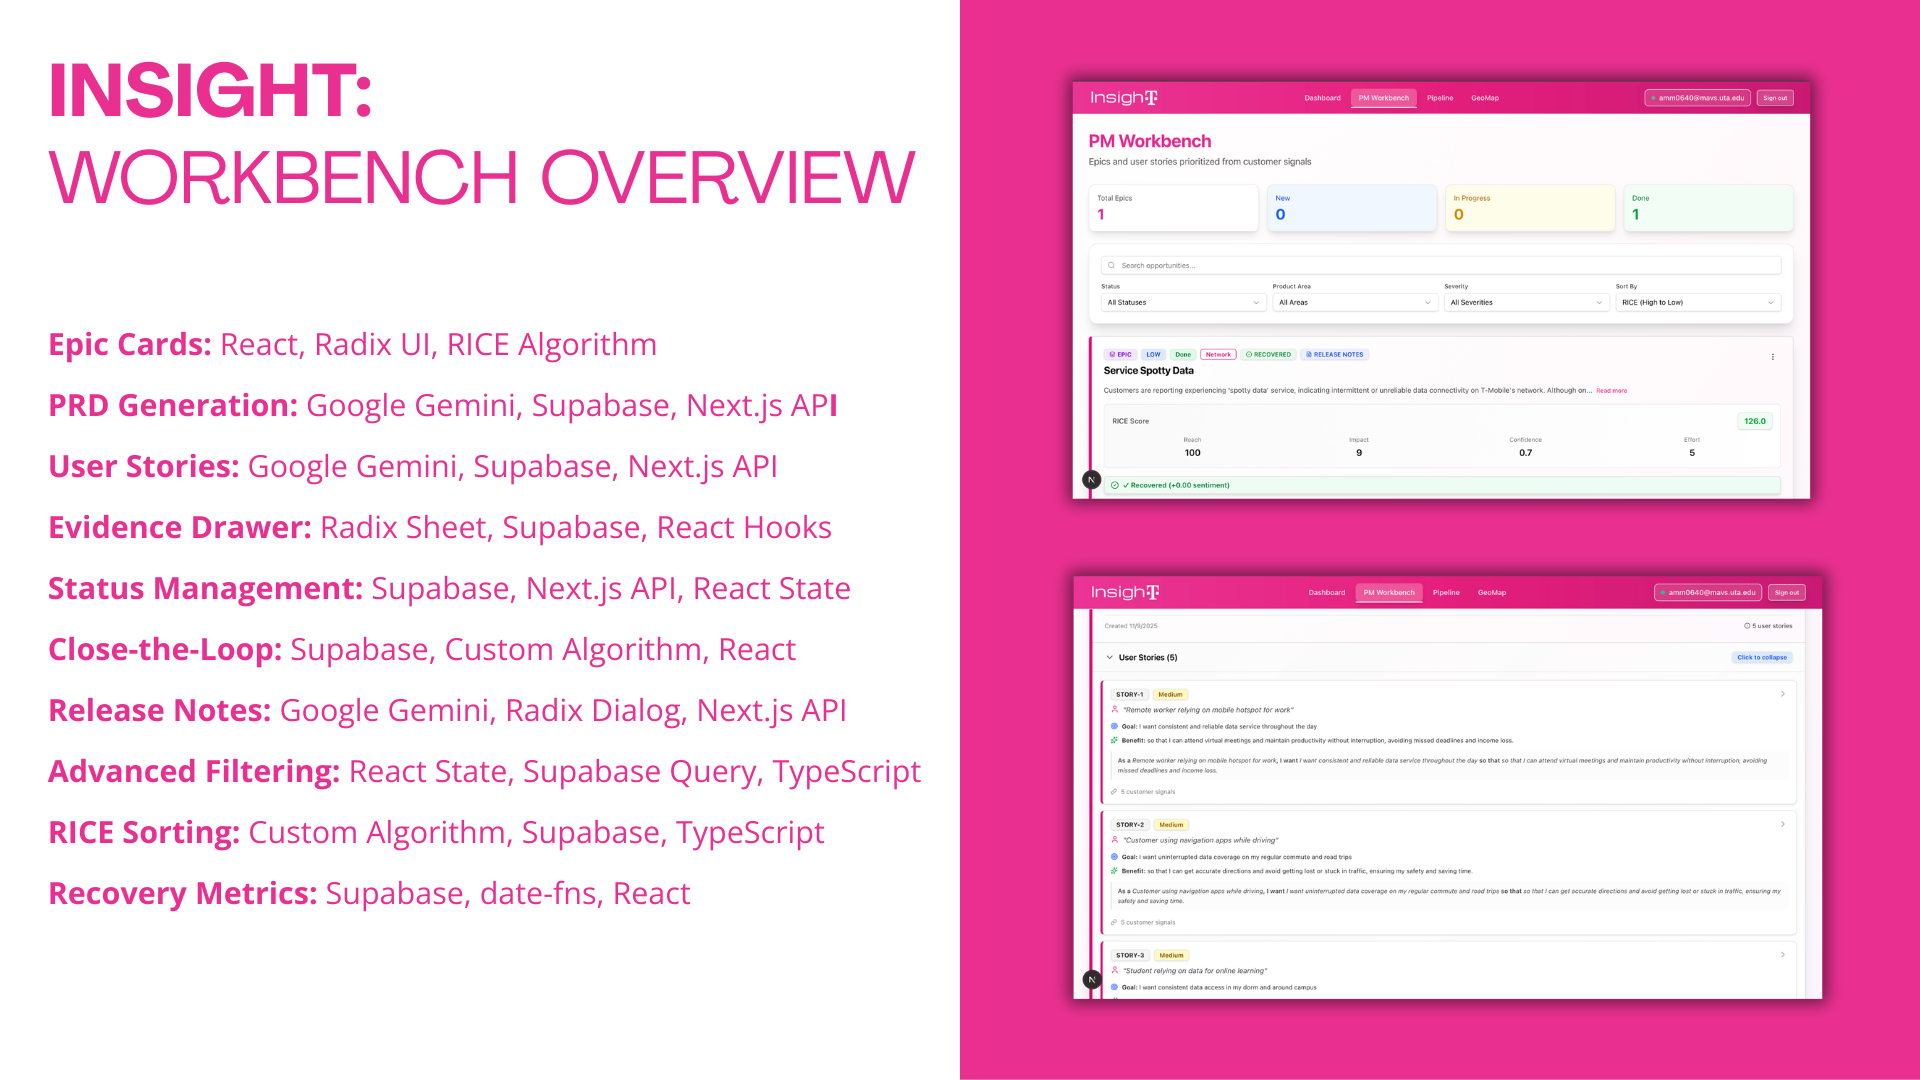
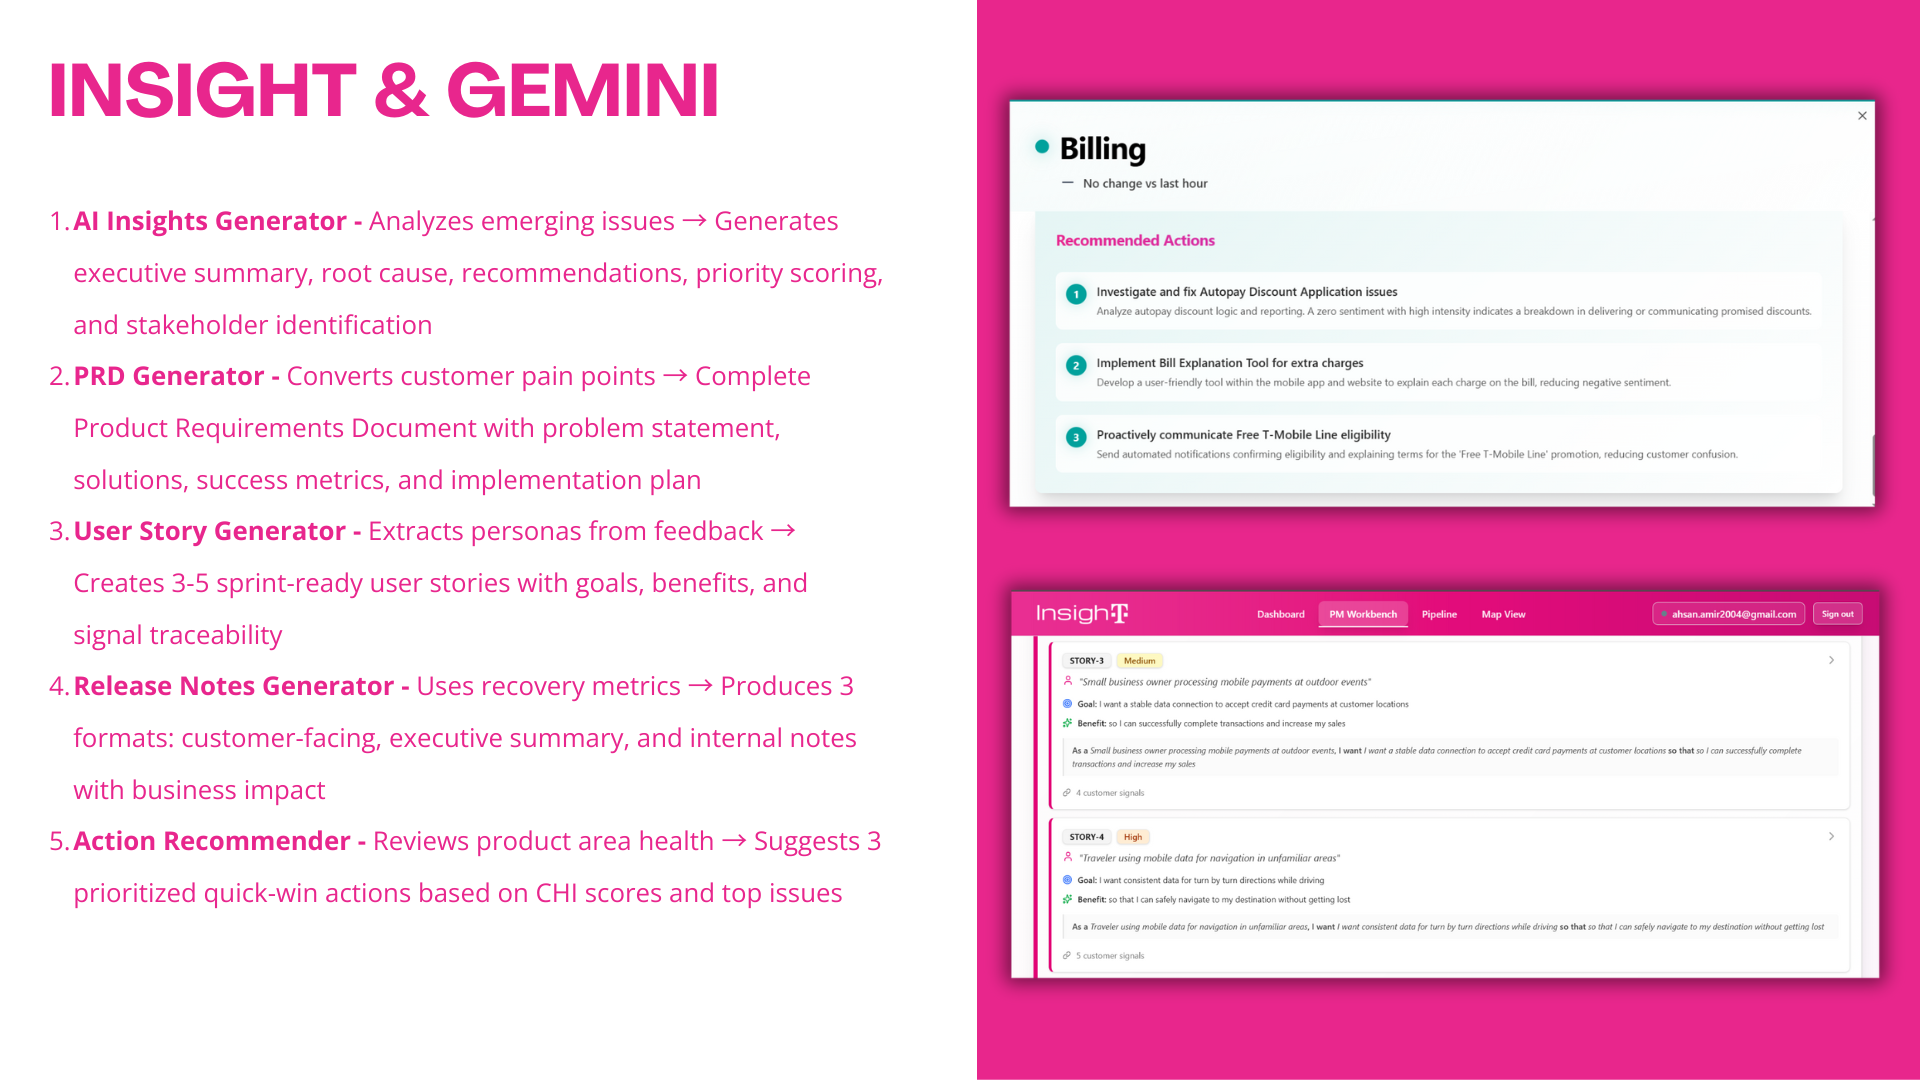
- Generates AI‑powered, actionable opportunities with priority/urgency, root cause analysis, recommended actions, impact, and stakeholders using Google Gemini 2.0 Flash.
- Provides a clean, on‑brand dashboard with charts (Recharts), timelines, distribution, source breakdown, and an early‑warning panel.
How we built it
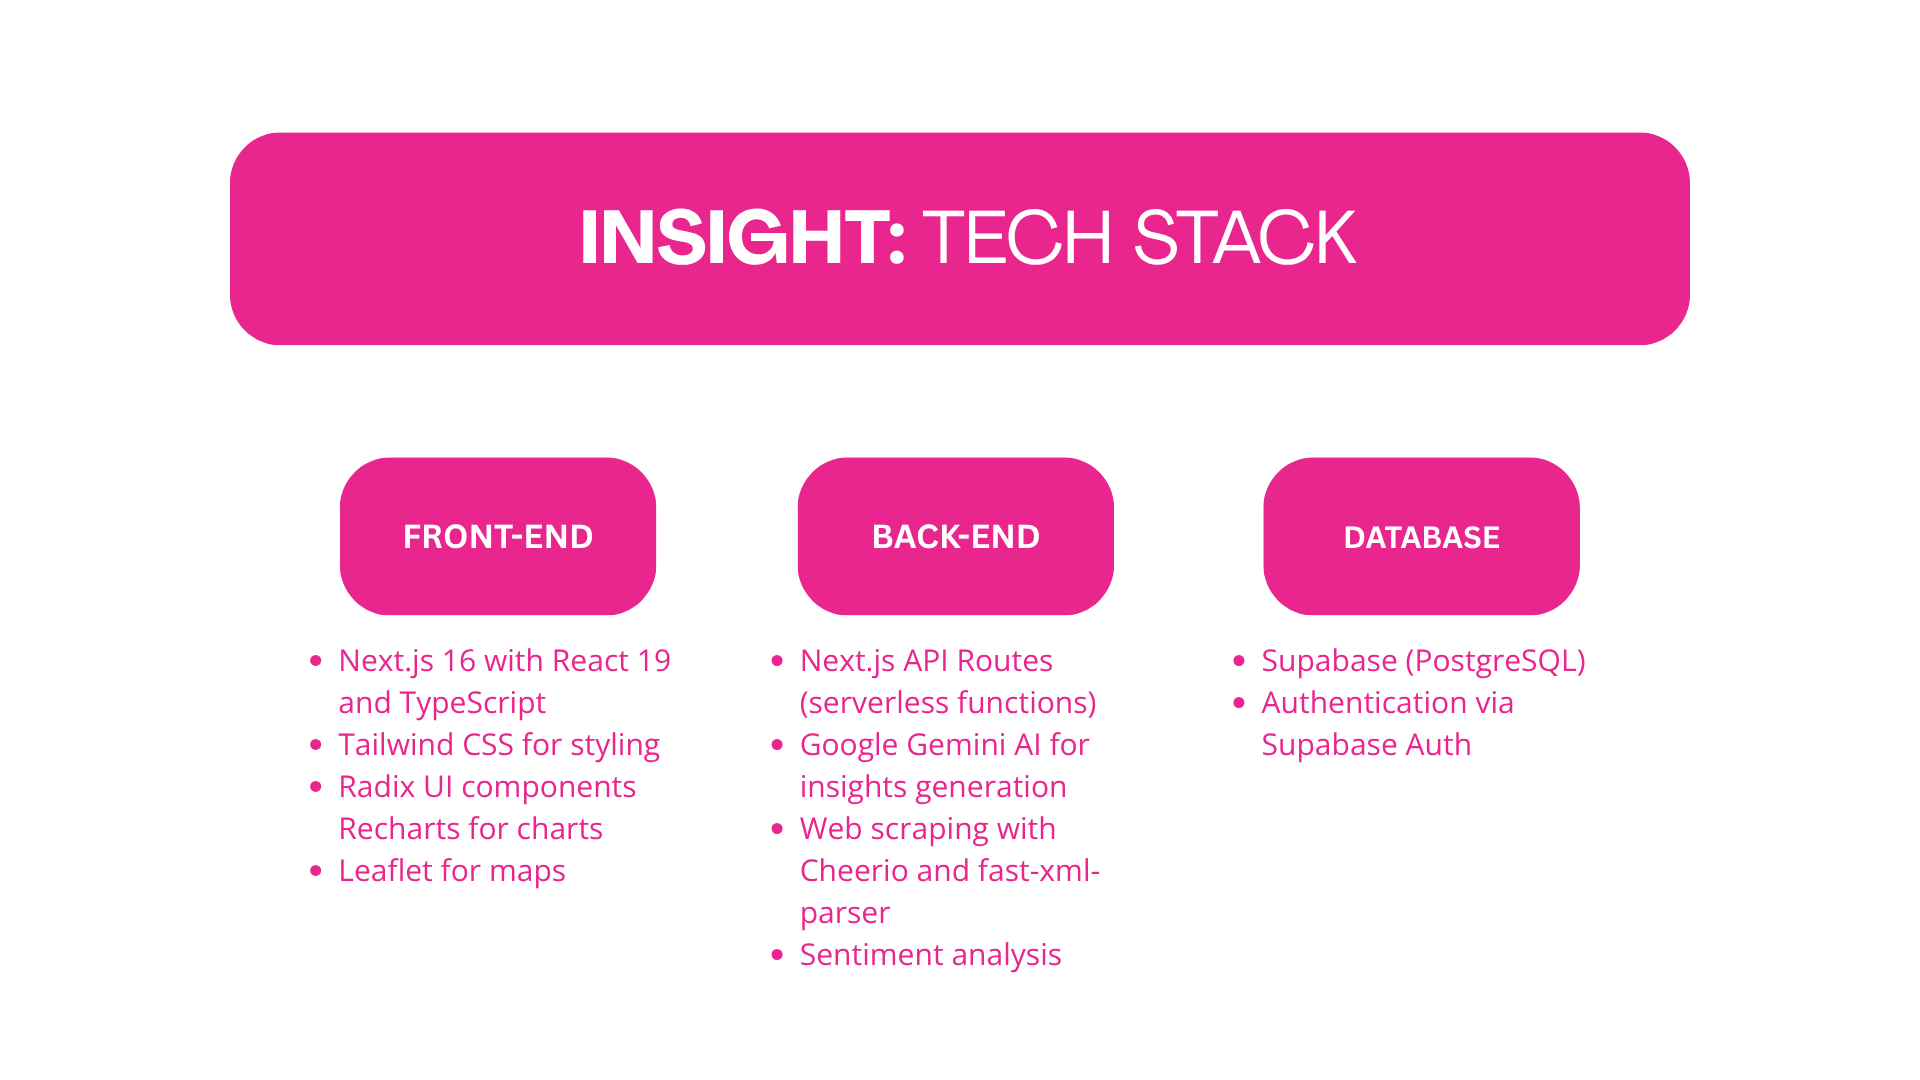
- Frontend: Next.js (App Router), React, TypeScript, Tailwind, Radix UI.
- Data: Supabase (Postgres, RLS), server actions, SSR/edge‑friendly API routes.
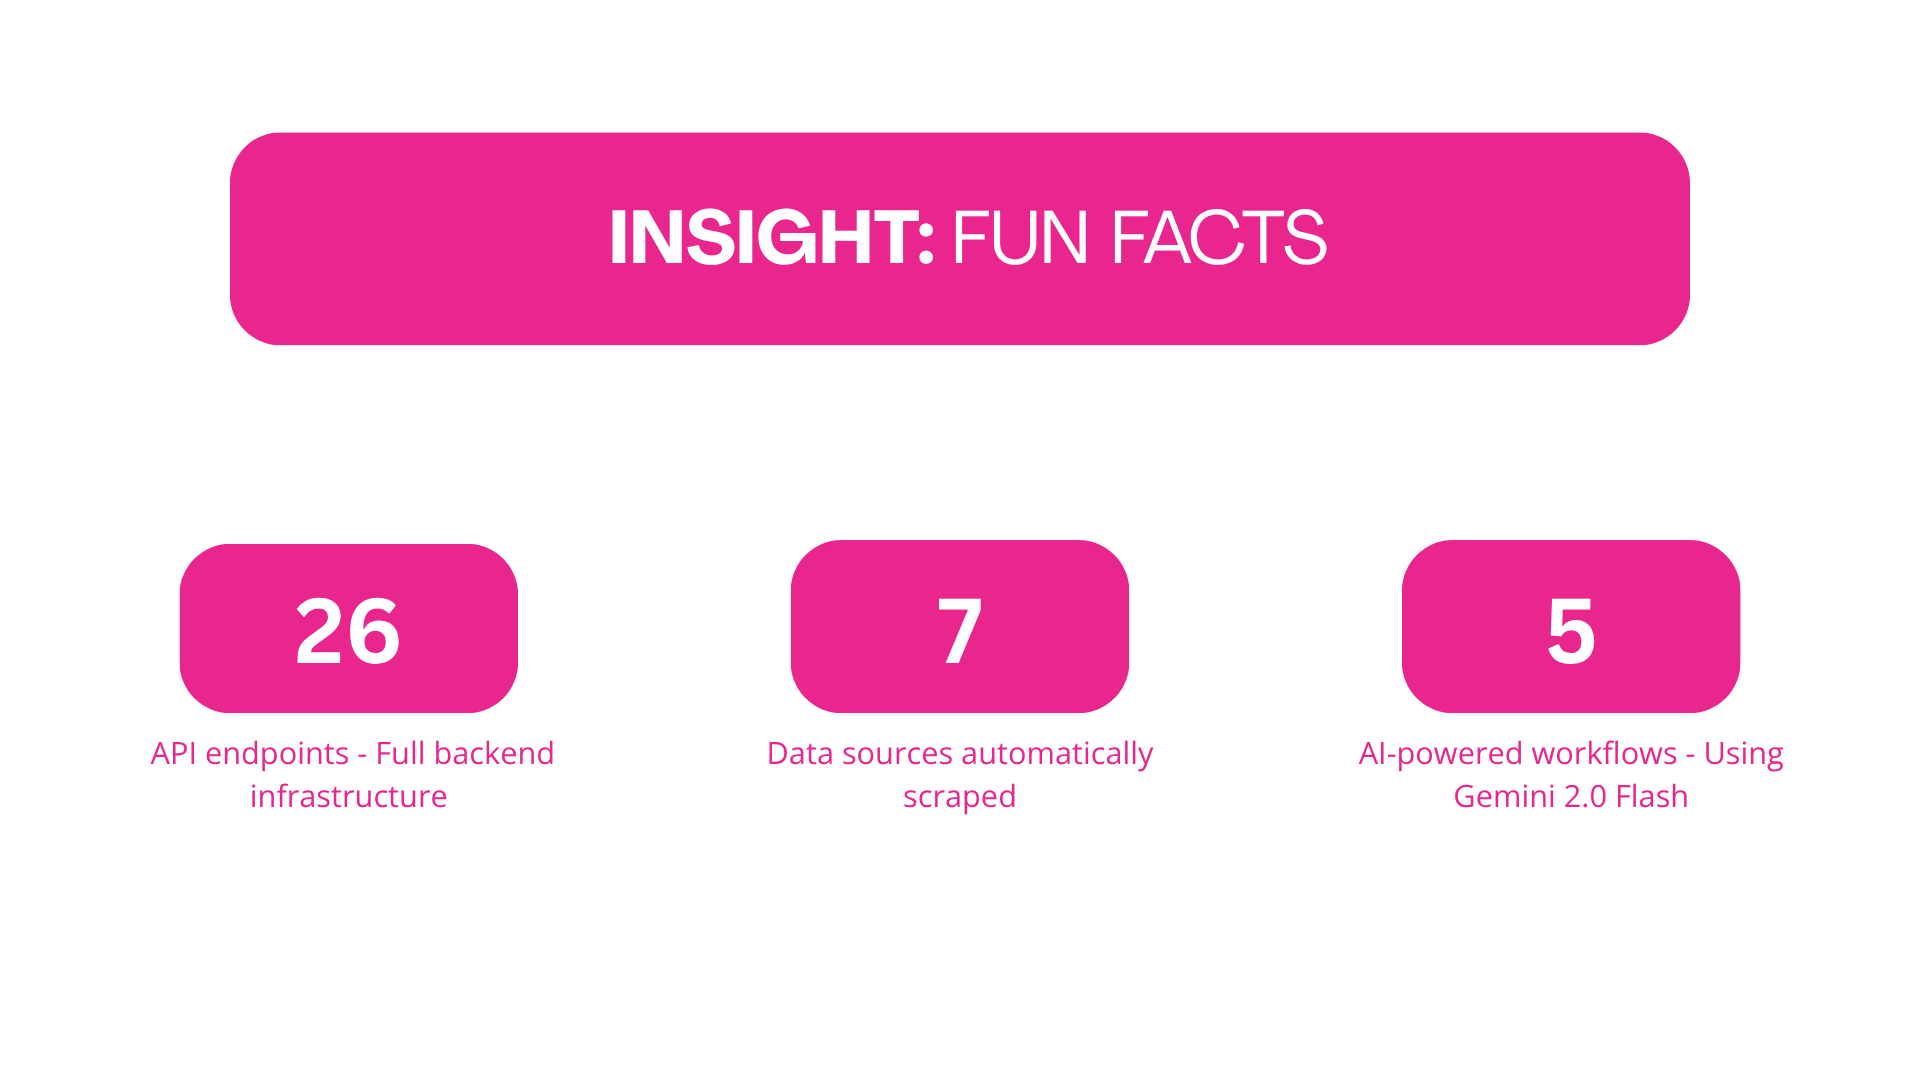
- Ingestion: Scrapers for Reddit, News, DownDetector, IsTheServiceDown, Outage.Report, plus customer feedback; processed into normalized “signals”.
- Processing: Sentiment scoring, topic detection, deduplication/merging, and intensity weighting.
- Geo: Leaflet + react‑leaflet + leaflet.heat with OpenStreetMap tiles and Nominatim geocoding.
- Visualizations: Recharts for CHI, timelines, distribution; custom UI for issue velocity and early warnings.
- AI: Google Gemini 2.0 Flash for insights on emerging issues via secure server‑side API routes.
- Ops: CRON‑secured ingestion endpoint; environment variables for Supabase and Gemini.
Challenges we ran into
- SSR vs client‑only libraries: Leaflet requires the browser. Fixed with dynamic imports and a client wrapper.
- Hydration and z‑index conflicts: Resolved dialog/modal stacking over a sticky navbar; eliminated
<div>inside<p>hydration issues. - Model/version mismatches: Updated Gemini to 2.0 Flash and hardened error handling for model availability.
- Data sparsity and weighting: Tuned intensity/sentiment normalization so heatmaps show meaningful medium/high hotspots (not only “low blue”).
- Time windows: Standardized 24‑hour windows with graceful fallbacks for empty datasets and added diagnostics.
Accomplishments that we're proud of
- A cohesive, brand‑aligned PM dashboard that goes from raw signals to actionable opportunities.
- Real‑time, geo‑aware heatmaps and outage overlays using only free mapping/geocoding services.
- AI‑generated, non‑generic recommendations with priority/urgency and stakeholders—useful out of the box.
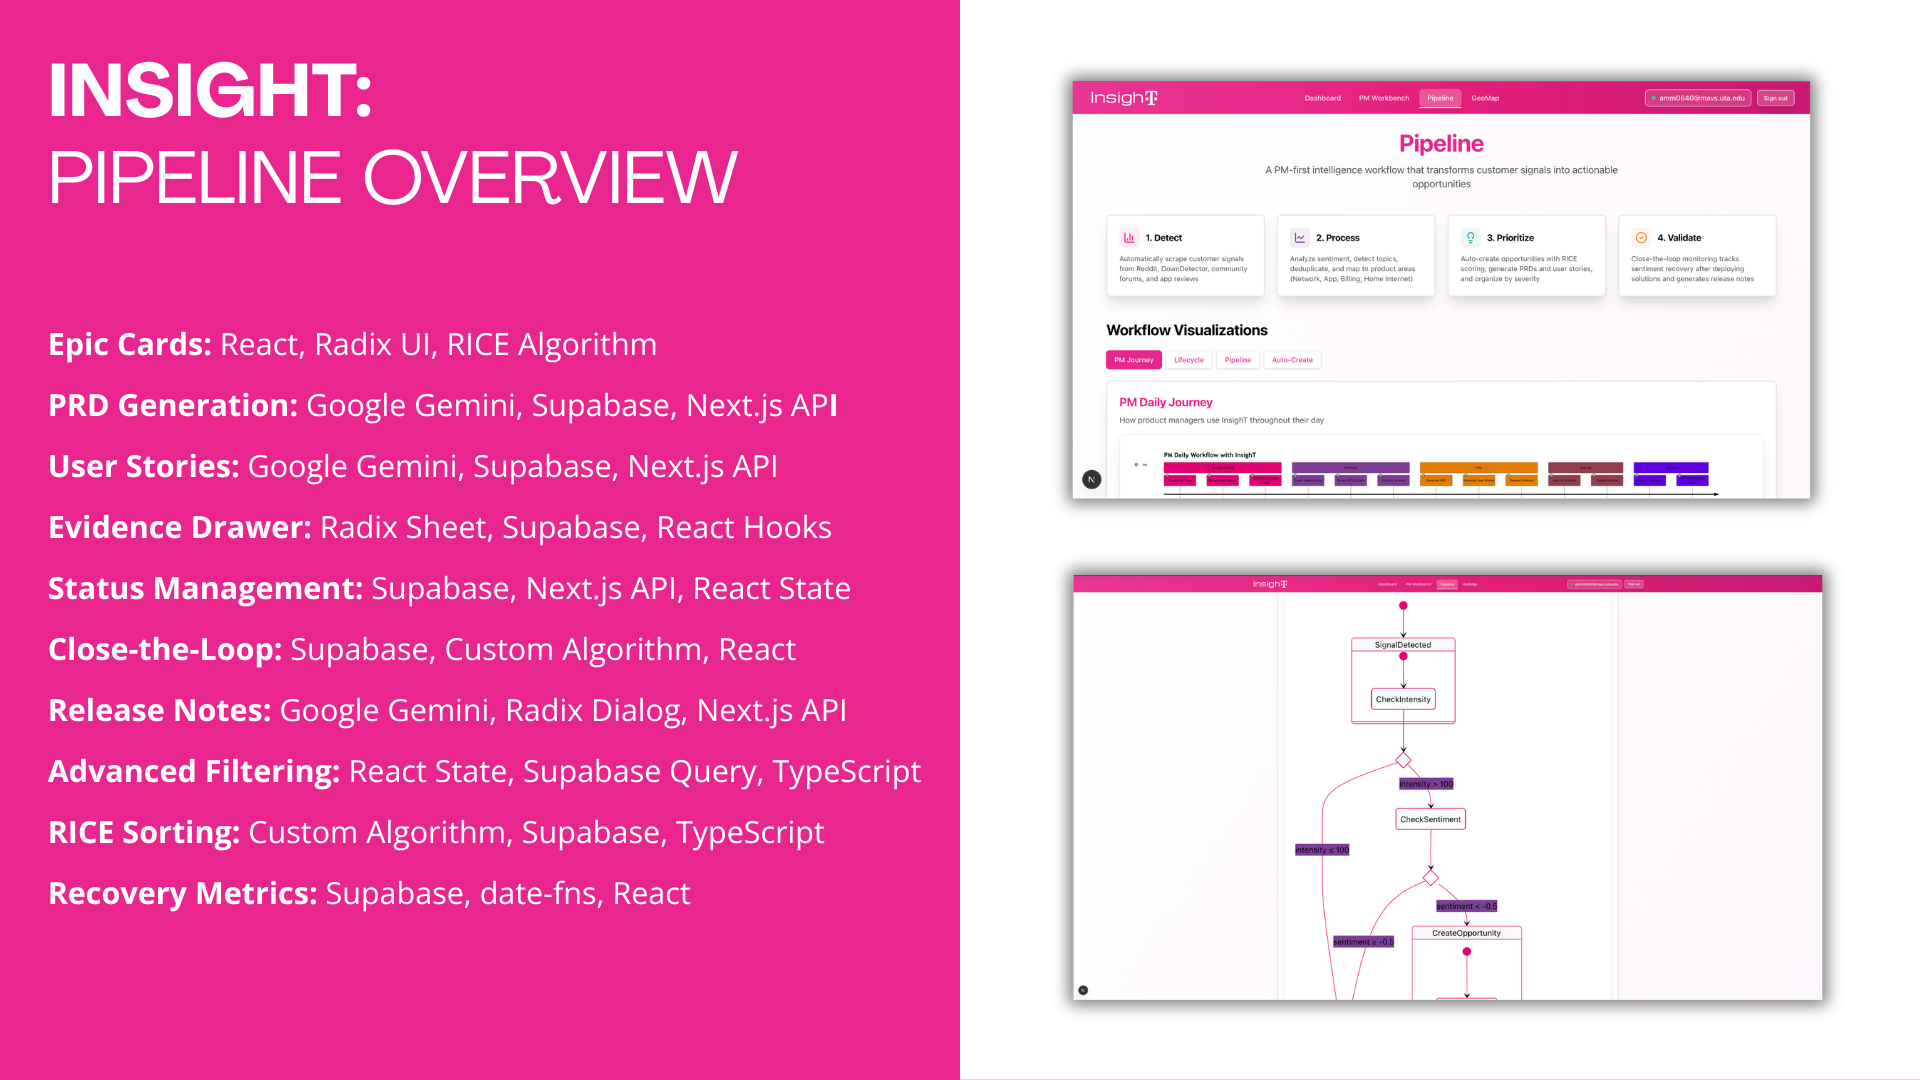
- Robust ingestion + processing pipeline with deduplication and topic detection.
- Clean, accessible UI with responsive layouts and clear information hierarchy.
What we learned
- Designing for SSR + client‑only libs requires disciplined boundaries and dynamic loading.
- Weighting and normalization are critical for trustworthy visual signals (especially heatmaps).
- Good AI prompts and response validation dramatically improve actionability.
- Small DX investments (diagnostic logs, fallbacks, typed schemas) accelerate debugging and iteration.
What’s next for InsighT
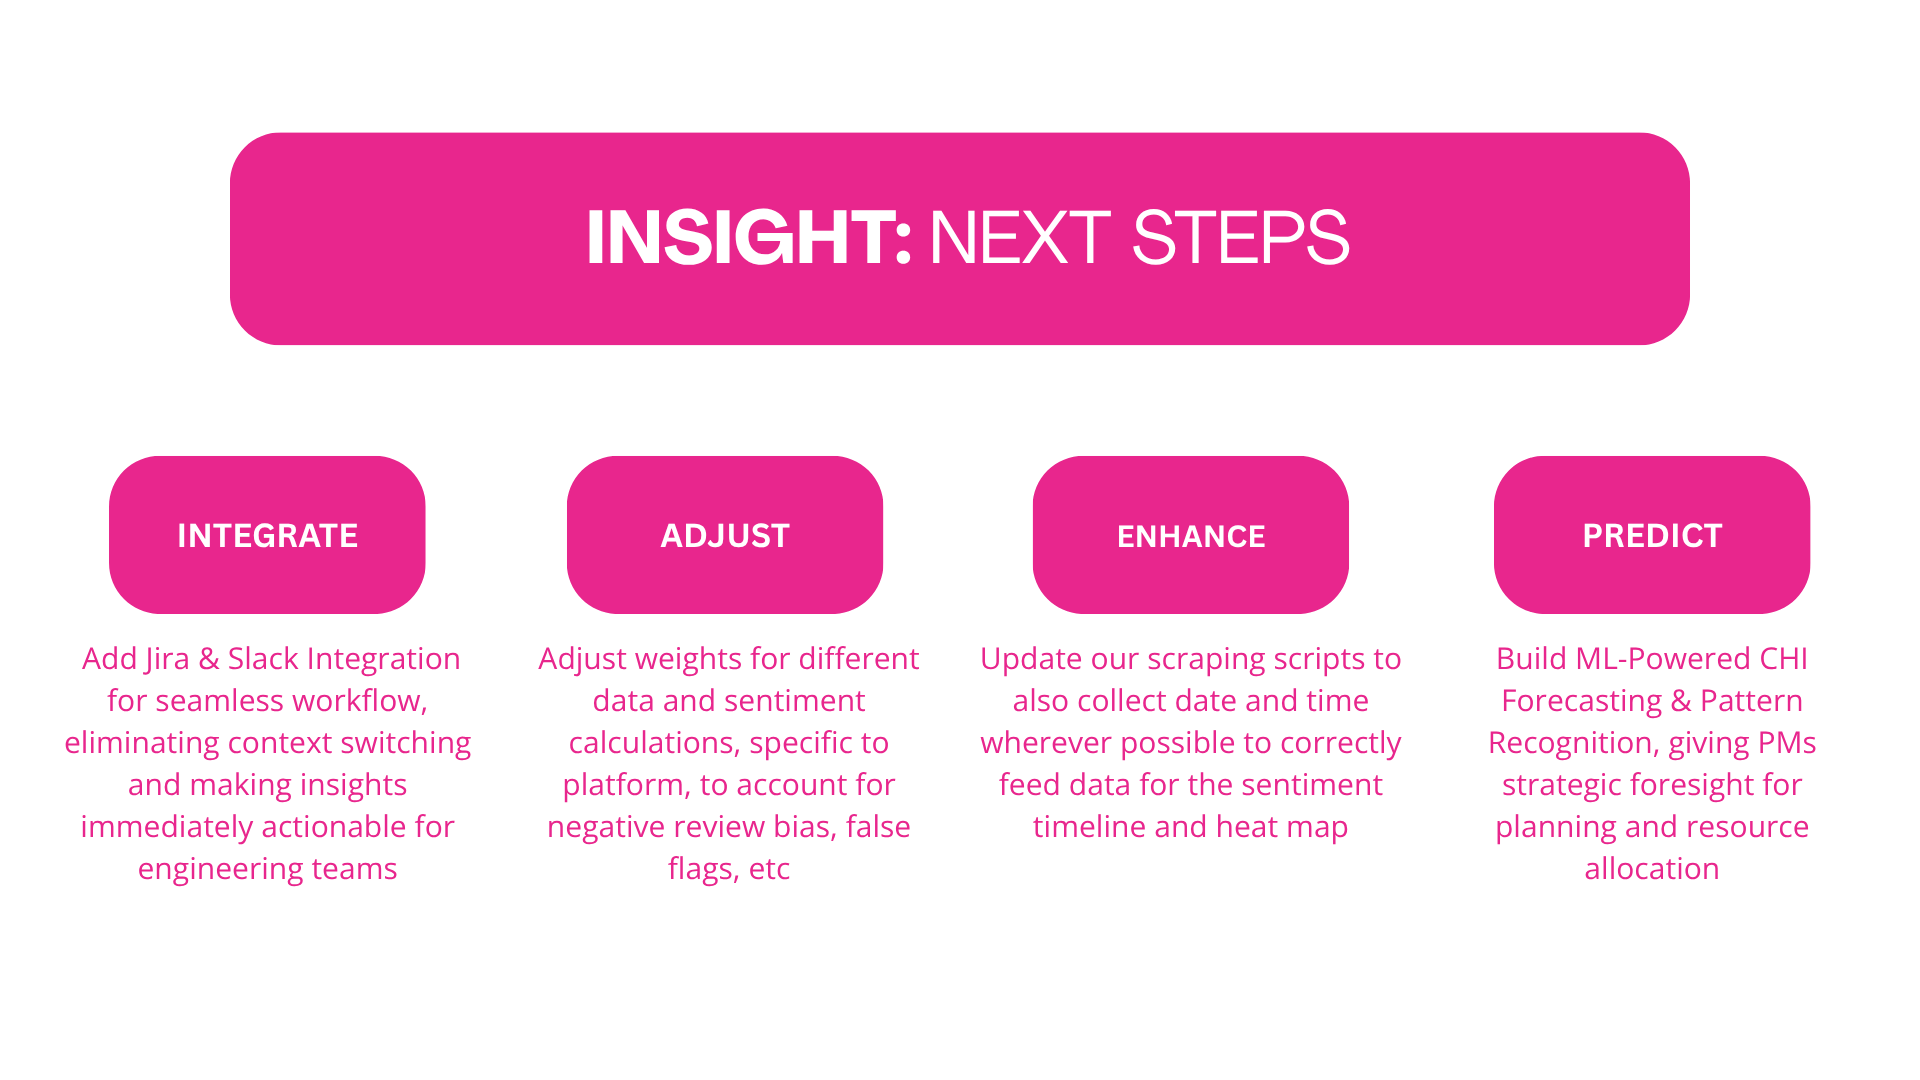
- Real‑time streaming updates via websockets for live dashboards.
- Advanced filters (time range, geo bounding boxes, product area, channel).
- Deeper ML: trend forecasting, anomaly detection, and clustering of root causes.
- Workflow integrations (Jira/Linear/Slack) to turn insights into tracked opportunities.
- Team collaboration: comments, assignments, and change history.
- Mobile‑friendly PM views and alerting for critical spikes.
Built With
- cheerio
- css
- gemini
- next.js
- node.js
- postgresql
- radix
- react
- redditapi
- supabase
- tailwind
- typescript
- vercel


Log in or sign up for Devpost to join the conversation.