Inspiration
The idea for System Visualizer came from a very real frustration I faced as a developer.
While building projects, I often found myself asking:
- Will my system handle 100 concurrent users?
- What happens if my database goes down?
- Will this architecture scale… or silently fail?
Despite writing functional code, I lacked confidence in my system’s behavior under real-world conditions.
But this raised a deeper question:
If AI can build systems… who ensures those systems are architecturally sound?
That gap — between code generation and architecture validation — became the foundation of this project.
What System Visualizer Does
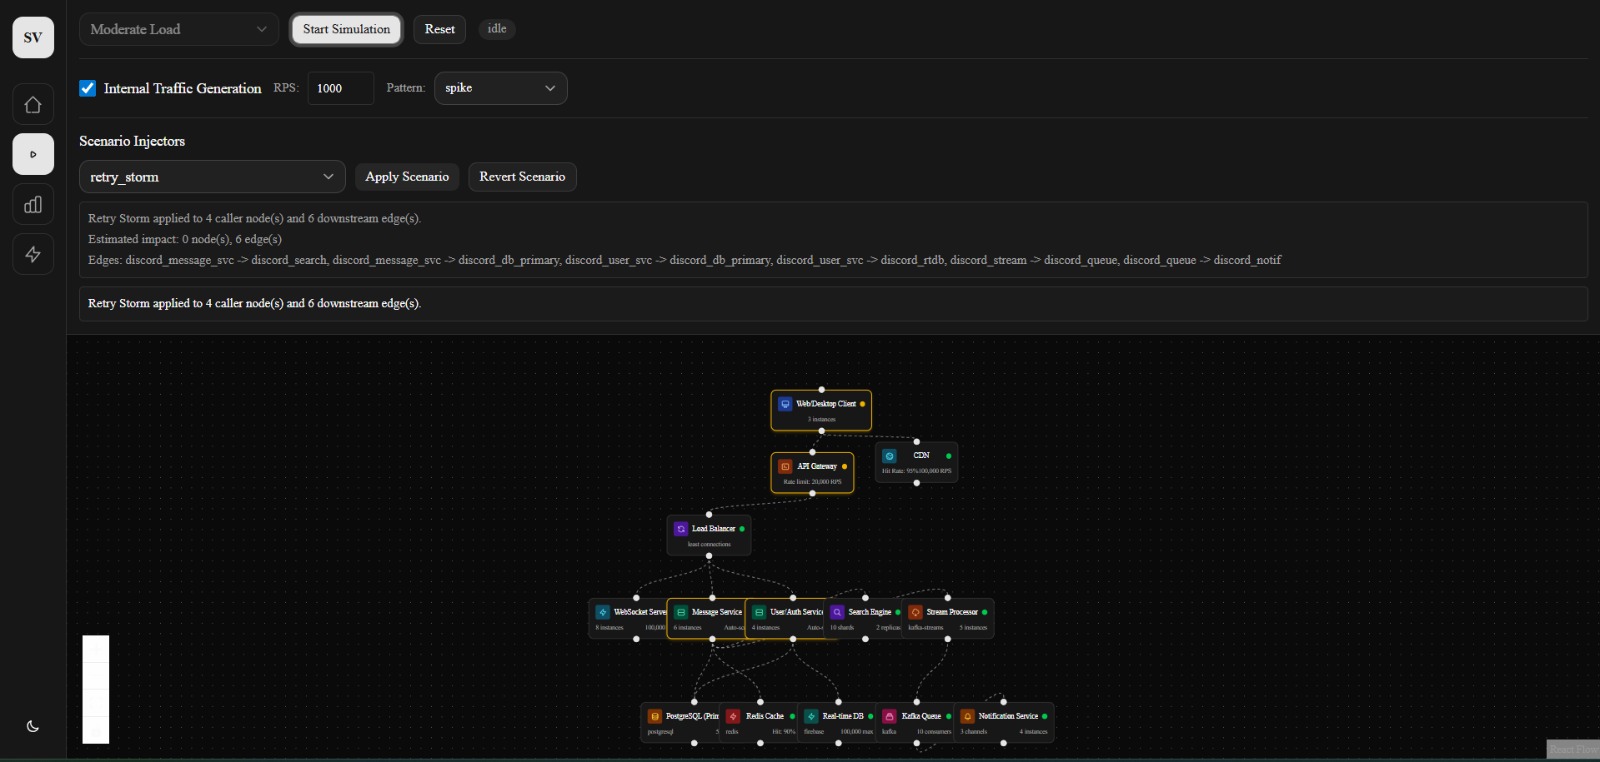
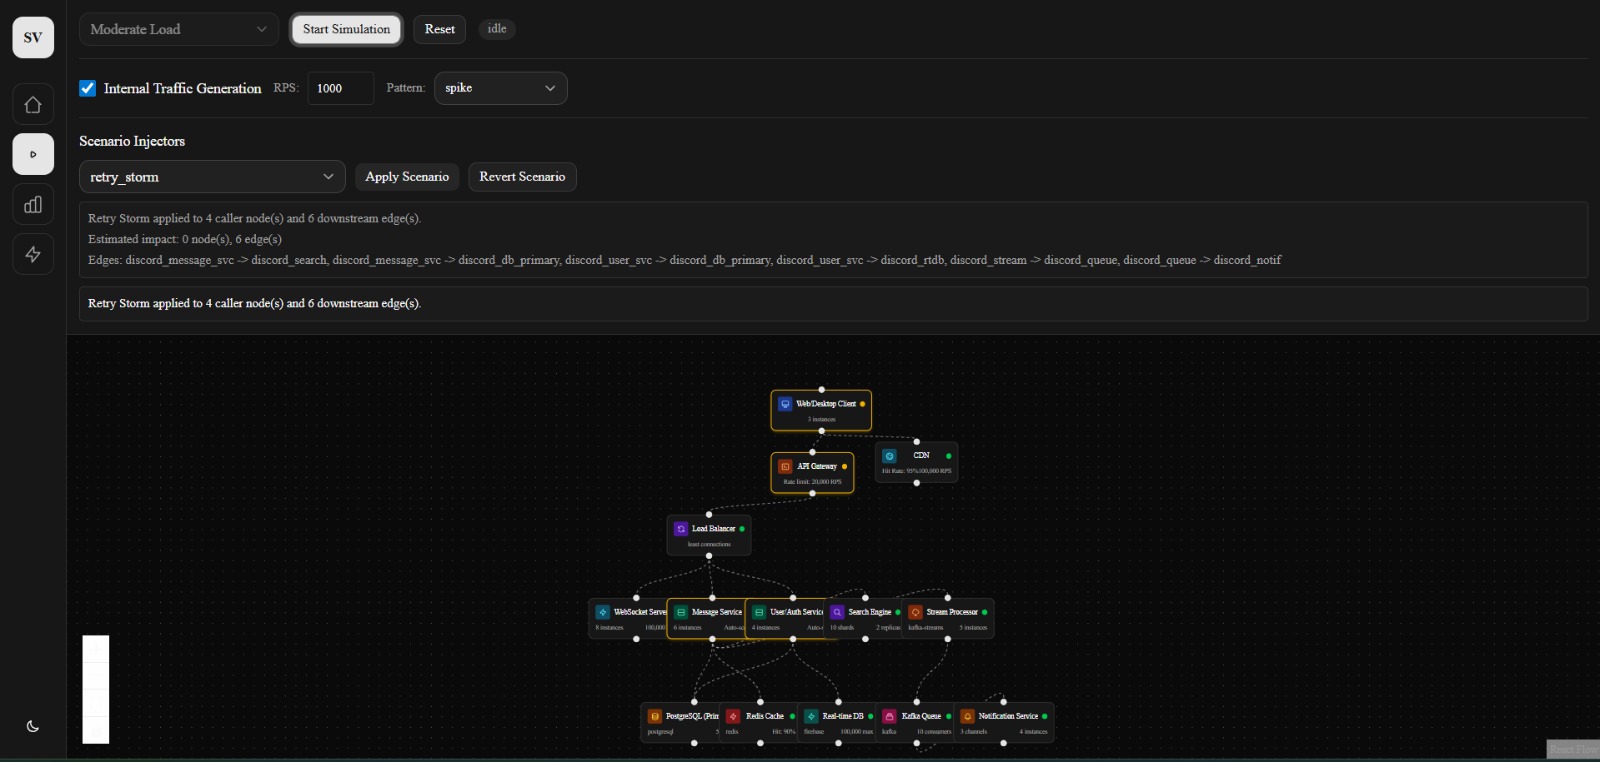
System Visualizer is a platform that allows developers, teams, and even non-developers to design, simulate, and analyze system architectures before deployment.
Core Capabilities:
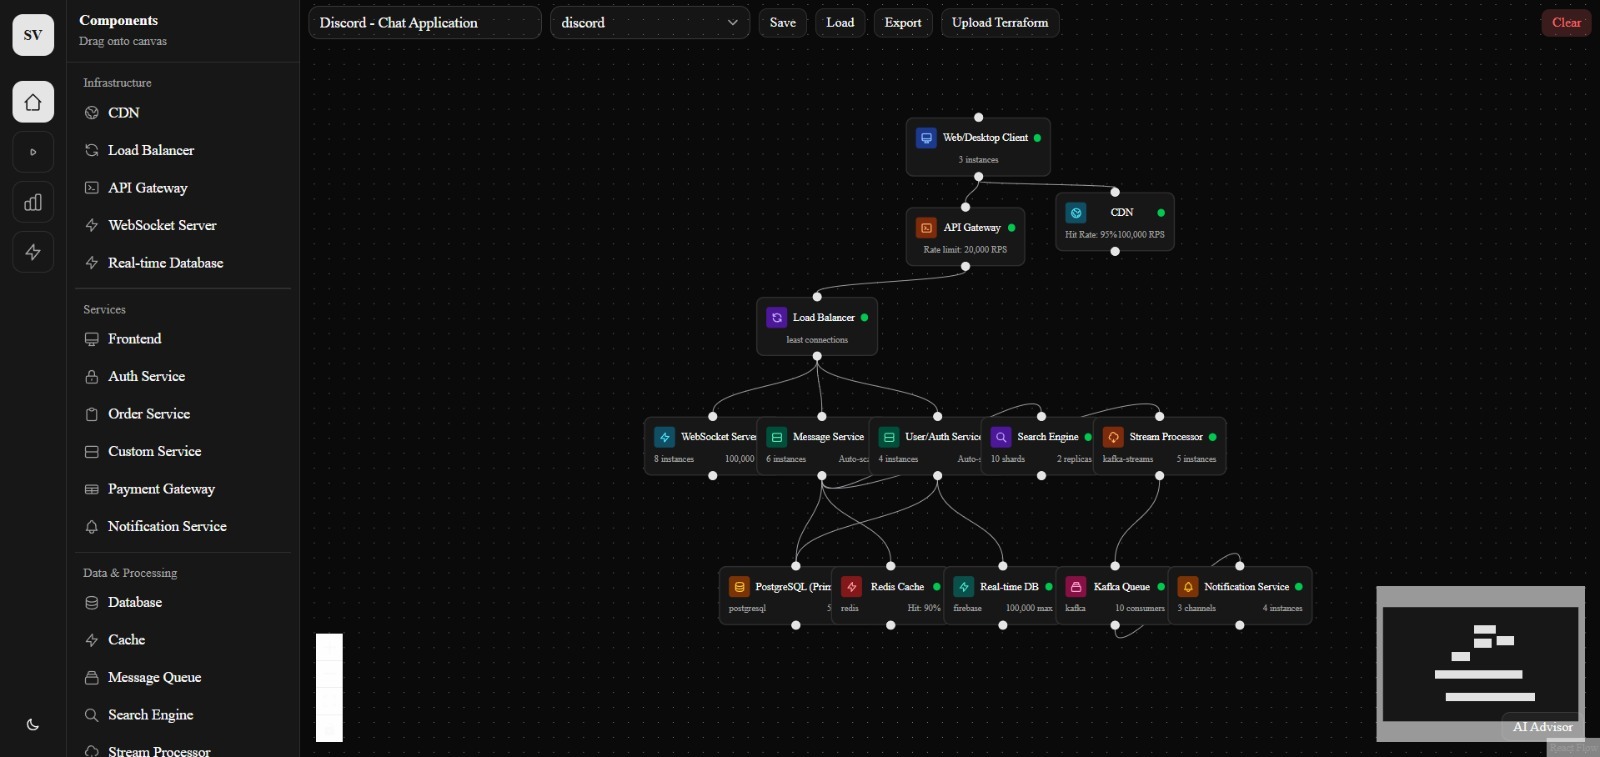
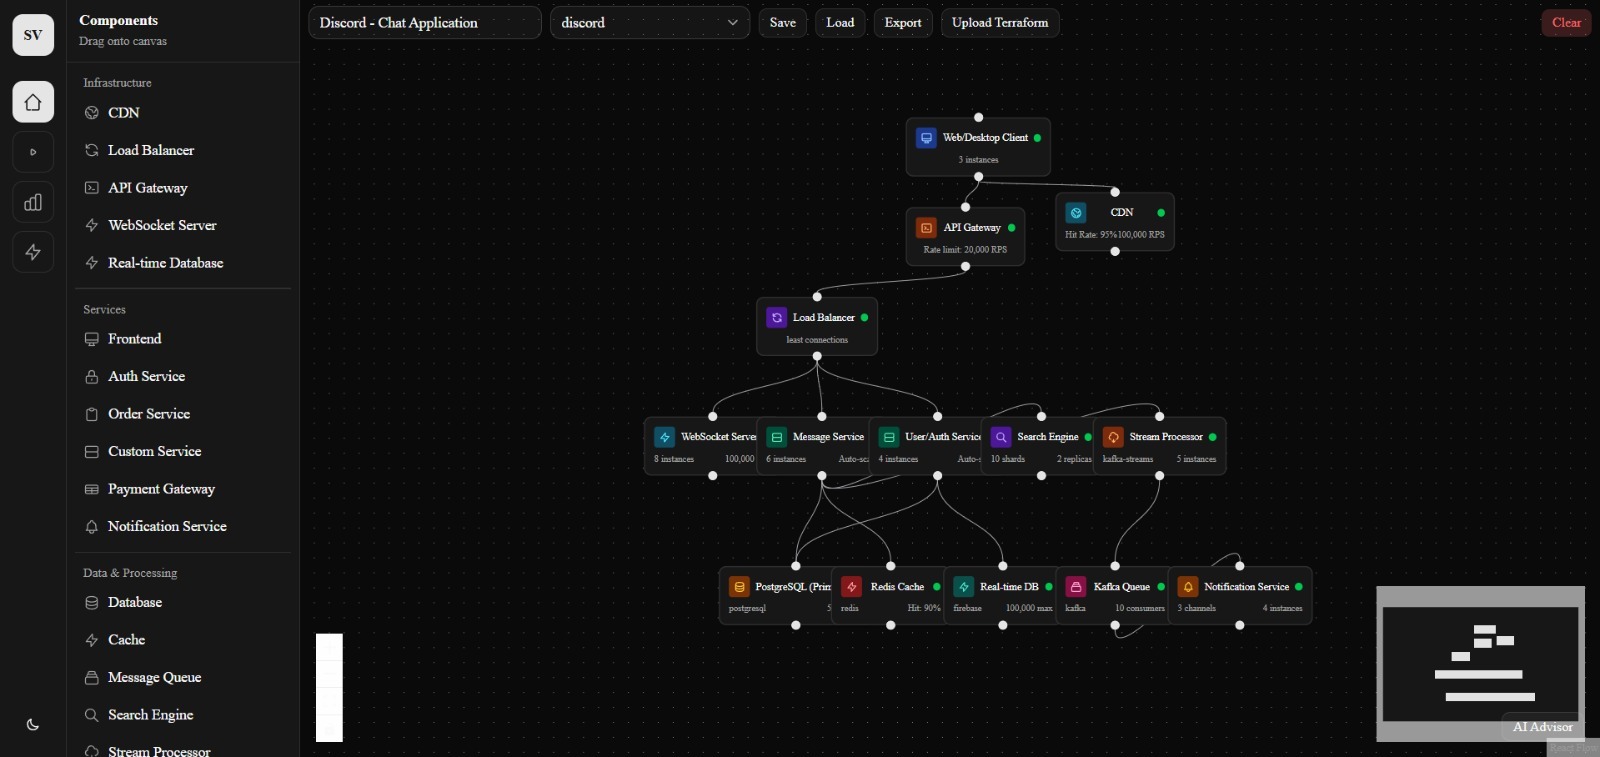
Architecture Modeling
- Create systems using components like servers, databases, queues, and APIs
- Define how different parts of the system interact
Traffic Simulation
- Simulate real-world load (e.g., 100 → 1M users)
- Observe how requests flow through the system
Failure Injection
- Test scenarios like:
- server crashes
- database downtime
- network latency
- Understand how failures impact the system
Bottleneck Detection
- Identify weak points in architecture
- Detect overload conditions and inefficiencies
Real-Time Visualization
- Watch system behavior dynamically:
- node health
- latency
- load distribution
Instead of guessing how a system behaves, users can see it in action before it breaks.
What I Learned
Building this project fundamentally changed how I think about software systems.
1. Code ≠ System
A working application does not guarantee a scalable system.
Scalability depends on architecture, not just implementation.
2. Systems Behave Non-Linearly
When load increases, system behavior is not always predictable.
For example:
$$ y = kx^2 $$
A small increase in users can lead to disproportionate stress on resources like databases or queues.
3. Visualization Drives Understanding
Seeing a system visually:
- exposes bottlenecks faster
- improves decision-making
- bridges the gap between developers and architects
4. Failure is a First-Class Citizen
Instead of avoiding failure, systems should be designed with failure in mind:
- server crashes
- latency spikes
- cascading failures
How I Built It
I approached this project as a developer-first simulation platform.
Core Components:
1. Architecture Modeling Layer
- Users define systems as:
- nodes (servers, databases, queues)
- edges (data flow)
- Designed to be simple yet expressive
2. Simulation Engine
- Models:
- traffic load
- request distribution
- failure scenarios
- traffic load
- Allows dynamic scaling (e.g., 100 → 1M users)
3. Visualization Engine
- Real-time rendering of:
- system flow
- node health
- bottlenecks
- system flow
- Inspired by modern DevOps dashboards
4. UI/UX Layer
- Built with a focus on:
- clarity
- interactivity
- minimal friction
- clarity
The goal was to make system design feel intuitive, not intimidating.
Challenges I Faced
1. Modeling Real-World Systems
Real systems are complex:
- distributed services
- unpredictable traffic
- multiple failure points
Simplifying this into a usable model without losing realism was difficult.
2. Balancing Accuracy vs Performance
Simulating large-scale systems requires trade-offs:
- Highly accurate simulations can be slow
- Faster simulations may lose detail
Finding the right balance was a key challenge.
3. Designing for Both Developers & Non-Developers
I wanted the tool to be:
- powerful for engineers
- accessible for beginners
This required careful abstraction and UI design.
4. Lack of Existing Tools in This Space
Most tools today focus on:
- diagrams (static)
- monitoring (post-deployment)
There are very few tools for pre-deployment system simulation, which meant building many concepts from scratch.
Vision
System Visualizer is more than a tool.
It represents a shift from guessing system behavior → to simulating it before deployment.
In the future, I envision:
- AI-assisted architecture recommendations
- integration with CI/CD pipelines
- “architecture testing” becoming as standard as unit testing
Closing Thought
We are entering an era where building software is easy.
But building systems that scale, survive, and adapt —
that’s the real challenge.
System Visualizer exists to solve that.
