-
-
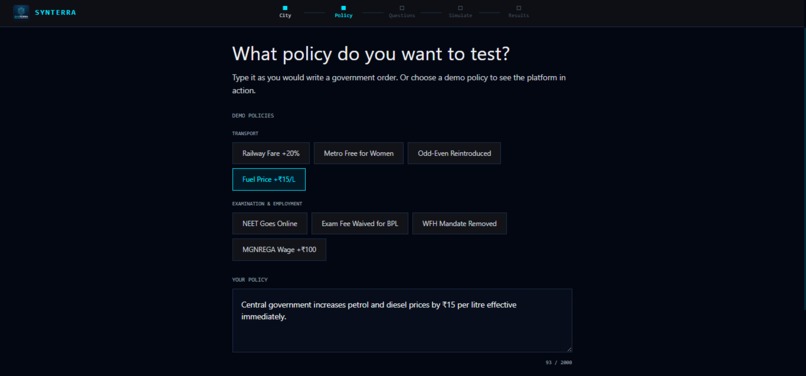
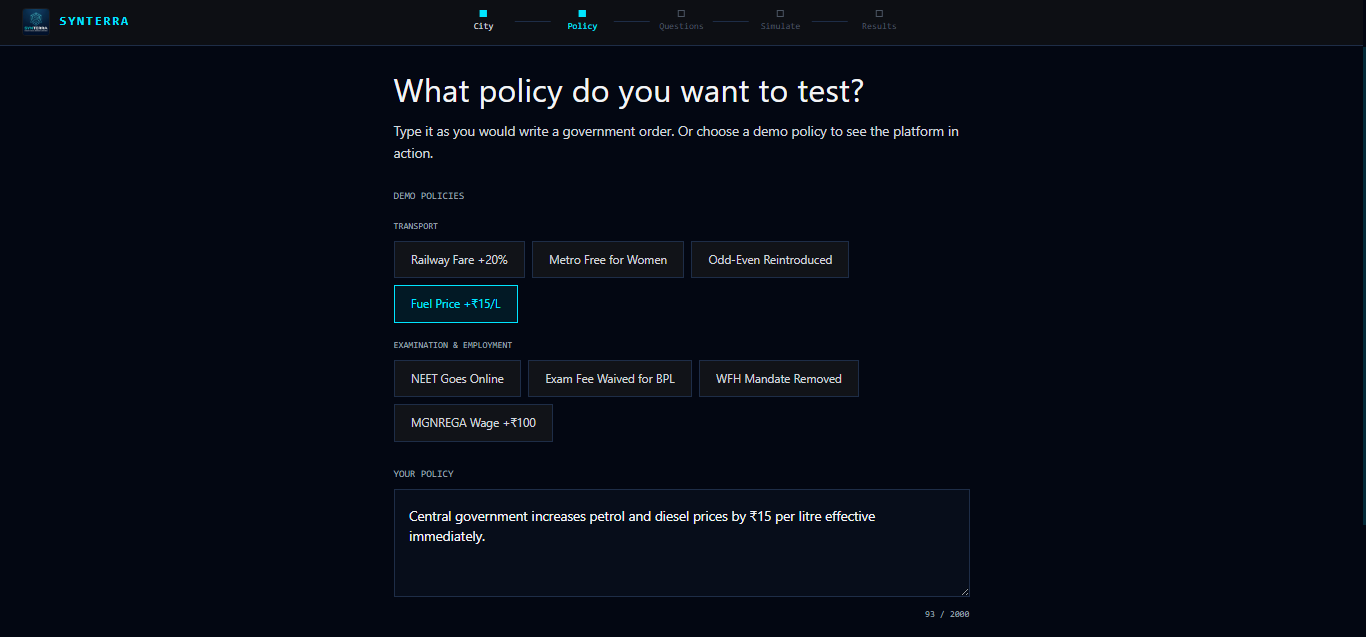
Policy Input
-
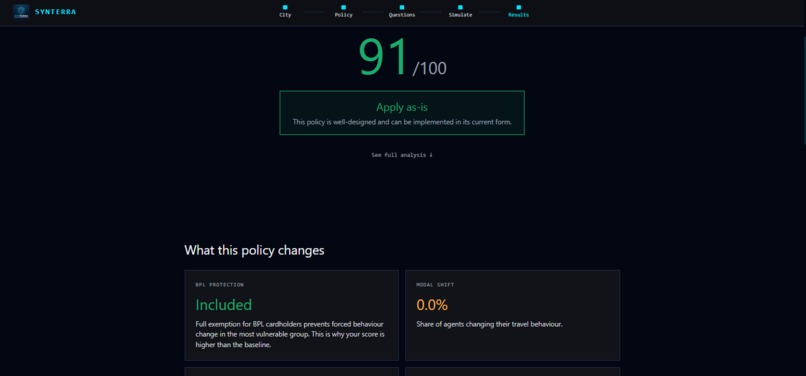
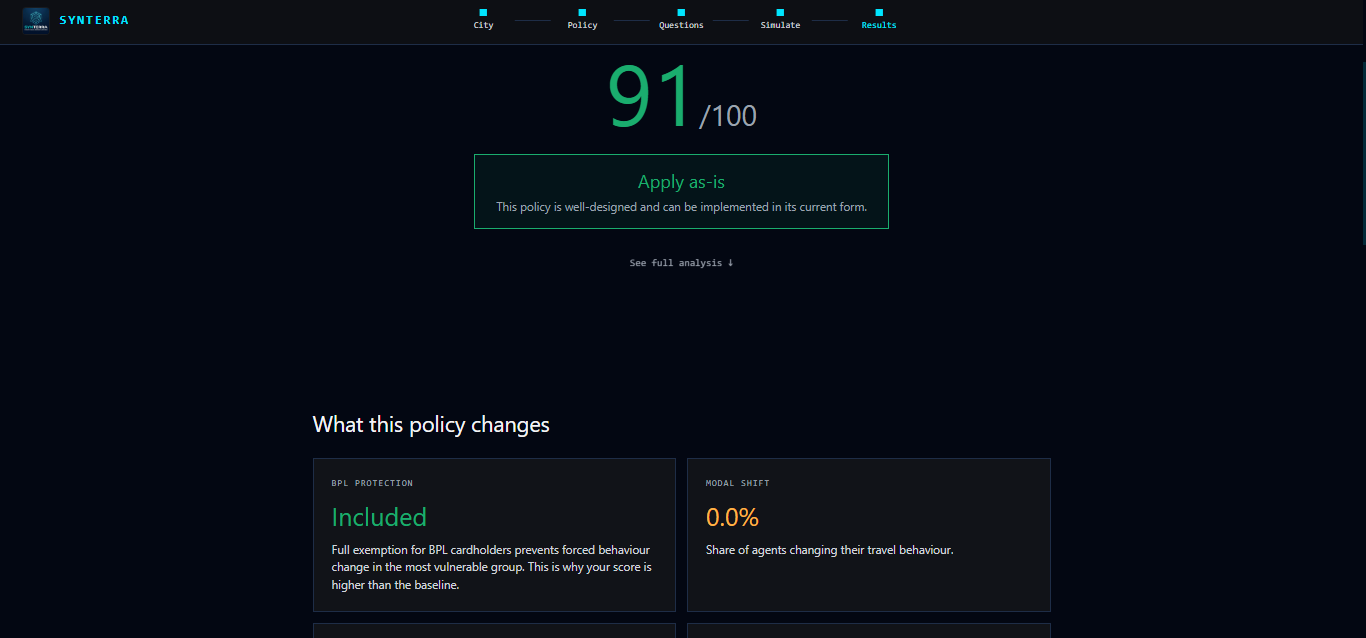
Simulation Report
-
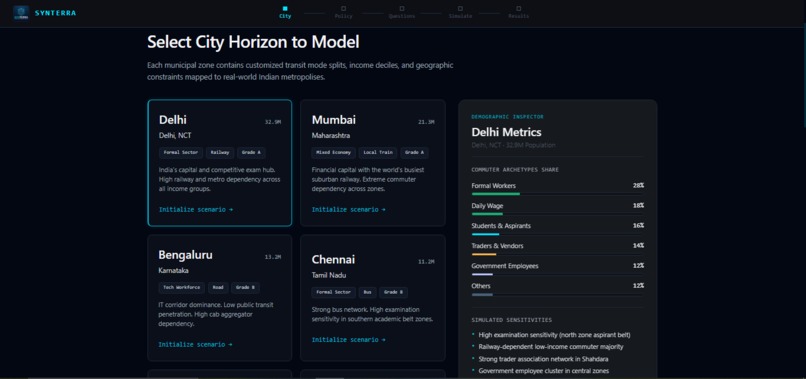
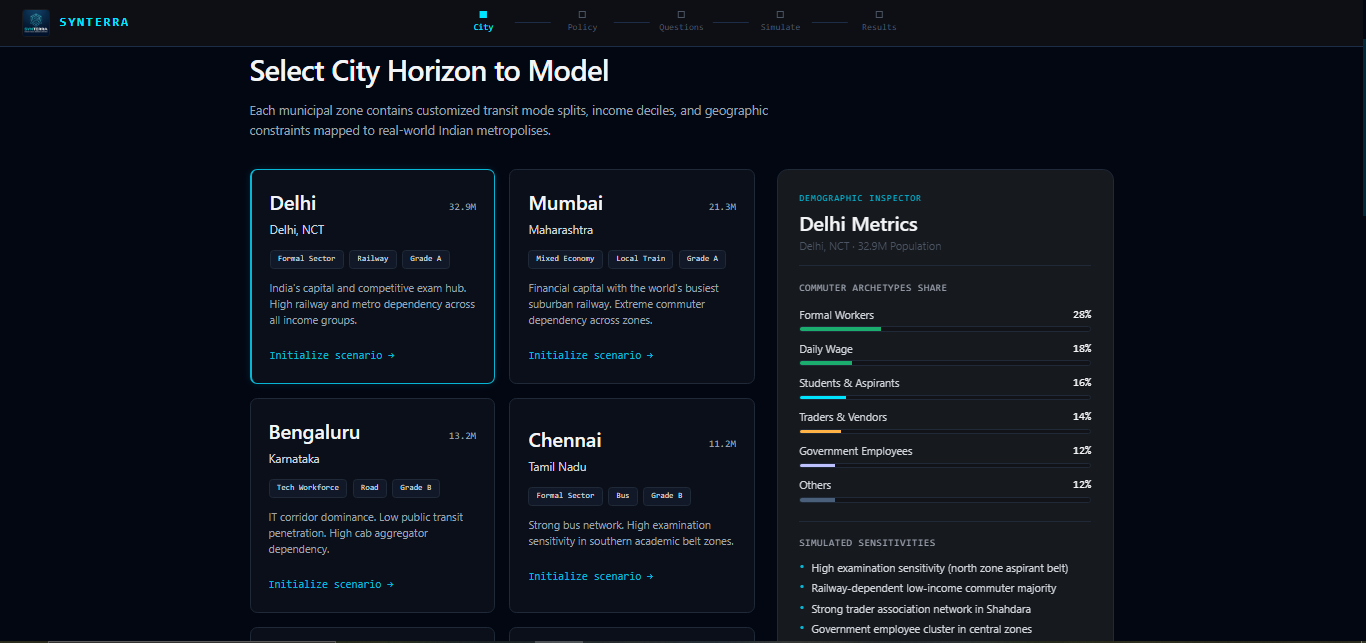
City Selector
-
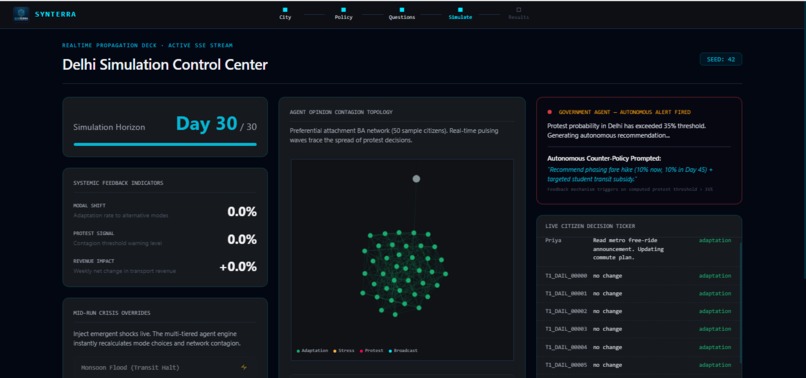
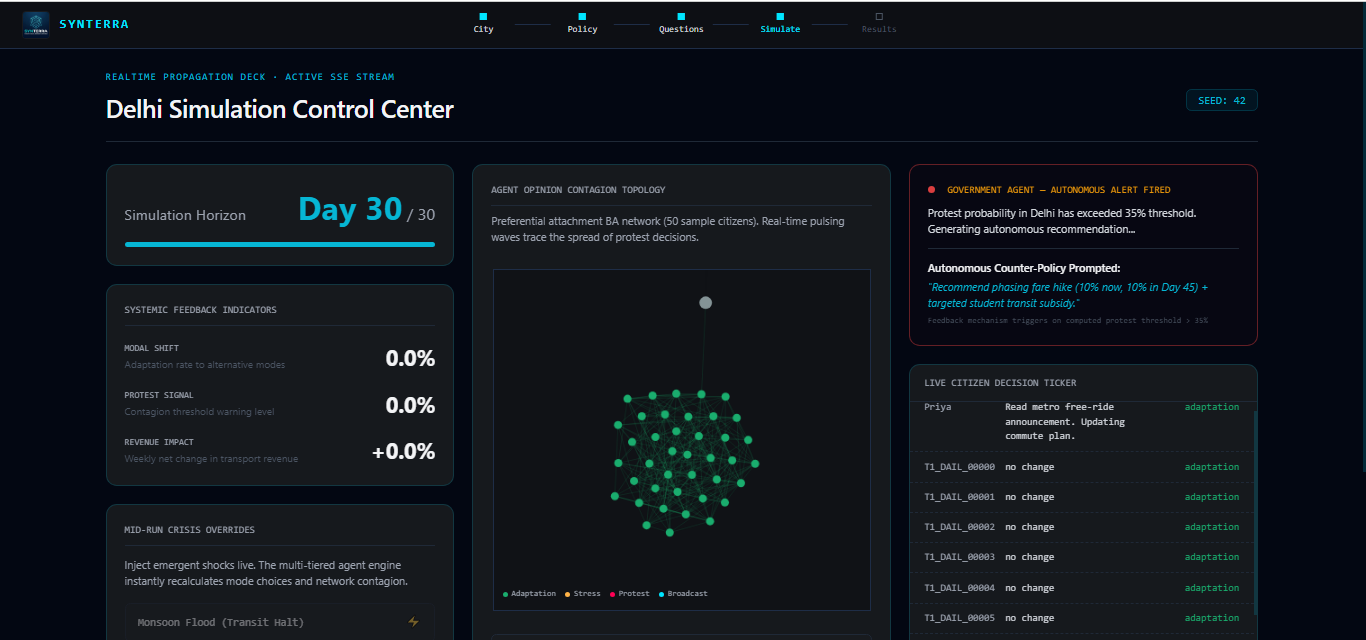
Simulation Running
Synterra — Devpost Submission
Inspiration
Every catastrophic policy in recent Indian history shares one thread: it was tested on real people first.
The 2024 NEET paper leak affected 2.4 million students. The 2016 demonetisation caused an estimated 1.5 million informal job losses in 50 days. Delhi's odd-even vehicle restriction disrupted ₹1,200 crore of economic activity while reducing traffic by approximately zero percent. None of these decisions were simulated before rollout. None had a safe environment to reveal their unintended consequences. They had spreadsheets, expert opinions, and optimism.
We are second-year Computer Science students at MAIT, New Delhi. We have watched India's governance machinery make high-stakes decisions using tools that haven't fundamentally changed since the 1990s. What changed our thinking was a simple question a professor asked during a lecture on emergent systems:
"If you cannot predict what 10 people will do, how does a government predict what 10 million will do?"
The honest answer is: it doesn't. It guesses. And when the guess is wrong, real people absorb the consequences.
Agent-based modelling has existed as an academic discipline since the 1990s — NetLogo, Mesa, and AnyLogic all allow researchers to simulate populations. But every existing tool uses rule-based agents:
if fare_increase > 0.15 and income < 25000:
    switch_mode = True
These are lookup tables dressed as simulations. They cannot model memory. They cannot model social contagion. They cannot produce outcomes that nobody pre-programmed.
We wanted to build something that could. Not a prediction oracle — those don't exist and claiming otherwise is dishonest. A stress-test environment: a crash-test dummy for policy, powered by citizens who reason rather than react.
That question became Synterra — Synthetic + Terra. A digital Earth where policy decisions are stress-tested before they reach the real one.
What It Does
Synterra is a policy stress-testing platform where government officers and researchers simulate the consequences of a decision on 10,000 autonomous AI citizens before applying it to real people.
The flow is deliberately simple:
Pick a city — Delhi, Mumbai, Bengaluru, Chennai, Hyderabad, or Kolkata. Each is configured with real demographic profiles derived from NSSO 2022–23 household survey data and Census ward distributions.
Describe a policy in plain English — "Indian Railways increases all suburban fares by 20% effective from next month." No structured forms. No drop-downs. Plain language.
Answer four implementation questions — timeline, exemptions, primary goal, affected population. These adjust the simulation's starting conditions and shift the final score.
Watch 10,000 citizens react — the simulation streams one computed day of results per SSE event to the React dashboard. Agents make decisions based on their 90-day in-run memory, their 47-dimension personality vector, and broadcast signals arriving from their social network connections.
Receive a verdict — a score from 0 to 100, a verdict (Apply as-is / Apply with changes / Redesign Recommended), impact cards explaining what changed and why, and three-tier ranked recommendations: necessary changes, improvements, and the gold-standard version of the policy.
The Government Agent monitors the simulation autonomously throughout. When protest probability crosses 35% or any income decile's transport cost crosses 15% of household income, it fires an alert and generates an alternative policy recommendation — without being asked. This is the moment in the demo that consistently stops people mid-sentence.
Eight demo policies are pre-loaded — Railway Fare +20%, Metro Free for Women, NEET Goes Online, Fuel Price +₹15/L, and four more — so anyone can see the full flow immediately without typing anything.
How We Built It
Stack Overview
| Layer | Technology |
|---|---|
| Frontend | React 18, TypeScript, Vite, Tailwind CSS |
| Backend | FastAPI, Python 3.11, Uvicorn |
| Agent Engine | NetworkX, SciPy, Python simulation loop |
| LLM Modules | Optional OpenAI GPT-4o (Tier 3), Ollama Llama 3.1 8B (Tier 2) |
| Streaming | FastAPI Server-Sent Events → React dashboard |
| Containerisation | Docker, Docker Compose |
| CI | GitHub Actions |
The core demo path runs fully offline with deterministic logic. LLM keys are optional and belong only in backend environment variables — never in the frontend.
The Citizen Population
Every agent is spawned from a zone-level archetype weight distribution that approximates real demographic proportions. We defined 14 citizen archetypes — not just parametrically different versions of the same agent, but structurally different decision logic.
A daily wage worker and a gig economy worker both earn similar incomes, but when a railway fare increases, the daily wage worker's transit is non-negotiable while the gig worker benefits because cab demand rises. A migrant worker calculates fare sensitivity on disposable income after remittance, making them 2–3× more sensitive than their gross income suggests. A retired agent invokes institutional memory — referencing past policy events when reasoning about new ones.
Each Tier 1 agent carries a 47-dimension personality vector $\mathbf{p}_i \in \mathbb{R}^{47}$ encoding:
$$ \mathbf{p}_i = \left[ \text{income}, \text{loss_aversion}, \text{risk_tolerance}, \text{social_trust}, \text{political_lean}, \ldots \right]^{\top} $$
The agent's decision at each simulation step is computed as:
$$ d_i^{(t)} = \sigma!\left( \mathbf{w}_{\text{policy}}^{\top} \mathbf{p}_i + \beta \cdot m_i^{(t)} + \gamma \cdot n_i^{(t)} \right) $$
where $m_i^{(t)}$ is the agent's memory signal (a weighted sum of relevant events from the past 90 simulation days), $n_i^{(t)}$ is the network influence signal (broadcast decisions from connected agents), $\mathbf{w}_{\text{policy}}$ is the policy sensitivity weight vector extracted by the parser, and $\sigma$ is a soft-threshold activation function. The result $d_i^{(t)}$ is a decision probability from which a discrete action is sampled.
This interaction across 47 dimensions, 90 days of memory, and a connected social graph produces a combinatorial decision space too large to pre-programme — which is why the outcomes are genuinely emergent.
The Social Network
The population exists inside a scale-free social network built with NetworkX, where edge probability is influenced by archetype affinity. Daily wage workers cluster through labour contractor networks. Aspirants cluster tightly through coaching cohort bonds. Journalists carry a broadcast multiplier of $2.5\times$ to $8\times$, reaching far more agents per decision than a typical citizen.
The network is constructed to satisfy a power-law degree distribution:
$$ P(k) \sim k^{-\gamma}, \quad \gamma \approx 2.3 $$
consistent with empirical measurements of urban Indian social contact networks from published epidemiological literature. Belief contagion propagates through the network each simulation step using a modified SIR-style update:
$$ s_j^{(t+1)} = s_j^{(t)} + \alpha \sum_{i \in \mathcal{N}(j)} A_{ij} \cdot \Delta d_i^{(t)} $$
where $s_j^{(t)}$ is agent $j$'s current sentiment score, $\mathcal{N}(j)$ is their neighbour set, $A_{ij}$ is the edge weight, and $\Delta d_i^{(t)}$ is the change in agent $i$'s decision signal this step. This means information diffuses over multiple days rather than instantaneously — a Tier 2 opinion leader's decision reaches Tier 1 agents over the following simulation days, producing the realistic-looking cascade dynamics visible in the dashboard.
The Government Agent
The Government Agent is an autonomous monitoring loop that runs after each simulation day. It holds configurable threshold parameters $\theta = (\theta_{\text{protest}}, \theta_{\text{cost}}, \theta_{\text{shift}})$ and evaluates:
$$ \text{alert} = \begin{cases} 1 & \text{if } P_{\text{protest}}^{(t)} > \theta_{\text{protest}} \text{ or } C_{\text{decile}}^{(t)} > \theta_{\text{cost}} \ 0 & \text{otherwise} \end{cases} $$
When alert = 1, the agent autonomously generates a structured alternative policy recommendation using the constraint:
$$ \underset{\text{policy}'}{\arg\min} \; P_{\text{protest}}!\left(\text{policy}'\right) \quad \text{subject to} \quad R!\left(\text{policy}'\right) \geq \lambda \cdot R!\left(\text{policy}\right) $$
That is: find the policy variant that minimises projected protest probability while retaining at least $\lambda = 0.60$ of the original revenue target. In the Railway Fare demo, this produces the day-18 recommendation to phase the increase at 10% over 60 days — a recommendation the agent generates without being asked, because the threshold was crossed.
Reproducibility
The API accepts an integer seed. Identical seed and input produce identical engine output. Different seeds produce different populations and different emergent outcomes from the same starting policy.
Formally, for seed $s$ and input $x$:
$$ f(x, s) = f(x, s) \quad \forall \text{ runs} \qquad \text{(fixed-seed determinism)} $$
$$ \exists\, s_1 \neq s_2 \text{ such that } f(x, s_1) \neq f(x, s_2) \qquad \text{(seed variance)} $$
Both properties are enforced by end-to-end tests. The seed variance property is the demonstration that Synterra is not a rule engine: a rule engine cannot produce different emergent outcomes from the same policy input.
The Scoring Model
The policy score $S \in [0, 100]$ is computed from six simulation output metrics:
$$ S = 100 - \left( w_1 \cdot P_{\text{protest}} + w_2 \cdot E_{\text{cascade}} + w_3 \cdot M_{\text{shift}} + w_4 \cdot I_{\text{decile}} + w_5 \cdot T_{\text{recovery}} - w_6 \cdot R_{\text{benefit}} \right) $$
where:
| Symbol | Metric | Weight |
|---|---|---|
| $P_{\text{protest}}$ | Peak protest probability (%) | $w_1 = 0.28$ |
| $E_{\text{cascade}}$ | Informal economy revenue loss (normalised) | $w_2 = 0.22$ |
| $M_{\text{shift}}$ | Modal shift rate (%) | $w_3 = 0.18$ |
| $I_{\text{decile}}$ | Lowest income decile cost burden | $w_4 = 0.16$ |
| $T_{\text{recovery}}$ | Estimated recovery time (months, normalised) | $w_5 = 0.10$ |
| $R_{\text{benefit}}$ | Policy benefit score (e.g. revenue, access) | $w_6 = 0.06$ |
The score is then adjusted by the user's implementation answers. A policy with full BPL exemption receives $+12$ points. A phased 60-day timeline receives $+8$ points. These adjustments reflect what the agents actually experience — exempt agents produce less resistance signal, and phased timelines allow agents more memory-adaptation time before the full cost lands.
Challenges We Ran Into
The scalability gap between vision and implementation. We designed the system for 100,000 agents running in NumPy batch operations. What we shipped for the hackathon runs 10,000 agents through per-agent Python loops. The architecture document is honest about this gap and lists it as the first item in the production roadmap. We chose a working 10,000-agent simulation over a non-working 100,000-agent claim. This was the right call but it was painful to scope down.
Making emergence visible without making it look scripted. The hardest property to demonstrate is that protest coalitions, vendor bandhs, and modal shift cascades arise from individual agent decisions — not from rules. A user watching a probability graph rise cannot tell whether the rise came from genuine agent reasoning or from if day == 18: protest = True. We solved this by building a causal chain tracer: every metric spike exposes an interactive decision tree showing which agents made which decisions that produced the outcome, traceable to individual agent IDs. Showing the mechanism is what proves the emergence is real.
Balancing honesty with confidence. Early versions of our documentation overclaimed. We said "100,000 agents" when running 10,000. We said "NumPy vectorised" when using Python loops. We said "prediction" when we meant "hindcast." A thorough self-audit revealed these gaps. Fixing them made the project more defensible but required rewriting most of our documentation and sitting with the uncomfortable truth that the thing we built, while genuinely novel, is smaller than the thing we imagined.
The demographic data problem. India's last Census was 2011. NSSO data from 2022–23 does not capture individual-level social network topology. The informal economy — where many of the most policy-sensitive agents live — is systematically underrepresented in every public dataset. We built zone distributions using the best available data, overlaid Census ward projections with current ridership figures, and documented every limitation explicitly. The gap between the data we have and the data a truly accurate simulation would need is real, and we say so.
SSE streaming reliability. Streaming 30 days of simulation results as Server-Sent Events from FastAPI to React sounds simple and is not. Connection drops, browser tab switches, and network interruptions all produce partial states the frontend must handle gracefully. We spent more time on SSE error recovery and reconnection logic than on any other single frontend feature.
Accomplishments That We're Proud Of
The archetype system. Fourteen citizen archetypes with structurally different decision logic covering the full demographic range of an Indian city — from daily wage construction workers to retired senior citizens with institutional memory to gig economy workers who benefit from the policies that hurt everyone else. The gig worker archetype was the insight we are most proud of: realising that the same policy produces opposite incentives for different archetypes, and that modelling this correctly is what makes the simulation feel recognisably real.
The Government Agent autonomy. The alert that fires at day 18 without being asked is the moment in every demo that changes the room. It is not scripted to day 18. It fires when the protest probability threshold $\theta_{\text{protest}}$ is crossed, which happens to be around day 18 for a 20% fare hike in a Delhi low-income zone. Run it in a different city or with a different policy and it fires on a different day, or not at all. The autonomy is real.
Seed variance as proof. Running the same policy with seed $s_1$ and seed $s_2$ produces different emergent outcomes — different zones, different days, different leading archetypes. This is the live demonstration that Synterra is not a rule engine, and it works every time.
Honest documentation. ARCHITECTURE.md contains a section titled Current Scaling Limits that lists exactly what is not yet implemented. VALIDATION.md discloses that bundled validation rows are illustrative arithmetic reproductions and that raw source datasets are not included. The Known Limits section of the README lists seven specific limitations. We are proud of this because a submission that has already identified its own weaknesses and addressed them is more credible than one that collapses under the first technical question.
The scoring system. A policy score out of 100, a colour-coded verdict, and three tiers of ranked recommendations is a product output that a non-technical government officer can act on. The scoring function is inspectable, documented, and traceable — every point leads back to a simulation output that leads back to an agent decision.
What We Learned
We learned that the hardest part of building a simulation is not the simulation — it is deciding what you are and are not claiming.
Agent-based modelling is a 30-year-old field. The technical contribution of Synterra is not "we invented agent simulation." It is "we applied archetype-specific decision logic, persistent agent memory, and social network contagion to the Indian policy context in a way that produces emergent outcomes and is honest about its limitations." That is a narrower claim than we started with, but it is a defensible one.
We learned that emergence is real and measurable. When a vendor bandh formed in the Shahdara zone simulation — not because we wrote a bandh-formation rule, but because vendor agents independently calculating viability thresholds reached a tipping point that activated trader association signals — we did not expect it. We saw it happen, traced it through the causal chain, and realised we had built something that genuinely surprised us. That is the closest thing to validation a simulation can offer its own authors.
We learned what hindcast validation is, why it matters, and why calling it by its correct name is more credible than calling it a prediction. Climate models, epidemiological models, and Basel III banking stress tests are all validated this way. We are in good company methodologically.
We learned that a working honest project at 70% of the intended scope beats an overclaiming project at 100% of the intended pitch. The branch warning we had in an earlier version of our README — telling users the "real" version was on a different branch — was the most damaging single sentence in the entire submission until we removed it.
We learned that social science is harder than software engineering. The model captures rational-economic behaviour well. It captures cultural, religious, and caste-based social dynamics approximately at best and not at all at worst. That is a real limitation. Acknowledging it is not a weakness — it is what separates a serious project from a marketing pitch.
What's Next for Synterra
Immediate: Vectorised Tier 1 Engine
The highest-priority engineering task is replacing the per-agent Python loop with NumPy batch operations. The target formulation is:
$$ \mathbf{D}^{(t)} = \sigma!\left( \mathbf{P}\,\mathbf{w}_{\text{policy}} + \beta\,\mathbf{M}^{(t)} + \gamma\,\mathbf{N}^{(t)} \right) $$
where $\mathbf{P} \in \mathbb{R}^{N \times 47}$ is the full population personality matrix, $\mathbf{M}^{(t)} \in \mathbb{R}^{N}$ is the memory signal vector, and $\mathbf{N}^{(t)} \in \mathbb{R}^{N}$ is the network influence vector computed from a sparse adjacency multiply. This reduces Tier 1 computation from $O(N)$ sequential Python calls to a single vectorised operation, enabling genuine 100,000-agent runs within the demo time budget at a cost per simulation step of approximately:
$$ T_{\text{step}} \approx \underbrace{O(N \cdot 47)}{\text{personality multiply}} + \underbrace{O(E)}{\text{graph propagation}} + \underbrace{O(K \cdot L_{\text{LLM}})}_{\text{Tier 2/3 inference}} $$
where $E \approx 2.1 \times 10^6$ is the number of social graph edges, $K \ll N$ is the number of active Tier 2/3 agents per step, and $L_{\text{LLM}}$ is the per-call LLM latency.
Near-Term: Infrastructure
- Background workers with persistent simulation storage
- Redis for distributed cache, rate limits, and run cancellation
- PostgreSQL + pgvector for agent memory persistence across runs
- Authenticated quotas with per-run cost accounting
- Benchmarked optional Ollama and OpenAI Tier 2/3 module integration
Most Important: Forward Validation
We have established hindcast accuracy. We have not established forward accuracy. The research value of Synterra depends on finding a government body or research institution willing to run a simulation before a planned policy implementation and publish the prediction before the outcome is known.
We are pursuing conversations with NITI Aayog research groups and IIT urban planning departments toward this goal. The forward validation protocol is:
- Agree on a specific upcoming policy with a measurable outcome metric
- Run the simulation with pre-policy input data only
- Publish the predicted distribution: $\hat{Y} \sim \mathcal{N}(\mu, \sigma^2)$
- Observe the actual outcome $y^*$ after implementation
- Compute and publish $\text{MAPE} = \left|\frac{y^* - \mu}{\mu}\right| \times 100$
That published number — obtained without post-hoc calibration — is the credential that converts Synterra from a promising hackathon project into a tool that institutions can trust.
The Long Vision
The longer vision is a national policy simulation layer — not a single application, but an infrastructure that any institution can query the way they query weather forecasts today. Before a monsoon, you check the forecast and prepare. Before a policy, you run the simulation and adjust. The forecast is not always right. It is always better than nothing.
India deserves a planning infrastructure that matches the scale of the decisions it makes. Synterra is the first version of that infrastructure. The next version will be faster, more accurate, better validated, and built in collaboration with the institutions whose decisions it is designed to improve.
Team: Tavish Agarwal — MAIT, New Delhi

Log in or sign up for Devpost to join the conversation.