Inspiration
I kept noticing the same thing happening to me every semester: I'd learn something, feel solid on it, and then a few weeks later it was just gone. Every study app I've used tracks what you've covered, not what you're actually about to forget. There's a whole field of memory research, the Ebbinghaus forgetting curve, spaced repetition, that explains exactly why this happens, but nothing actually applies it to your real coursework in a way you can see. I wanted a map of my own brain that showed me where the cracks were before an exam did.
What it does
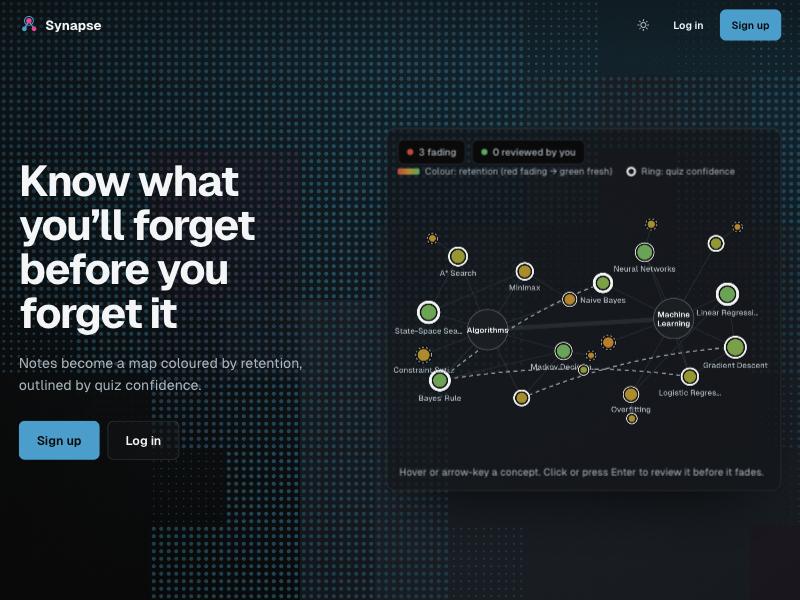
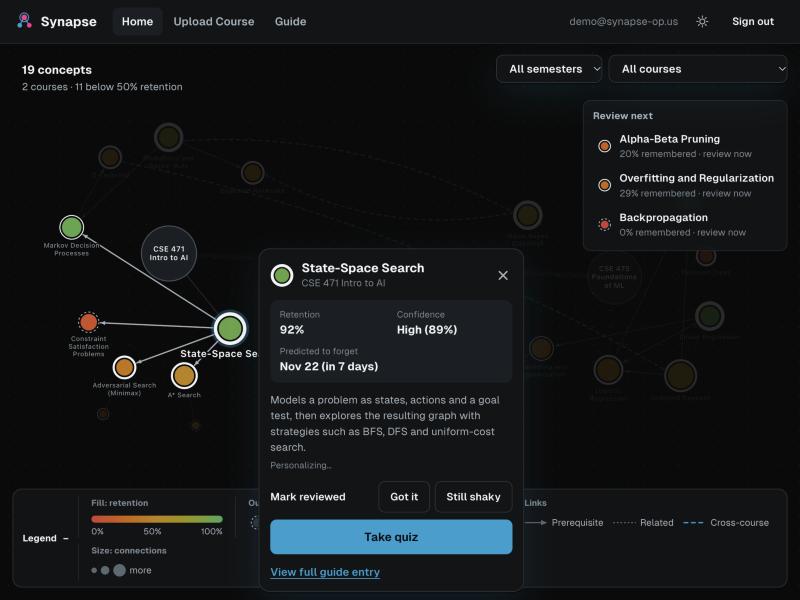
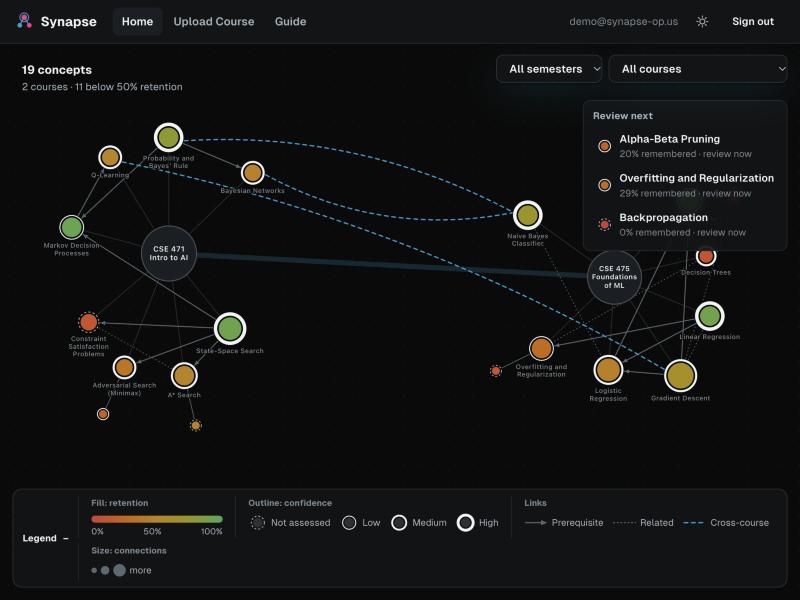
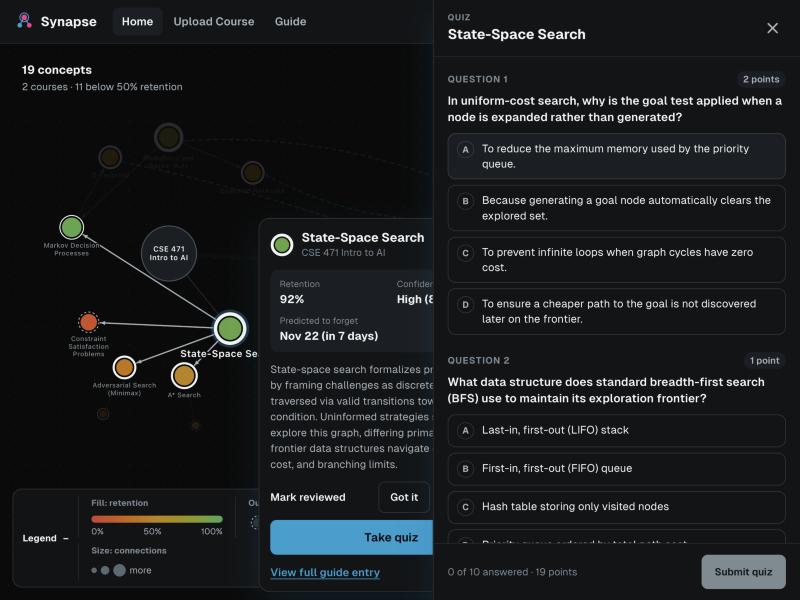
Synapse turns your course notes into a living concept graph. Upload your material and it builds a map where every node is a concept, colored by predicted retention using an actual decay model, not a vague progress bar. A separate border style tracks your confidence, so a concept can be "recently reviewed" and still flagged as shaky if you never really understood it.
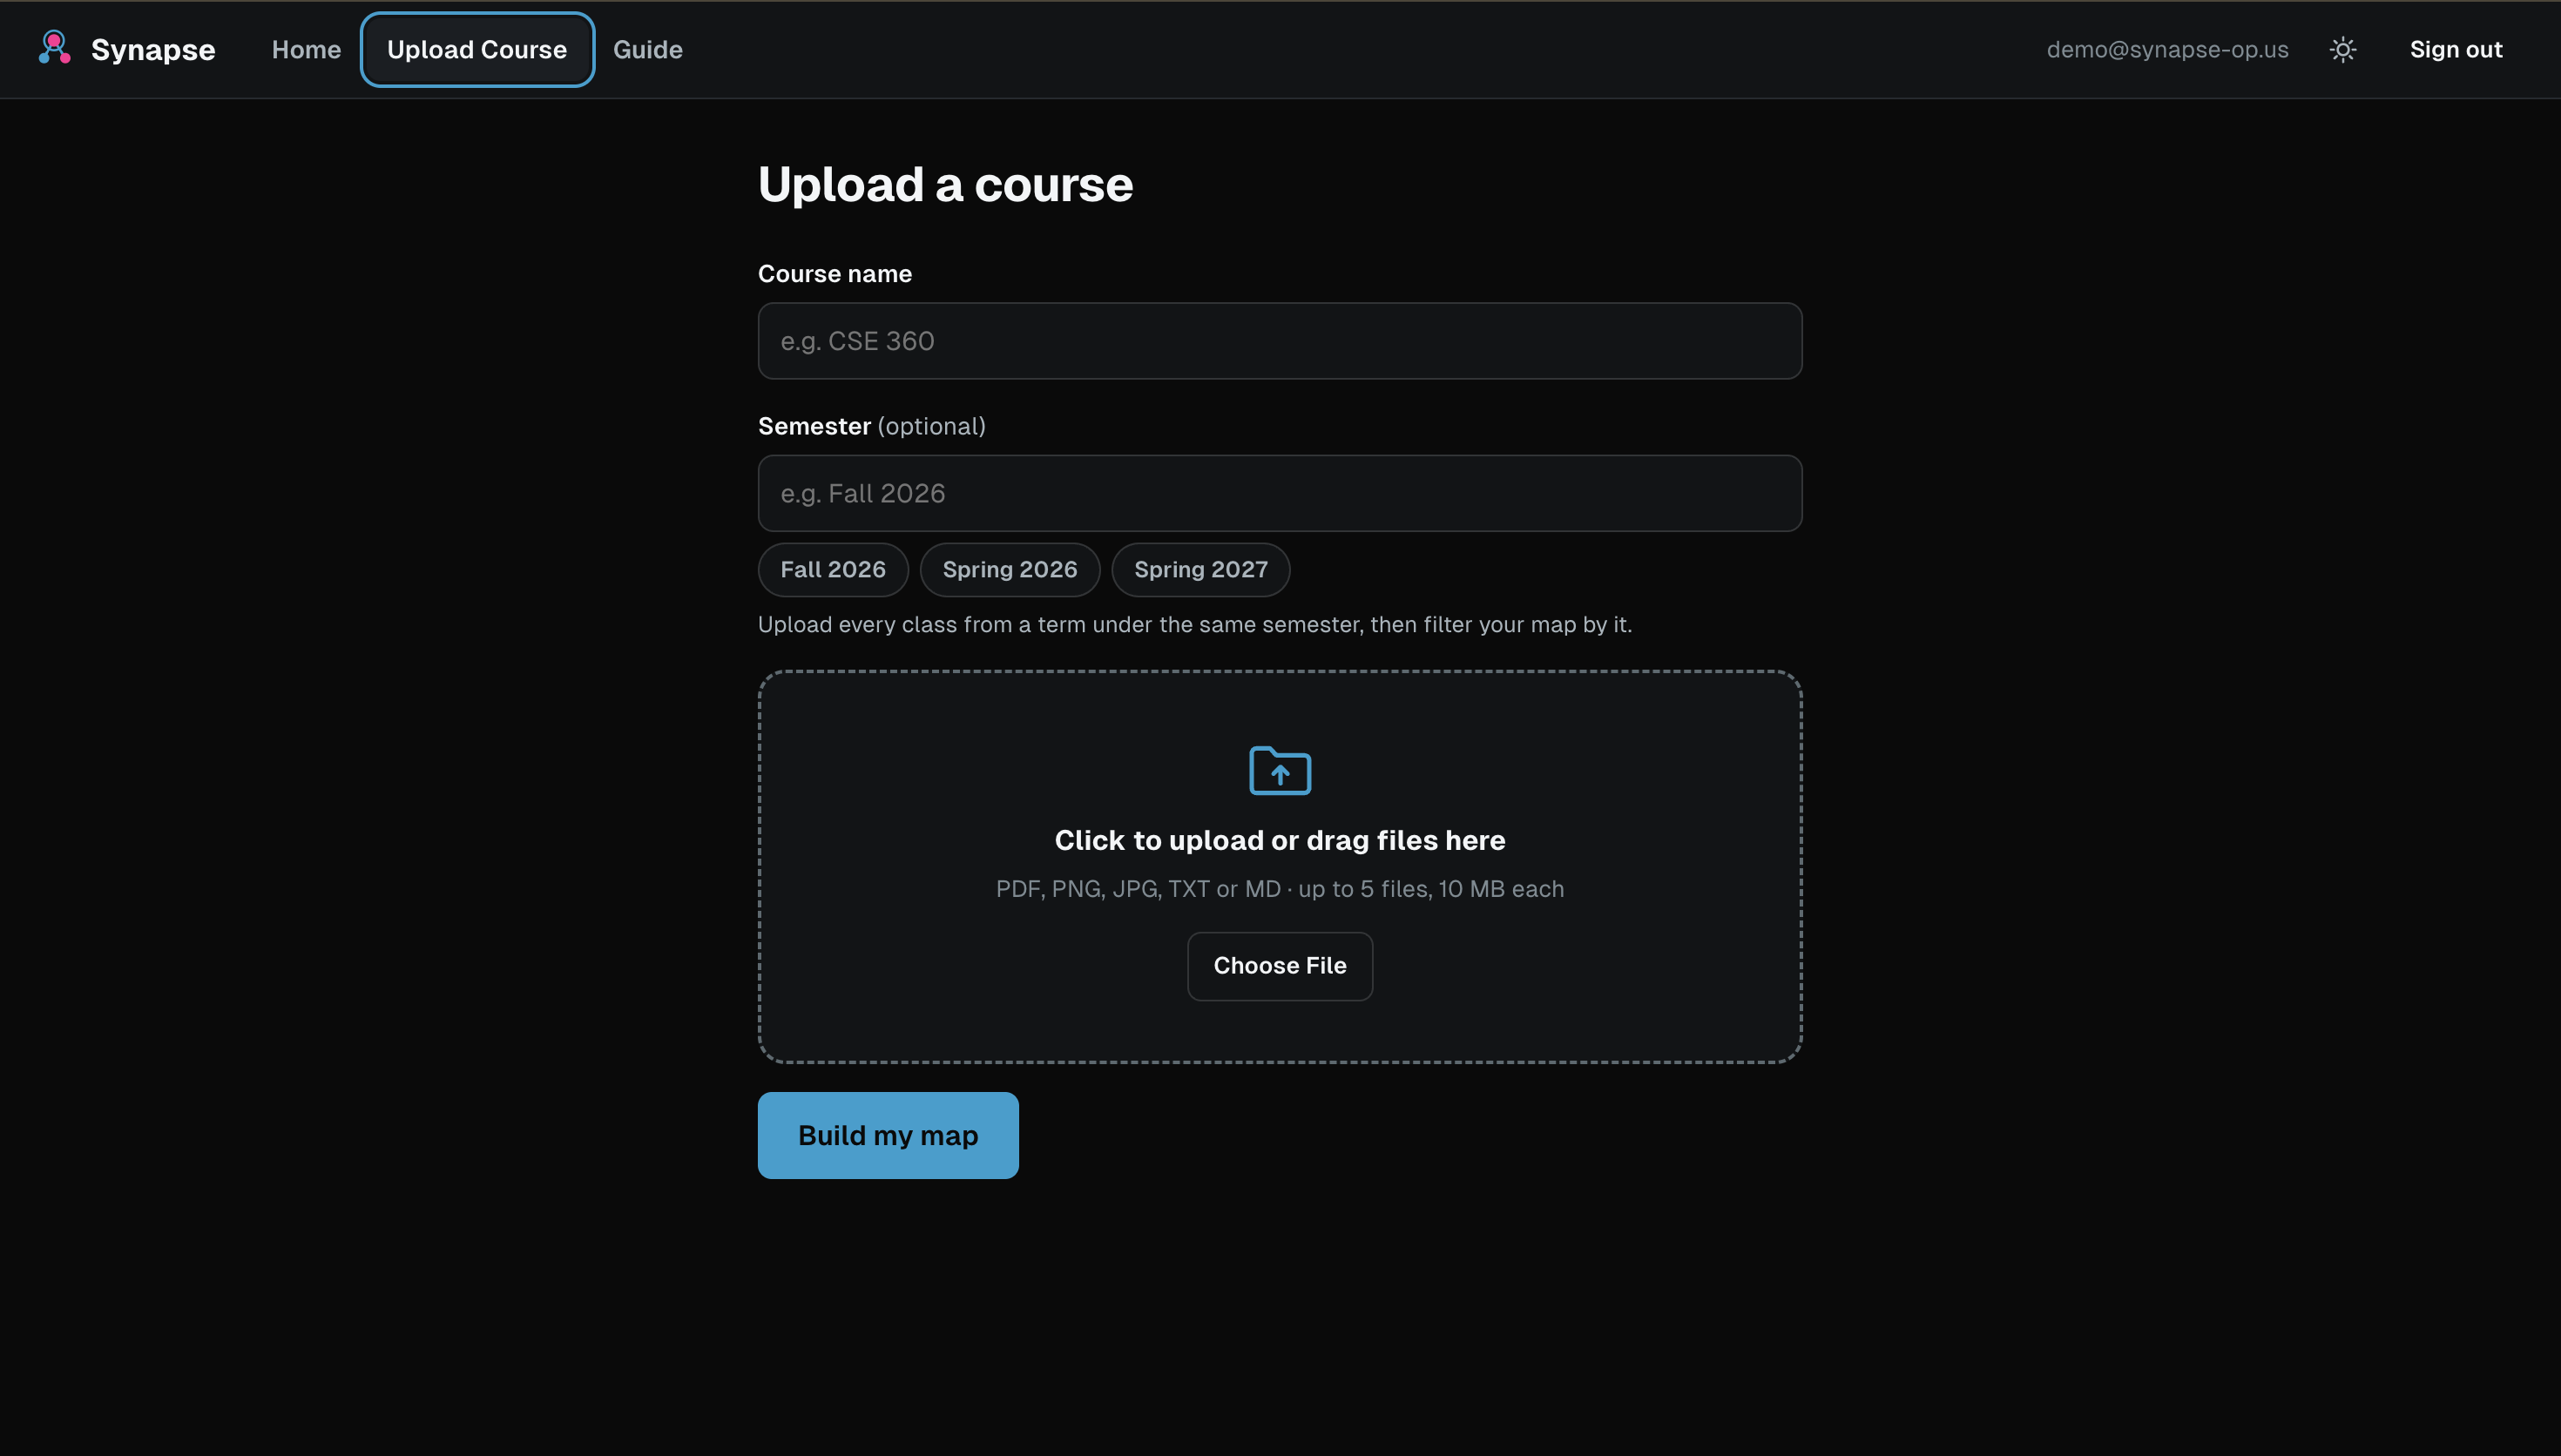
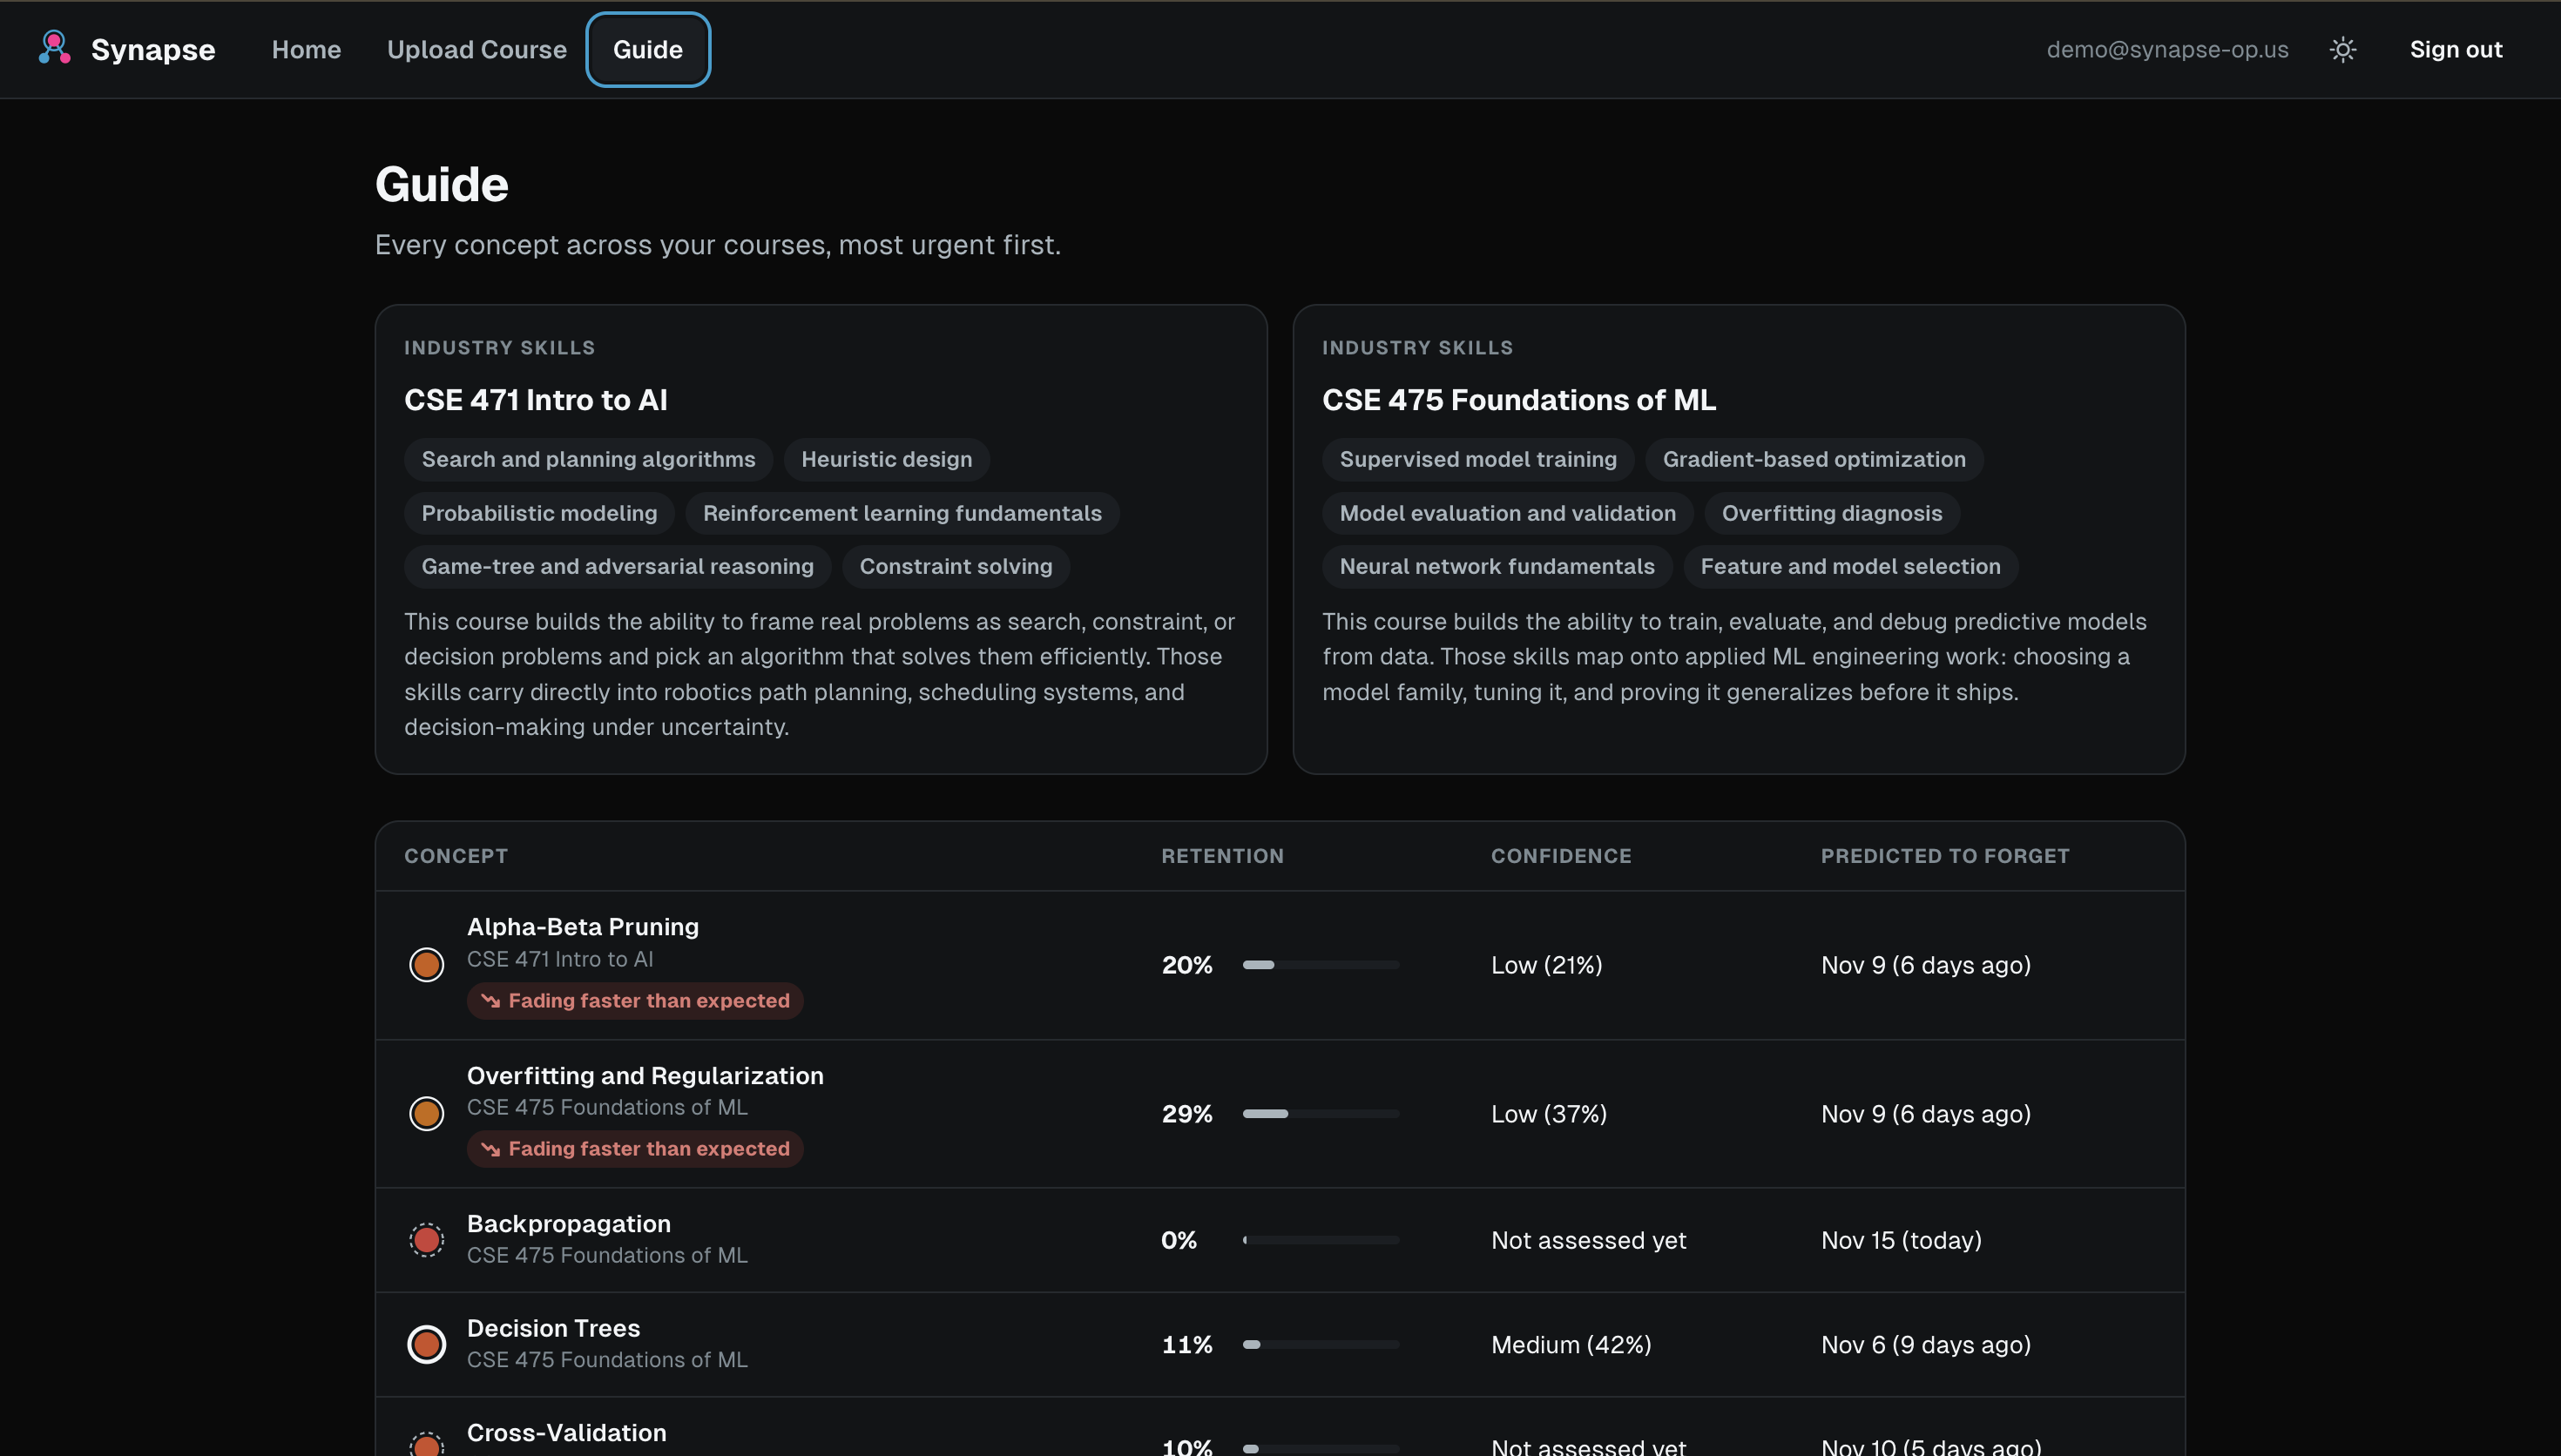
Click any node and get a personalized explanation from Gemini based on what you've actually struggled with. Take a quick quiz and your confidence score updates live on the graph. Upload a second course and Synapse finds the overlap between them, the shared concepts, plus the real industry skills you're building across both, directly feeding into how work-ready your coursework actually makes you. There's also a Guide page that ranks every concept worst-first so you always know what to review next.
In the background, it keeps recalculating decay on a schedule, so the map stays accurate even when you haven't opened the app in a while.
How I built it
The frontend is a React app with a force-directed, Obsidian-style graph: each course is a hub node, concepts branch off it, and cross-course links connect clusters when two classes share material.
The backend runs on AWS: Lambda and API Gateway behind a custom domain on CloudFront, Cognito for auth, S3 and Textract for note ingestion, and EventBridge for the scheduled decay scan. MongoDB Atlas stores the concept graph, course metadata, and cross-course links. Tiger Data (built on TimescaleDB) logs every review event as a time series, which is what the decay model actually runs against: a rolling z-score comparing a student's real performance to what the model predicted, letting Synapse tell the difference between normal forgetting and something fading unusually fast, all queried with standard SQL instead of a custom aggregation pipeline. Supermemory keeps a synthesized profile of a student's learning history across sessions so the Gemini explanations are grounded in what they've actually struggled with instead of being generic. Gemini API handles concept extraction from notes, the tutoring explanations, quiz generation and grading, and the cross-course/industry-skills tagging.
I wrote the full spec, data contracts, and architecture myself, then built the core application through Claude Code as my primary coding agent. I used Cursor and a Grok Bot integration to help polish the frontend and to help put together the product demo video.
Challenges I ran into
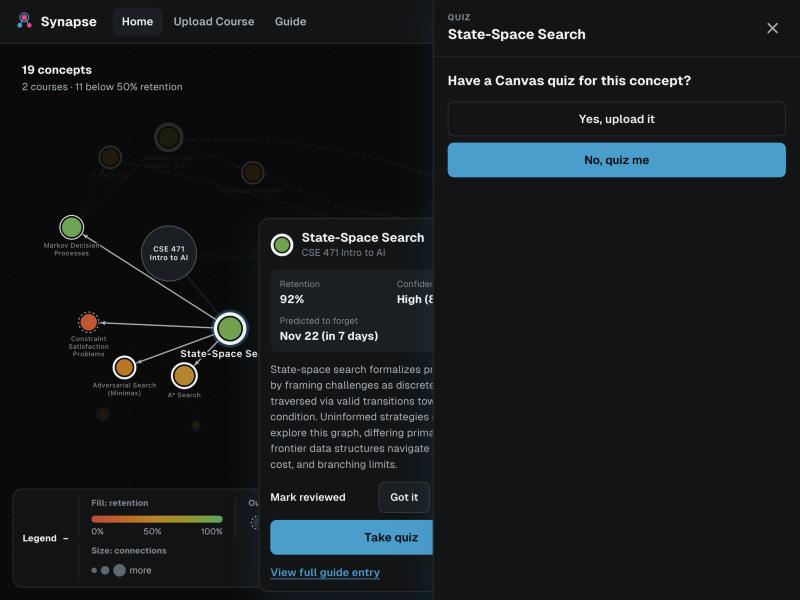
Scoping the quiz-upload feature was harder than it looked. My first instinct was to support uploading any quiz, including handwritten and scanned ones, but the ambiguity of grading marks, implicit point values, and multi-concept questions made that a real OCR problem, not a quick feature. I scoped it down to typed, digital quizzes (Canvas exports and similar) for this build and left handwritten support as a clear future update instead of quietly dropping it.
Getting the retention and confidence signals to feel independent, instead of just two versions of the same number, took some back and forth too. A concept you reviewed recently but never understood needed to show up differently than one you understood but haven't touched in weeks, and getting that distinction to read clearly on the graph itself (not just in a tooltip) took a few passes.
Accomplishments that I'm proud of
Getting a real decay model, not a fake progress bar, actually driving the visuals. The graph isn't decorative, every color and border on it means something and updates based on real data from Tiger Data's time-series layer. I'm also proud of how the cross-course linking turned out: seeing two unrelated-looking classes connect on the same map, with the shared concepts and skills called out, is genuinely useful for the kind of forward-looking, work-ready learning the future of work needs.
What's next for Synapse
Handwritten and photographed quiz uploads are the obvious next step, now that the digital path is proven out. I'd also like to expand the industry-skills tagging into something closer to a resume-ready skills summary, and add push notifications when a concept crosses a decay threshold instead of relying on the user to check the app.
Built With
- api-gateway
- aws-cognito
- aws-eventbridge
- aws-lambda
- aws-textract
- claude-code
- cloudfront
- edtech
- education
- forgetting-curve
- gemini
- gemini-api
- javascript
- mongodb
- mongodb-atlas
- node.js
- react
- s3
- serverless-framework
- spaced-repetition
- supermemory
- tiger-data
- timescaledb
- typescript

