-
-
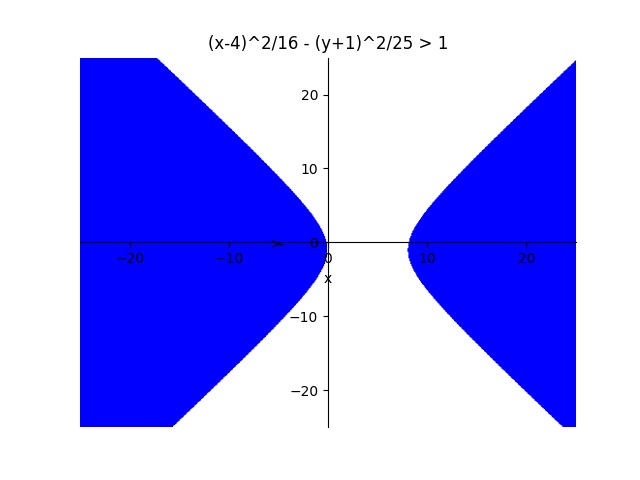
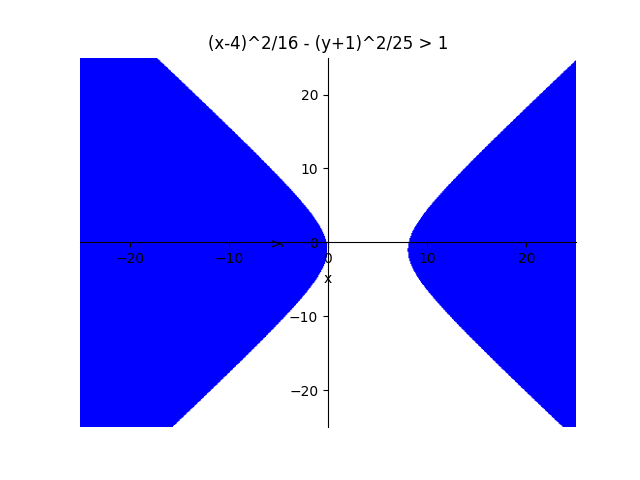
Hyperbola Conic Section Inequality
-
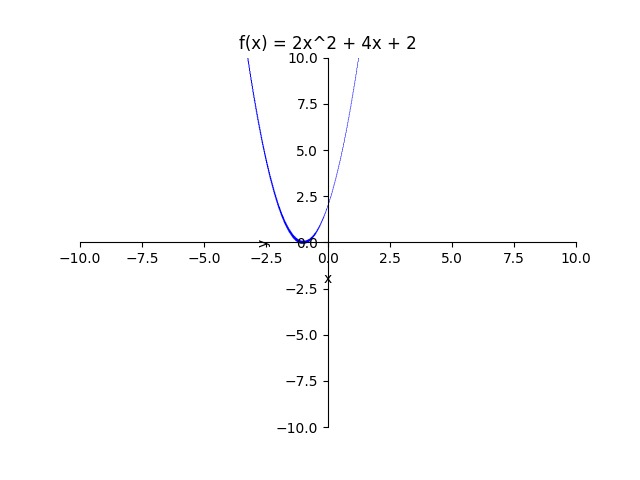
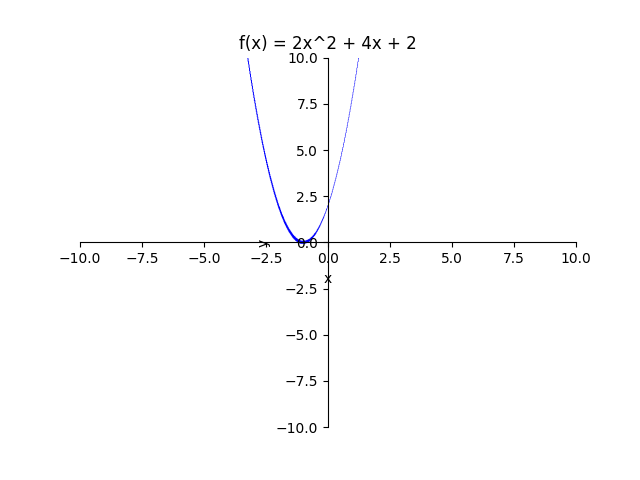
Quadratic Equation
-
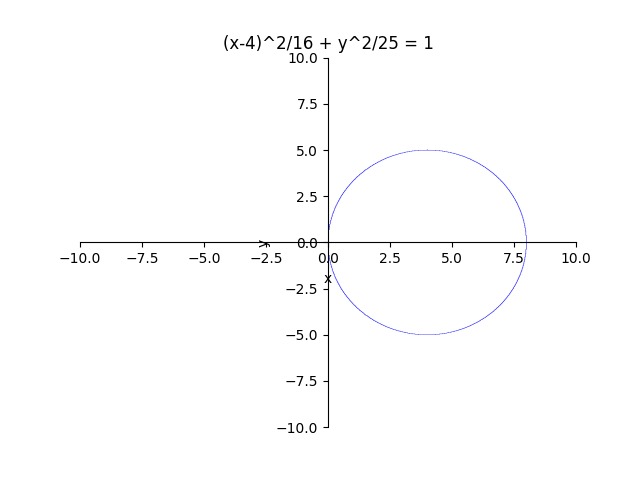
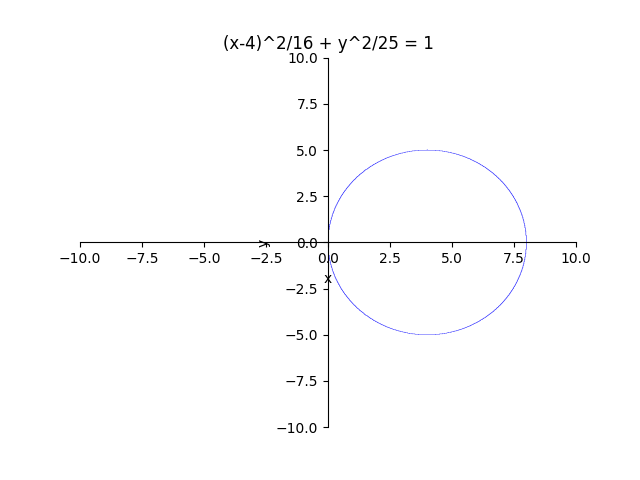
Ellipse Conic Section
-

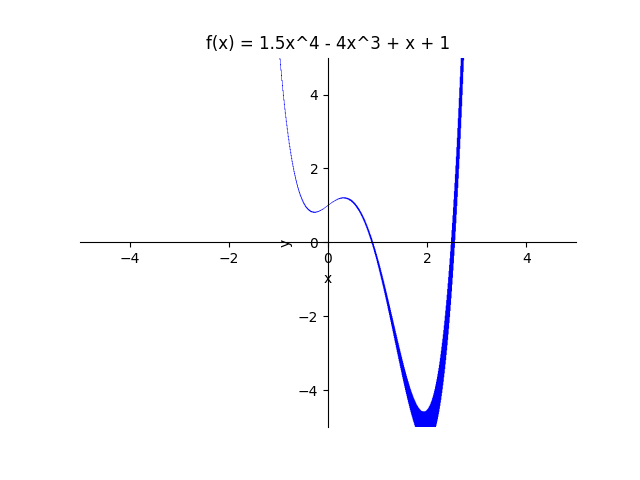
Quartic Polynomial Equation Graph
Inspiration
In our school, our math classes from Algebra 2 to AP Calculus AB use Desmos or Symbolab to graph various functions, from linear trends, to conic sections. Using these tools in class, I decided to use my coding skills to create my own graphing calculator.
What it does
The project takes a function, such as y = x^2 for example. Then it asks for the range of the graph or how long the x/y axis should be. Then, before saving the graph as a png file, the code asks for what to name the file.
How we built it
Combining two python libraries to create this project, Sympy is a python computer algebra system designed to do a variety of mathematical operations, from simplifying fractions, to partial fraction decompositions, to solving 4+ systems of equations. Matlibplot is a python library designed to plot "interactive visualizations" of data. From pie charts, scatter plots, line plots, and more.
Sympy was used to first parse the function. For example Python does not allow multiplication like 2x, instead it takes 2*x. In order to make the project as broad as possible, we needed Sympy to parse the inputted function to accept mathematical notation (^, sqrt). Matlibplot was then used to plot the actual graph, using standard Cartesian coordinates, with a axis length inputted by the user.
Challenges we ran into
Obviously the biggest challenge was getting the program to accept mathematical notation. Python doesn't take exponents as ^, but instead as **. To fix that I had to use .replace() functions before I could graph anything.
Another challenge was splitting the equation into two parts, left side and right side, and then parsing both sides, and then recombining them in order to graph them.
Accomplishments that we're proud of
Overall, I am proud that I was able to get the program to accept a variety of mathematical concepts, such as conic sections, linear trends, inequalities and high degree polynomials.
What we learned
The Sympy Python library is very flexible and its able to accept a variety of data. The library can especially be useful if you like to combine both computer science and mathematics.
The Matplotlib library is useful if you are studying statistics, again a very flexible library with loads of tools you can use to help design stats data.
But perhaps the most important thing I learned, was patience, coding takes time and we will all run into errors along the way.
What's next for Sympy Graphing Calculator
Sympy Graphing Calculator v1 will be expanded more definitely into the future. Features in the future include:
- Solving for roots/zeros
- Graph limits (infinity for example)
- Option of Solving Equations (2x-2 = 5x)
- Factoring
- Much More!
Built With
- matplotlib
- python
- sympy


Log in or sign up for Devpost to join the conversation.