-
doctor dashboard
-
patient dashboard
Smart Patient Symptom Tracker
Inspiration
In real clinical practice, doctors often rely on verbal symptom recall during consultations. Patients are asked questions like “How bad was the pain?” or “When did the fever start?”—and answers are usually approximate, incomplete, or influenced by memory bias.
This gap between what actually happened over time and what is recalled at the visit can lead to delayed or suboptimal decisions.
The inspiration for this project came from a simple question:
What if patient symptoms were captured continuously and transformed into clear trends instead of verbal guesses?
This project aims to replace subjective recall with objective, time-based medical insights.
What We Built
Smart Patient Symptom Tracker is a lightweight healthcare prototype that allows:
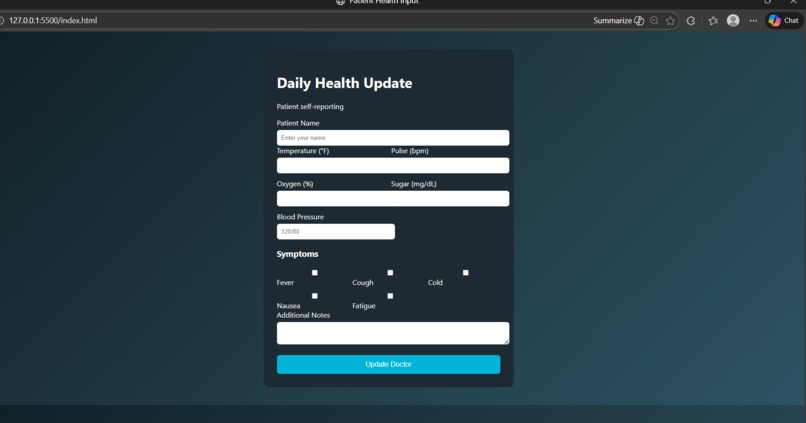
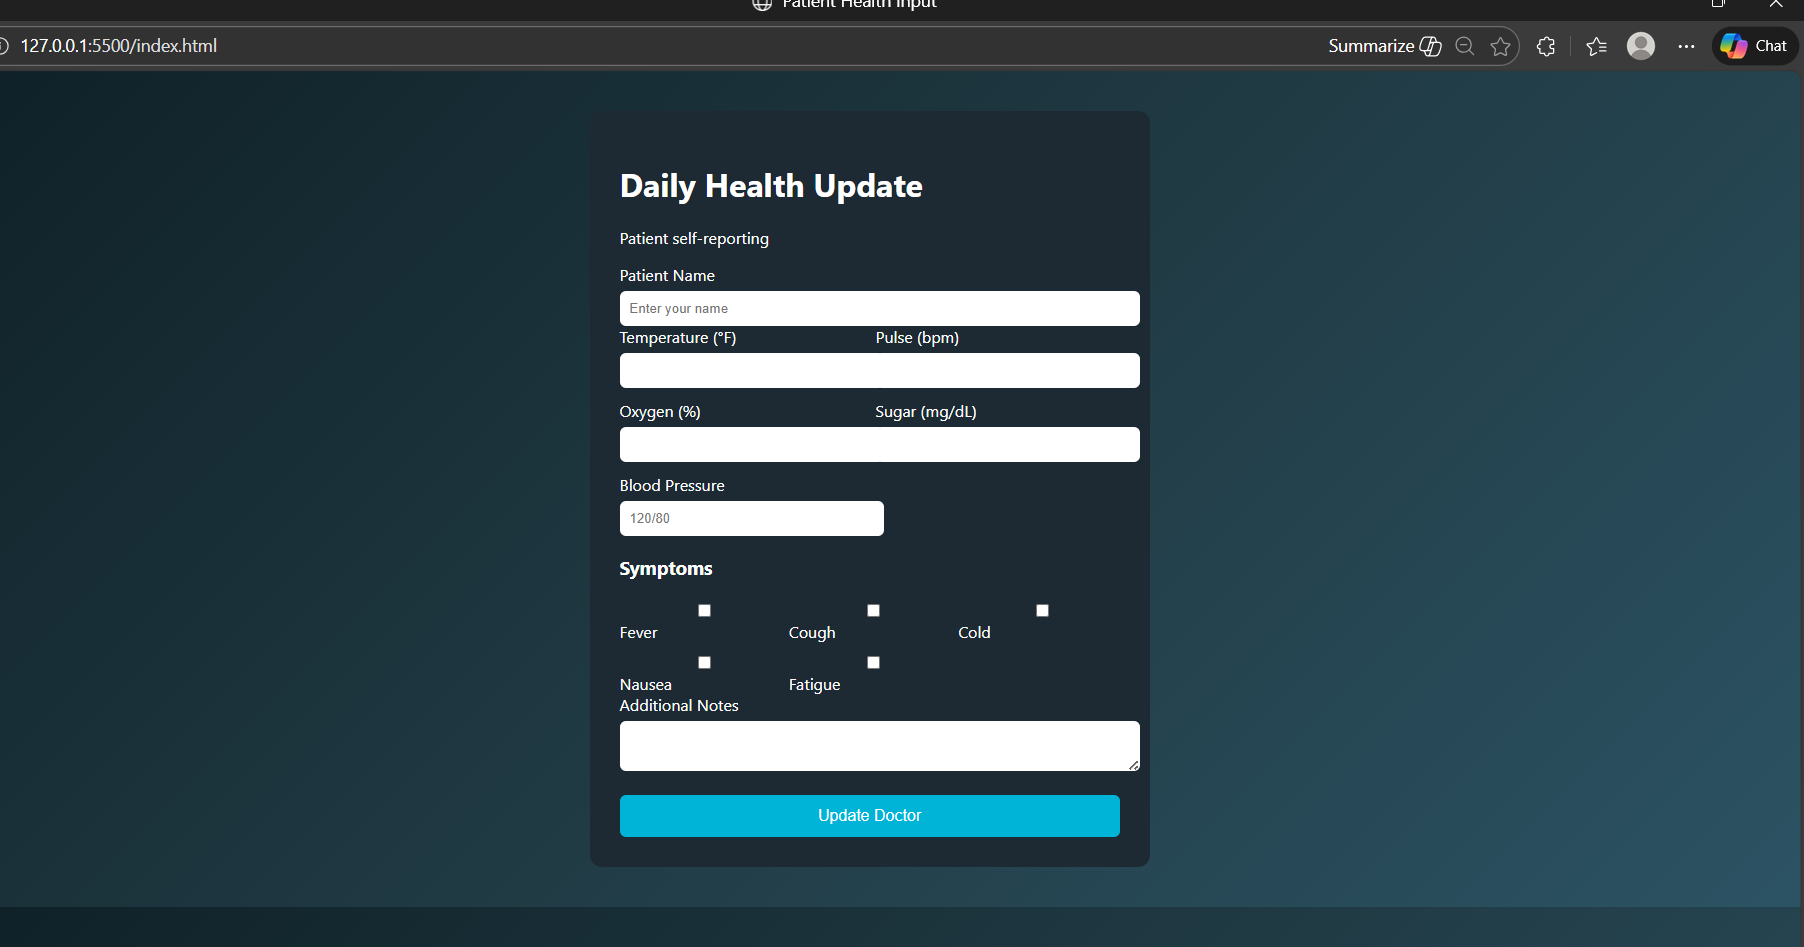
- Patients to log daily vitals and symptoms
- Doctors to view real-time summaries and Historical trends
- Medical data to be modeled correctly as time-series health data
The system focuses on clarity for doctors, not raw data overload.
How We Built It
Frontend
- Built entirely using HTML, CSS, and Vanilla JavaScript
- Two views:
- Patient View: Dark-themed, calm UI for entering vitals and symptoms
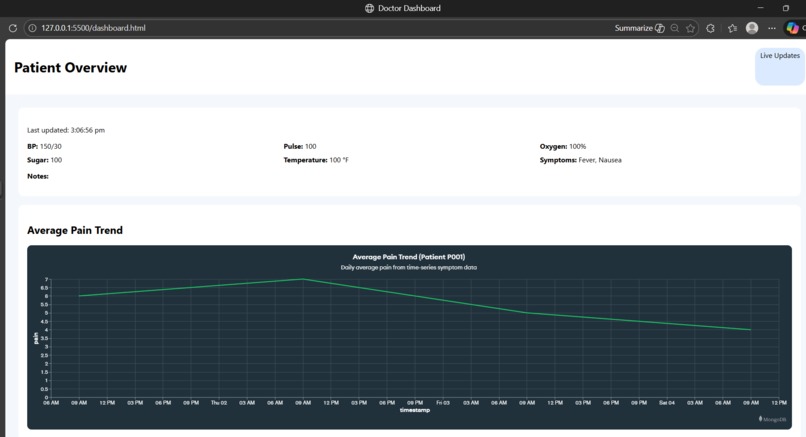
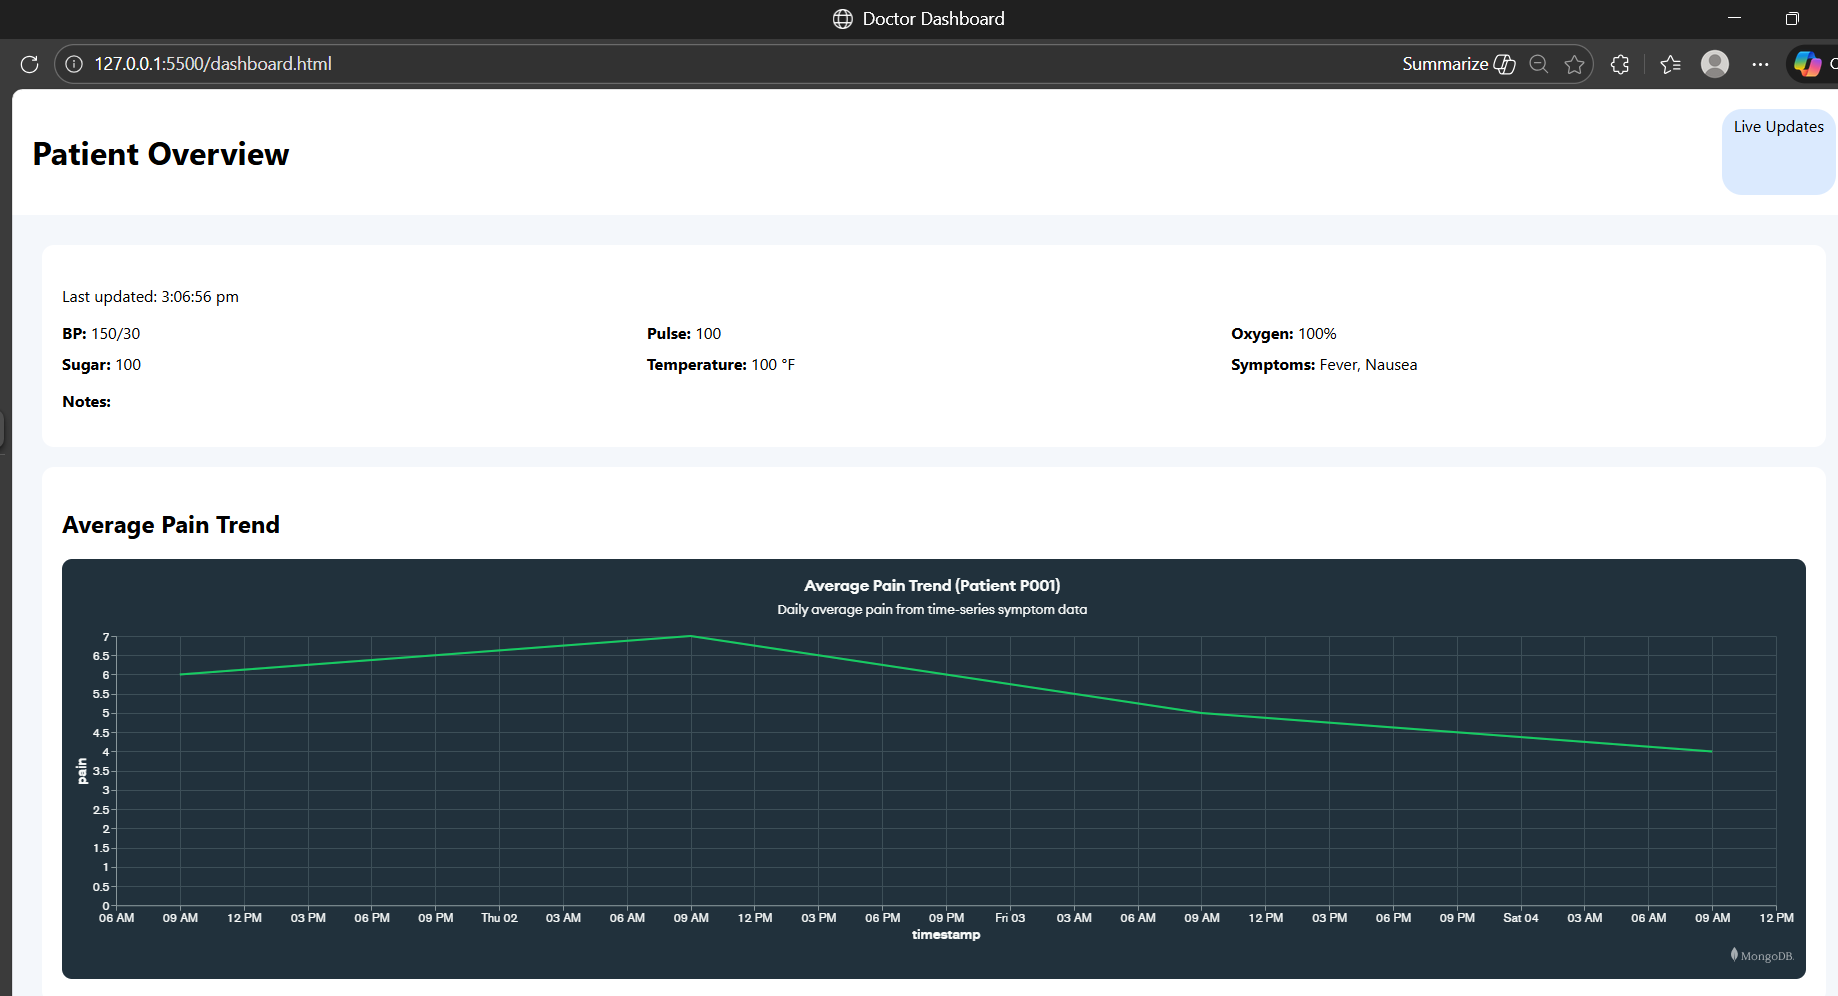
- Doctor Dashboard :Clean clinical layout showing patient snapshot and analytics
- Real-time updates between patient and doctor views are simulated using browser-based state updates for the prototype
Database & Analytics
- Medical data is modeled as time-series data
- Each patient update represents a time-stamped health snapshot
- Historical trends are computed using daily aggregation
- Visualization is handled directly at the database layer, eliminating manual data processing
Design Philosophy
- Flexible data structure to support evolving medical parameters
- Append-only records to preserve data integrity
- Trends over time instead of isolated readings
What We Learned
This project reinforced several important concepts:
- Healthcare data is naturally time-series, not relational tables
- Schema flexibility is critical when health parameters evolve
- Analytics are more valuable than raw logs
- Good UI for doctors prioritizes signal over noise
- A prototype does not need heavy infrastructure to demonstrate a scalable idea
We also learned how to design a system that clearly communicates technical correctness to non-technical judges.
Challenges Faced
- Infrastructure Constraints
Building a browser-only prototype without backend services required careful architectural decisions to keep the demo realistic while remaining simple.
- Time-Series Modeling Ensuring that data was modeled as proper time-based records—rather than static entries—was essential for meaningful analytics.
- UI Clarity Balancing medical completeness with visual simplicity was challenging. Doctors need all critical information, but presented in a way that is immediately understandable.
- Real-Time Demonstration Simulating real-time updates without server-side logic required creative use of frontend mechanisms while keeping the explanation production-realistic. ---
Why This Matters
By transforming symptom tracking into continuous, analyzable data, this approach enables:
- Earlier detection of worsening conditions
- Better-informed clinical decisions
- Reduced dependence on unreliable memory
- Scalable patient monitoring beyond hospital visits
Mathematically, instead of relying on a single recalled value doctors can reason over a trend: This shift—from single points to trends—is the core value of the project.
Conclusion
It demonstrates how modern data modelling and analytics can significantly improve patient–doctor communication. By combining time-series data with intuitive visualization, the project shows a clear path from daily symptom input to actionable medical insight.
”Track symptoms. See trends. Treat better.”
Built With
- backend
- frontend
- mongodb


Log in or sign up for Devpost to join the conversation.