-
-
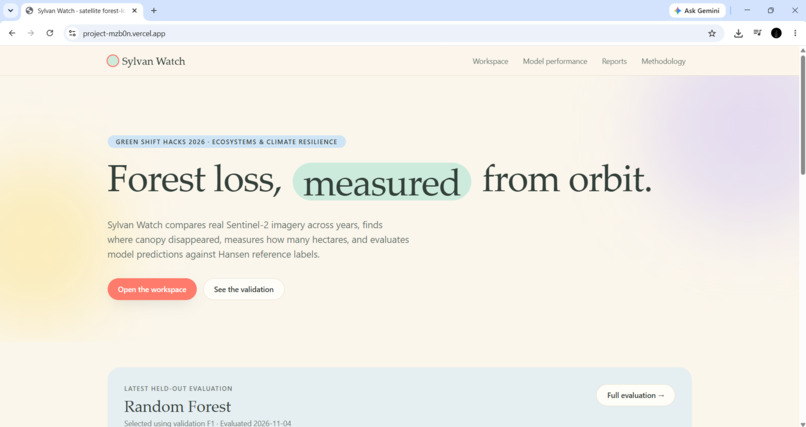
Landing Page — AI-powered forest monitoring using satellite imagery.
-
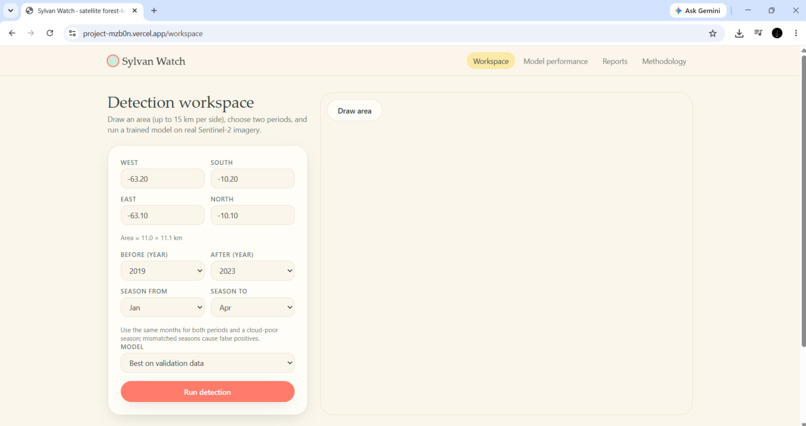
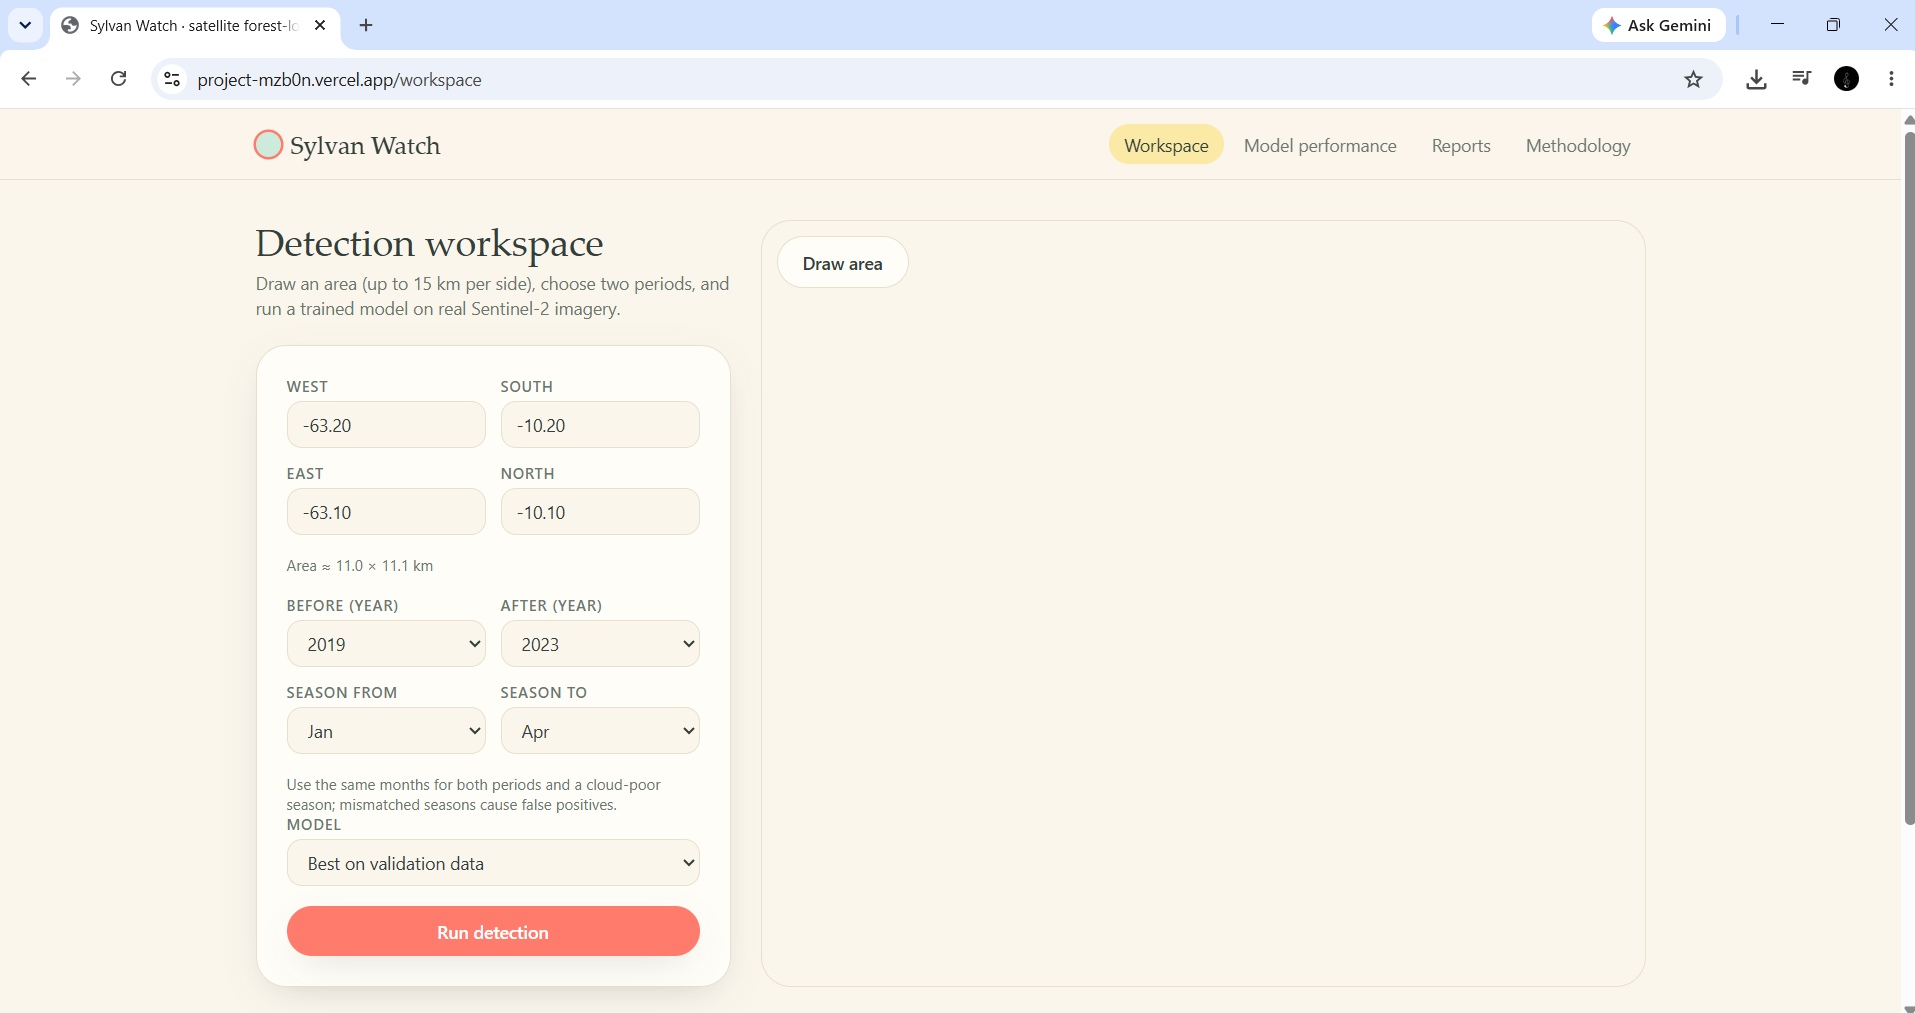
Detection Workspace — Explore an area of interest and configure satellite-based forest change analysis.
-
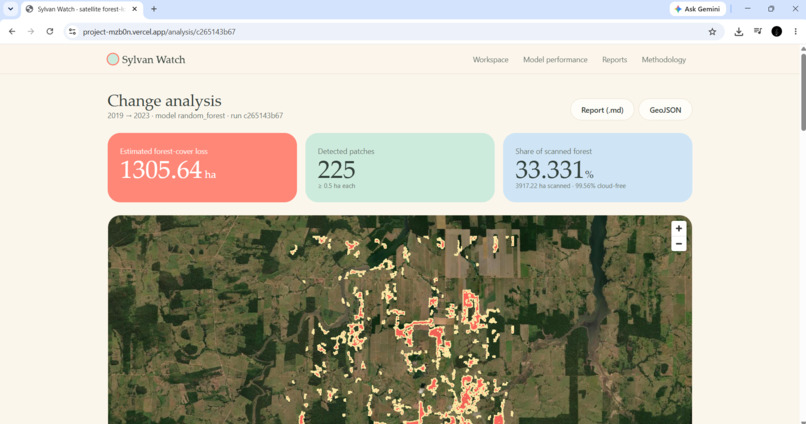
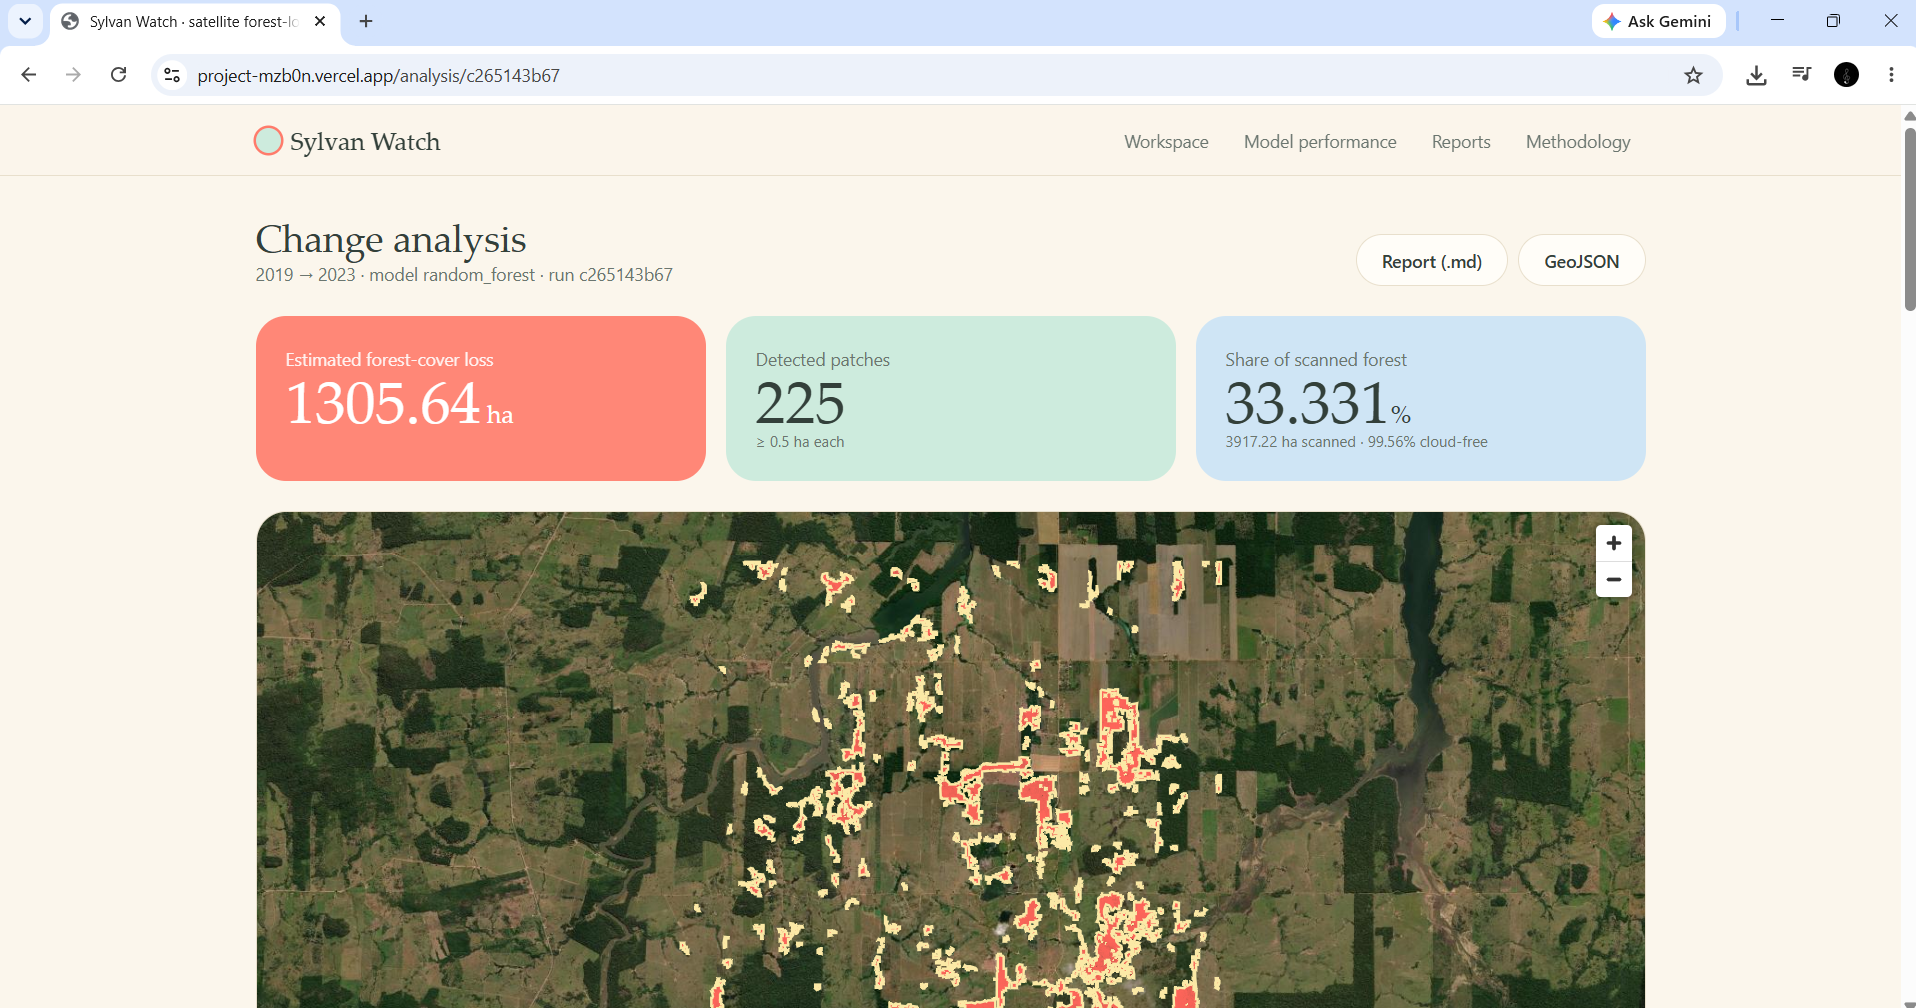
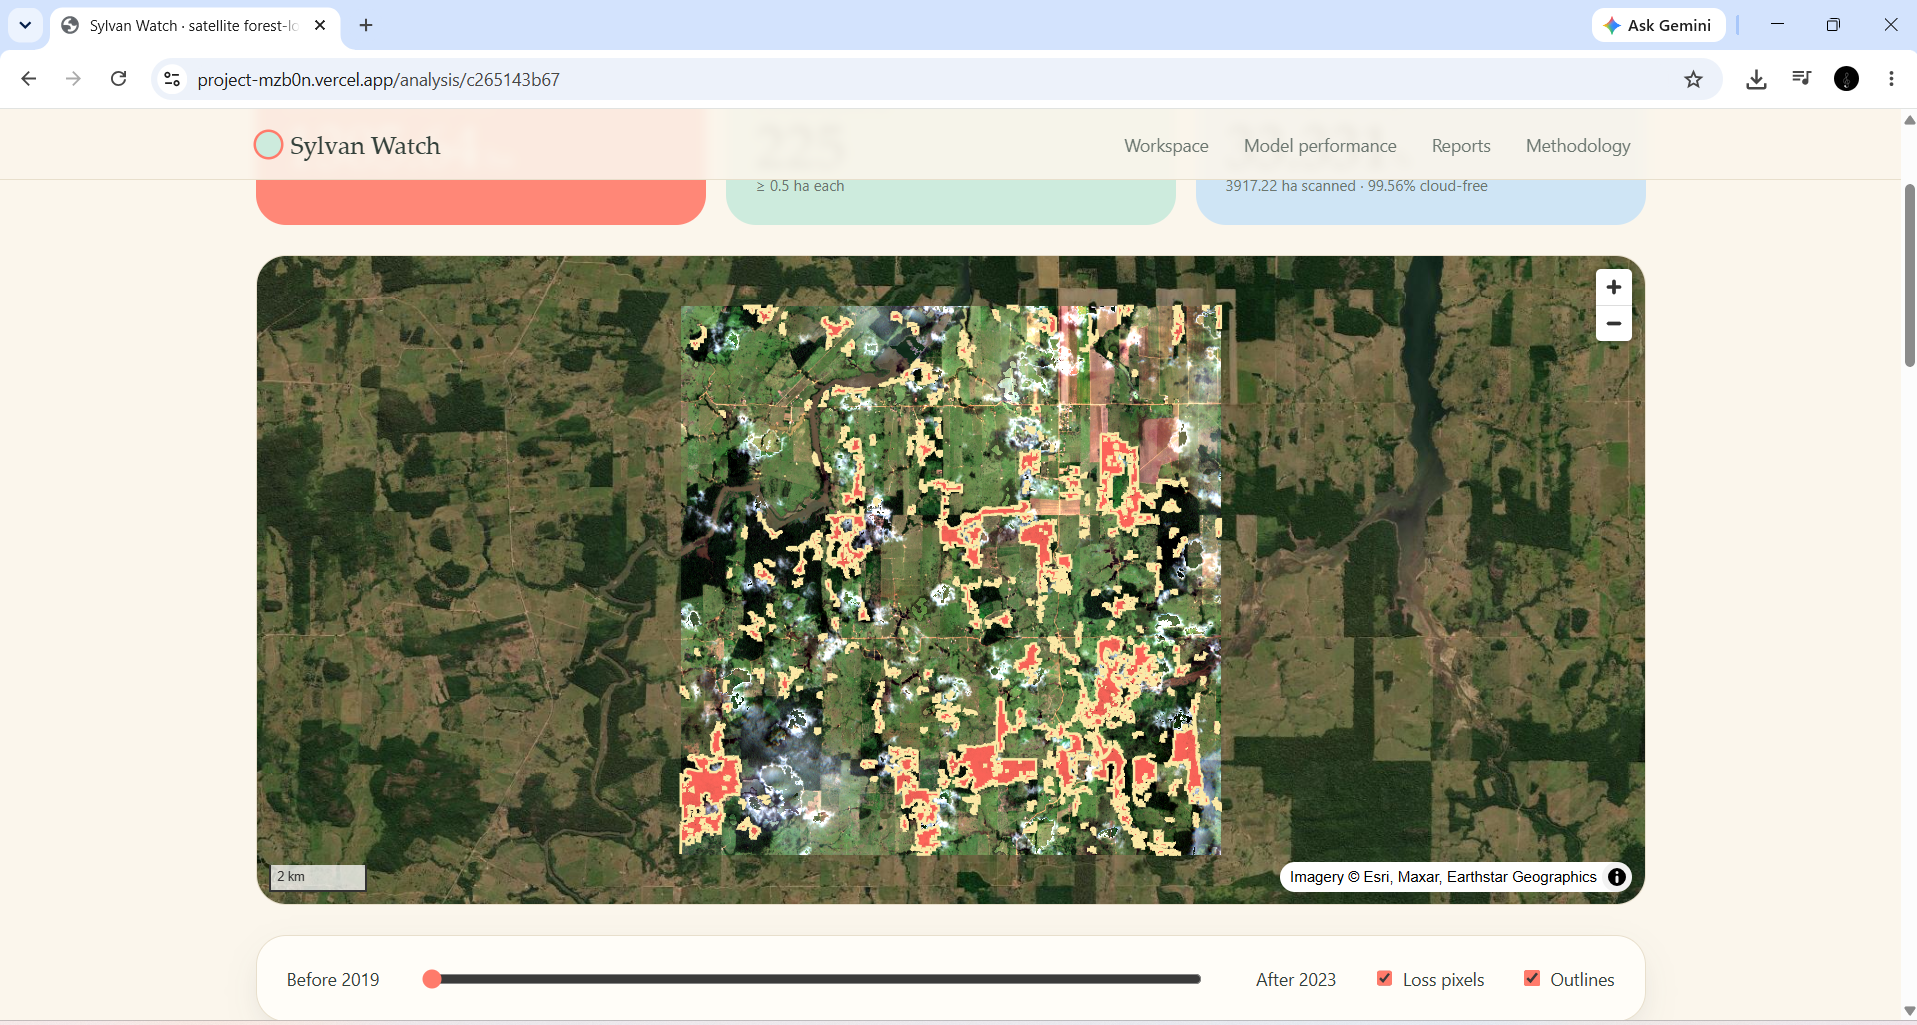
Forest Loss Detection Map — Visualise potential forest-cover loss and inspect detected locations on an interactive map.
-
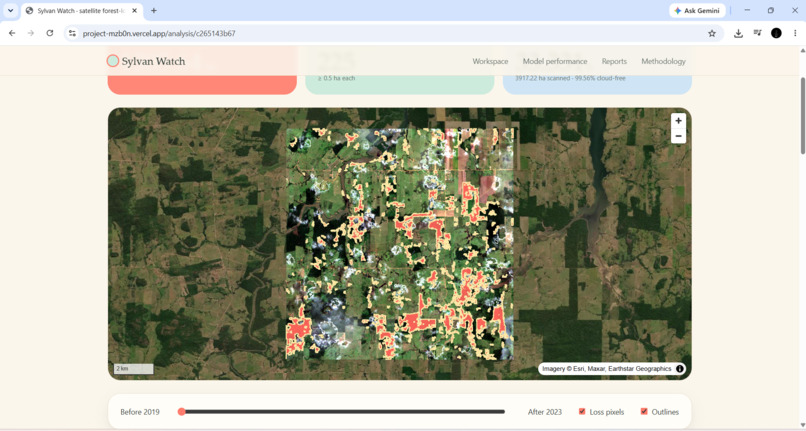
Before and After Comparison — Compare satellite imagery across two time periods to identify changes in forest cover.
-
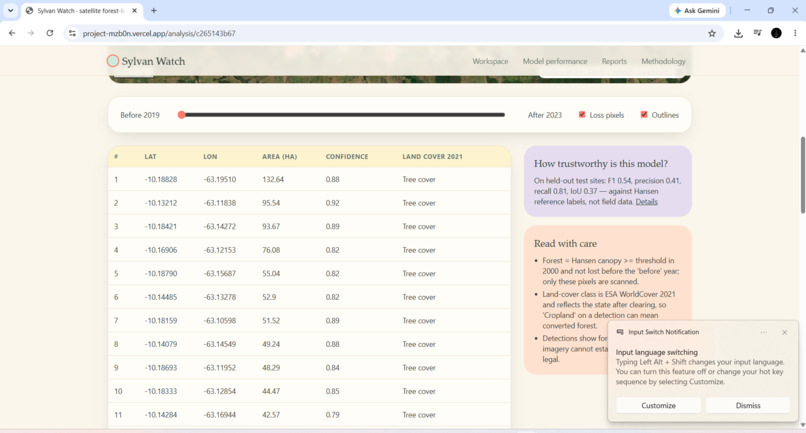
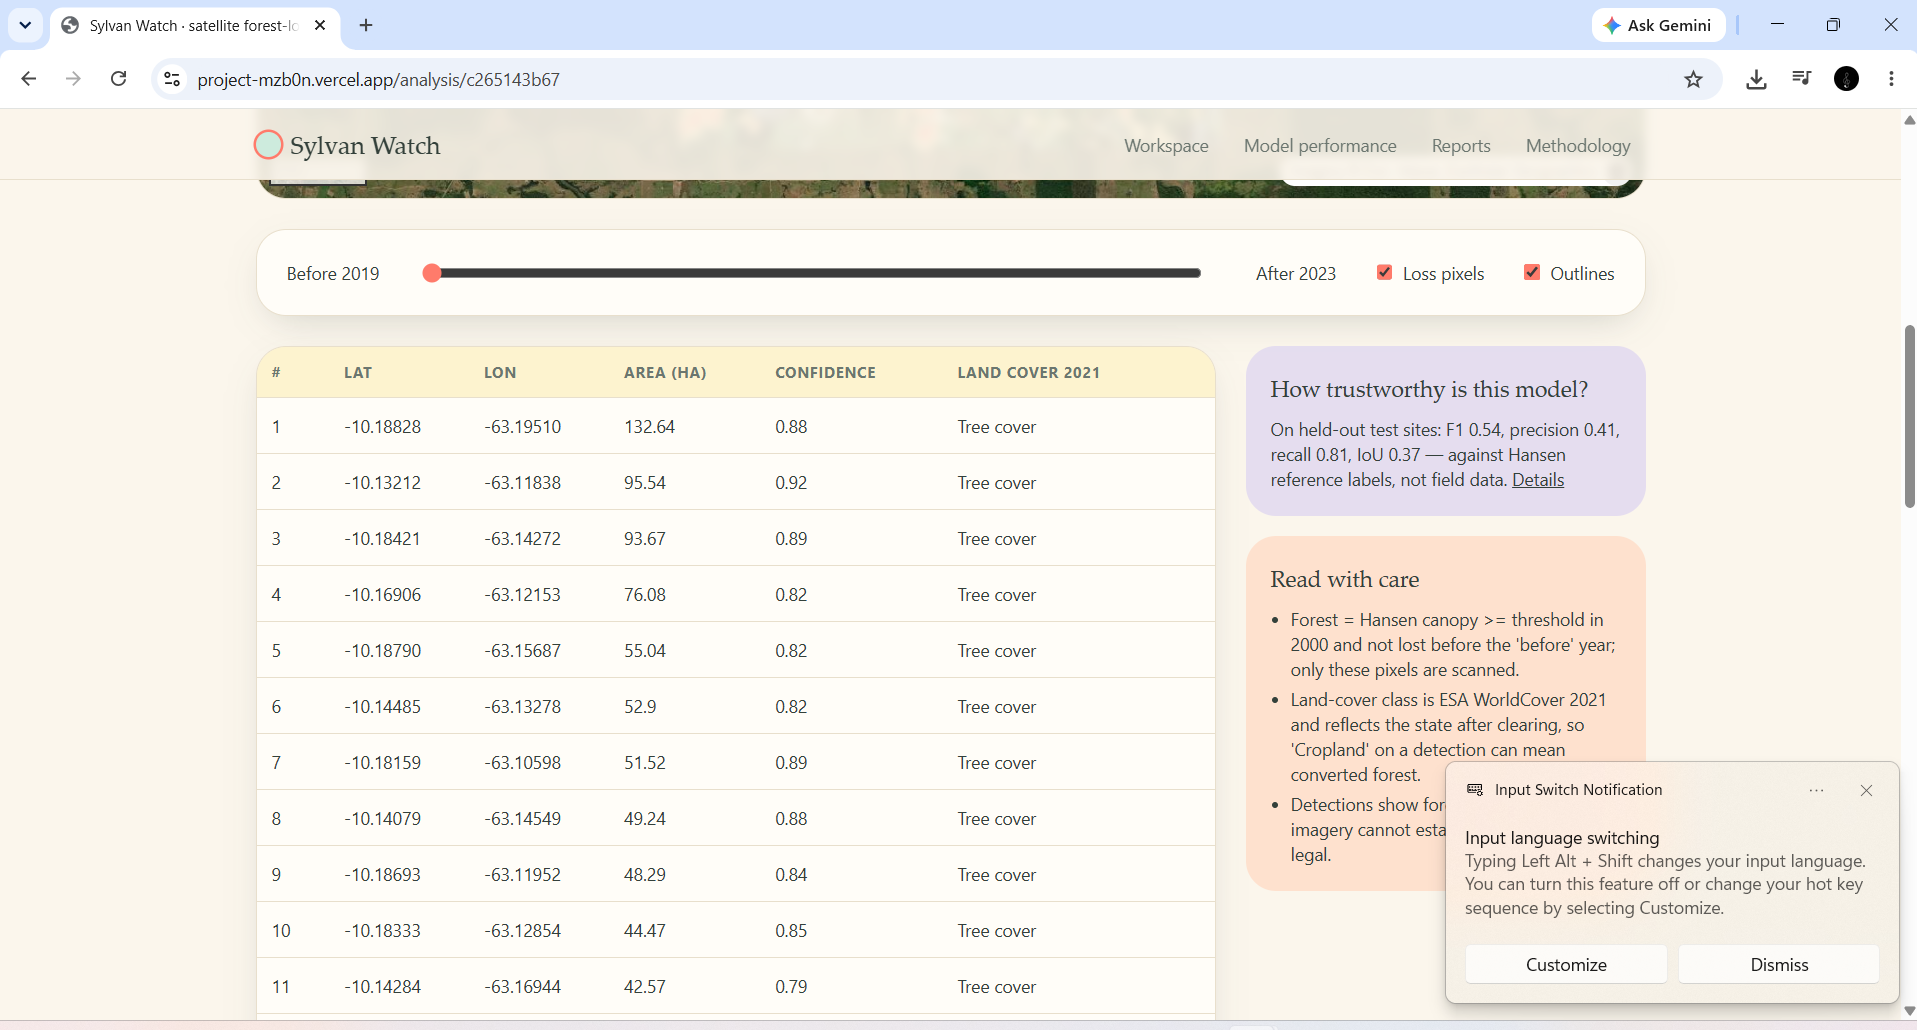
Change Analysis Dashboard — Review estimated affected area, detection counts, and geographic information in one place.
-
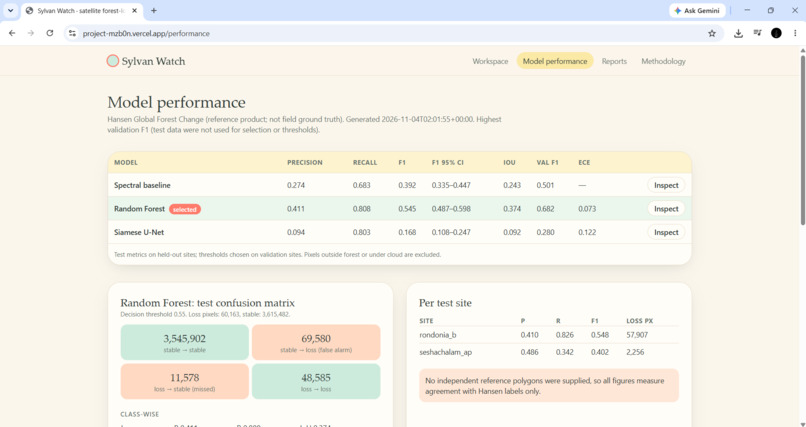
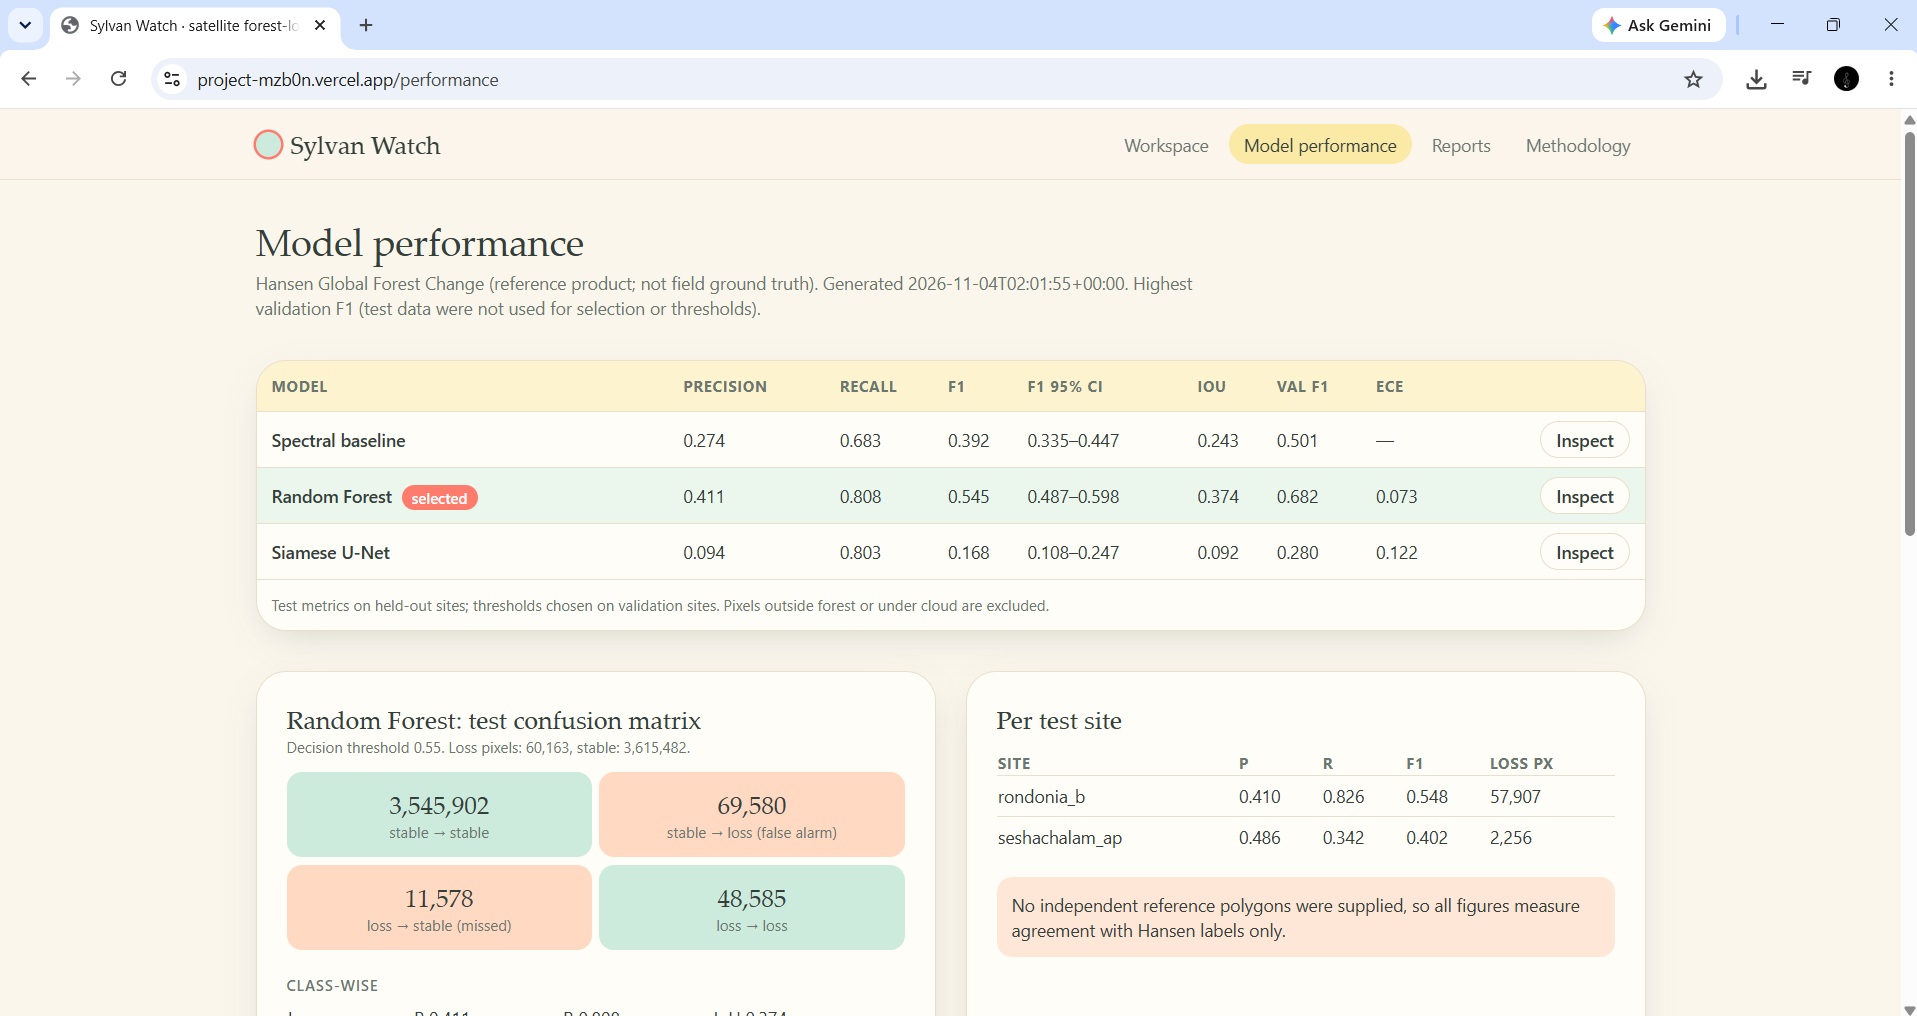
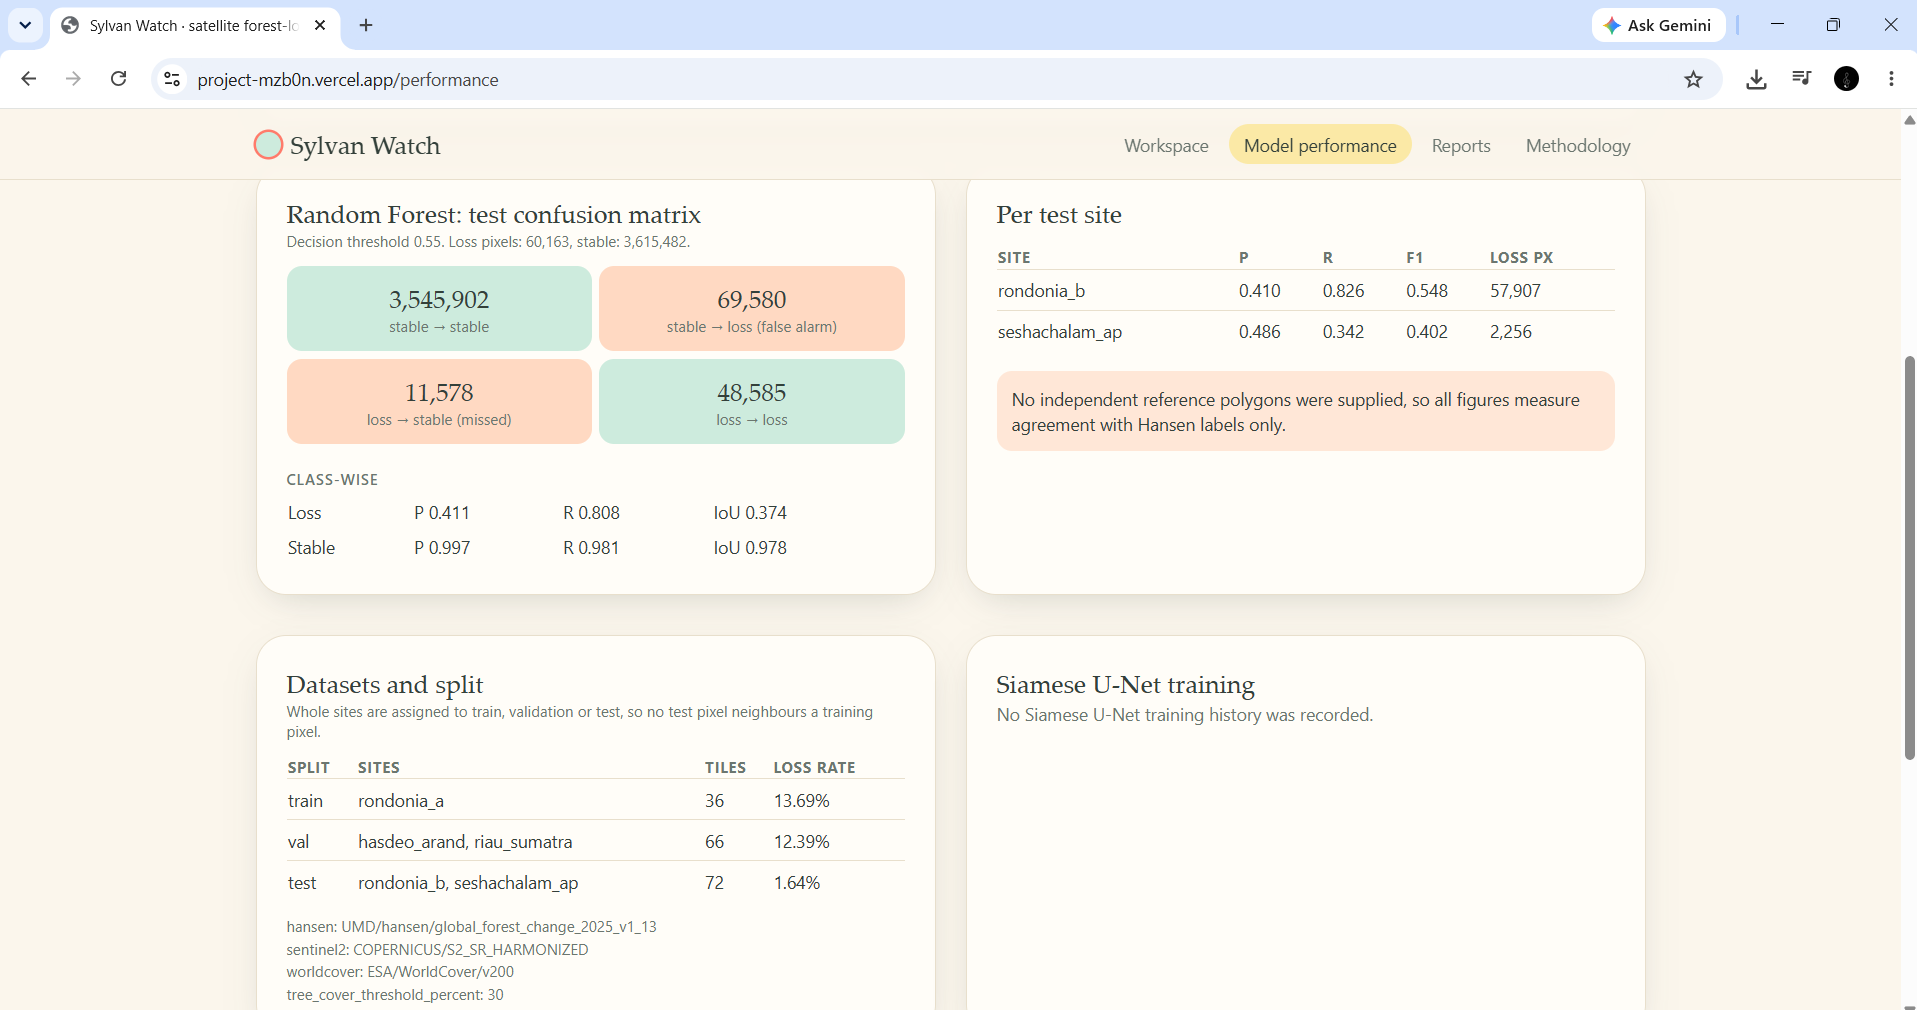
Model Performance Evaluation — Examine model performance through precision, recall, F1 score, and evaluation results.
-
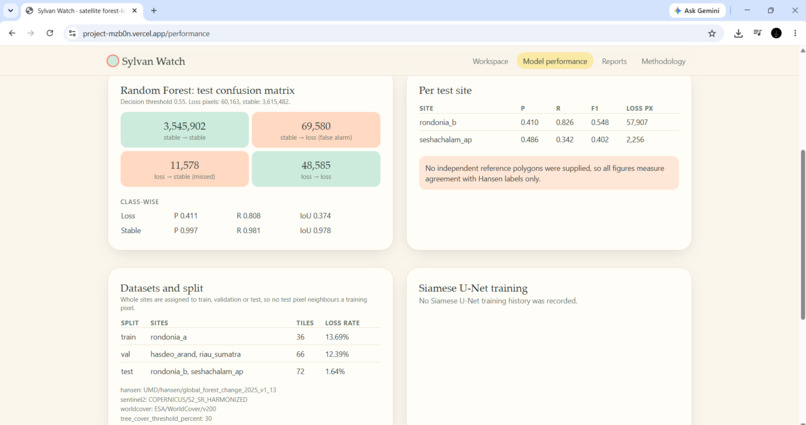
Datasets and Model Comparison — Compare model results and understand how different approaches perform on the evaluation data.
-
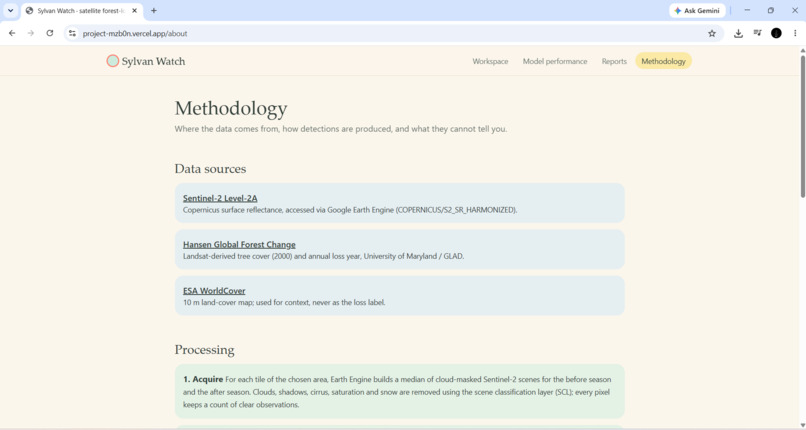
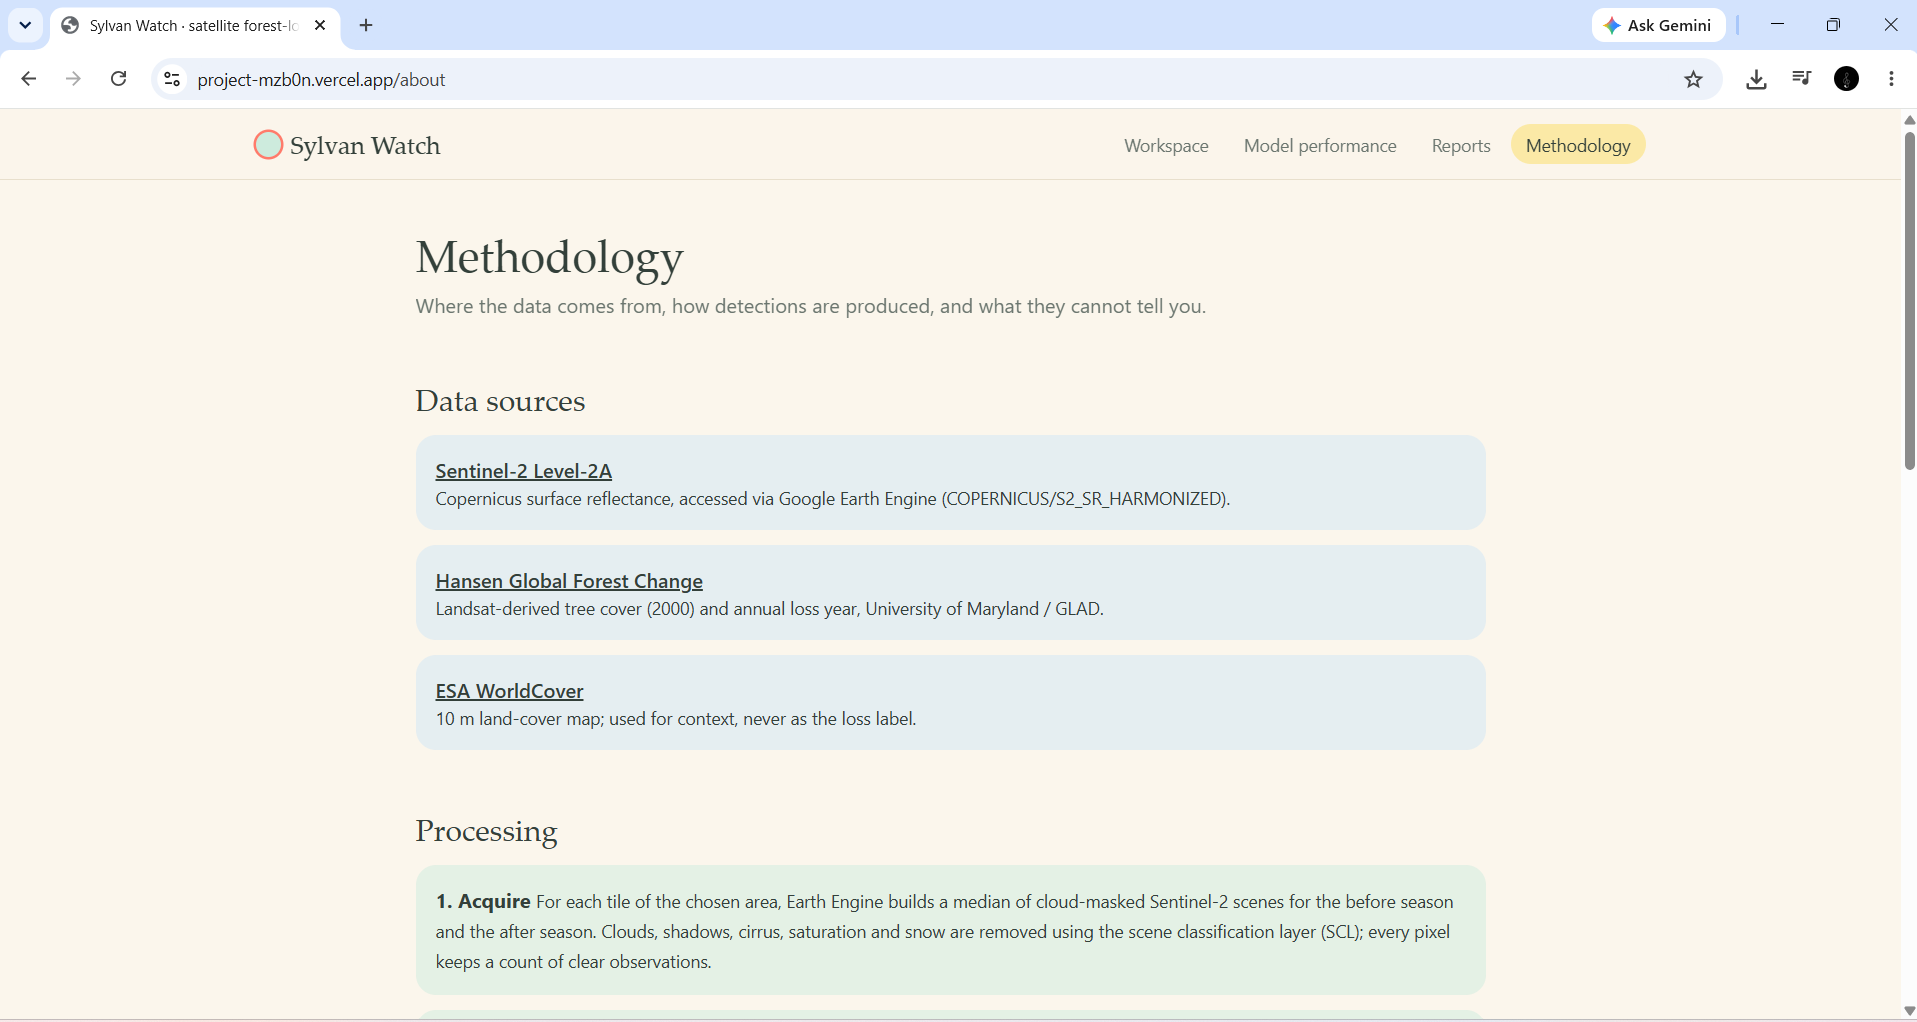
Methodology and Data Sources — Explore the satellite datasets, processing pipeline, and methodology behind Sylvan Watch.
-
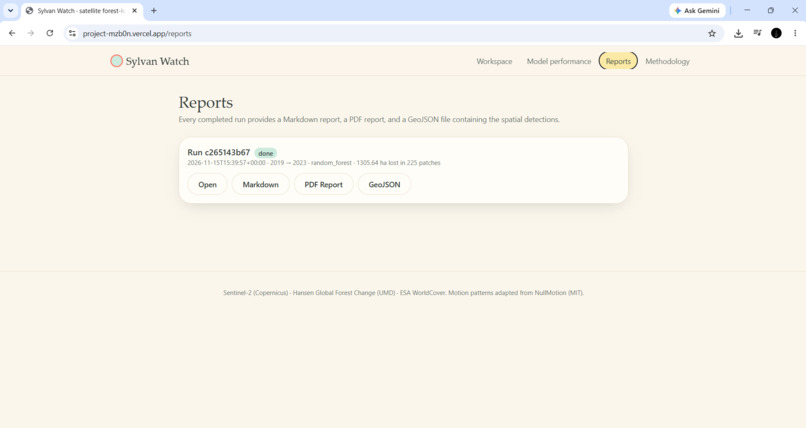
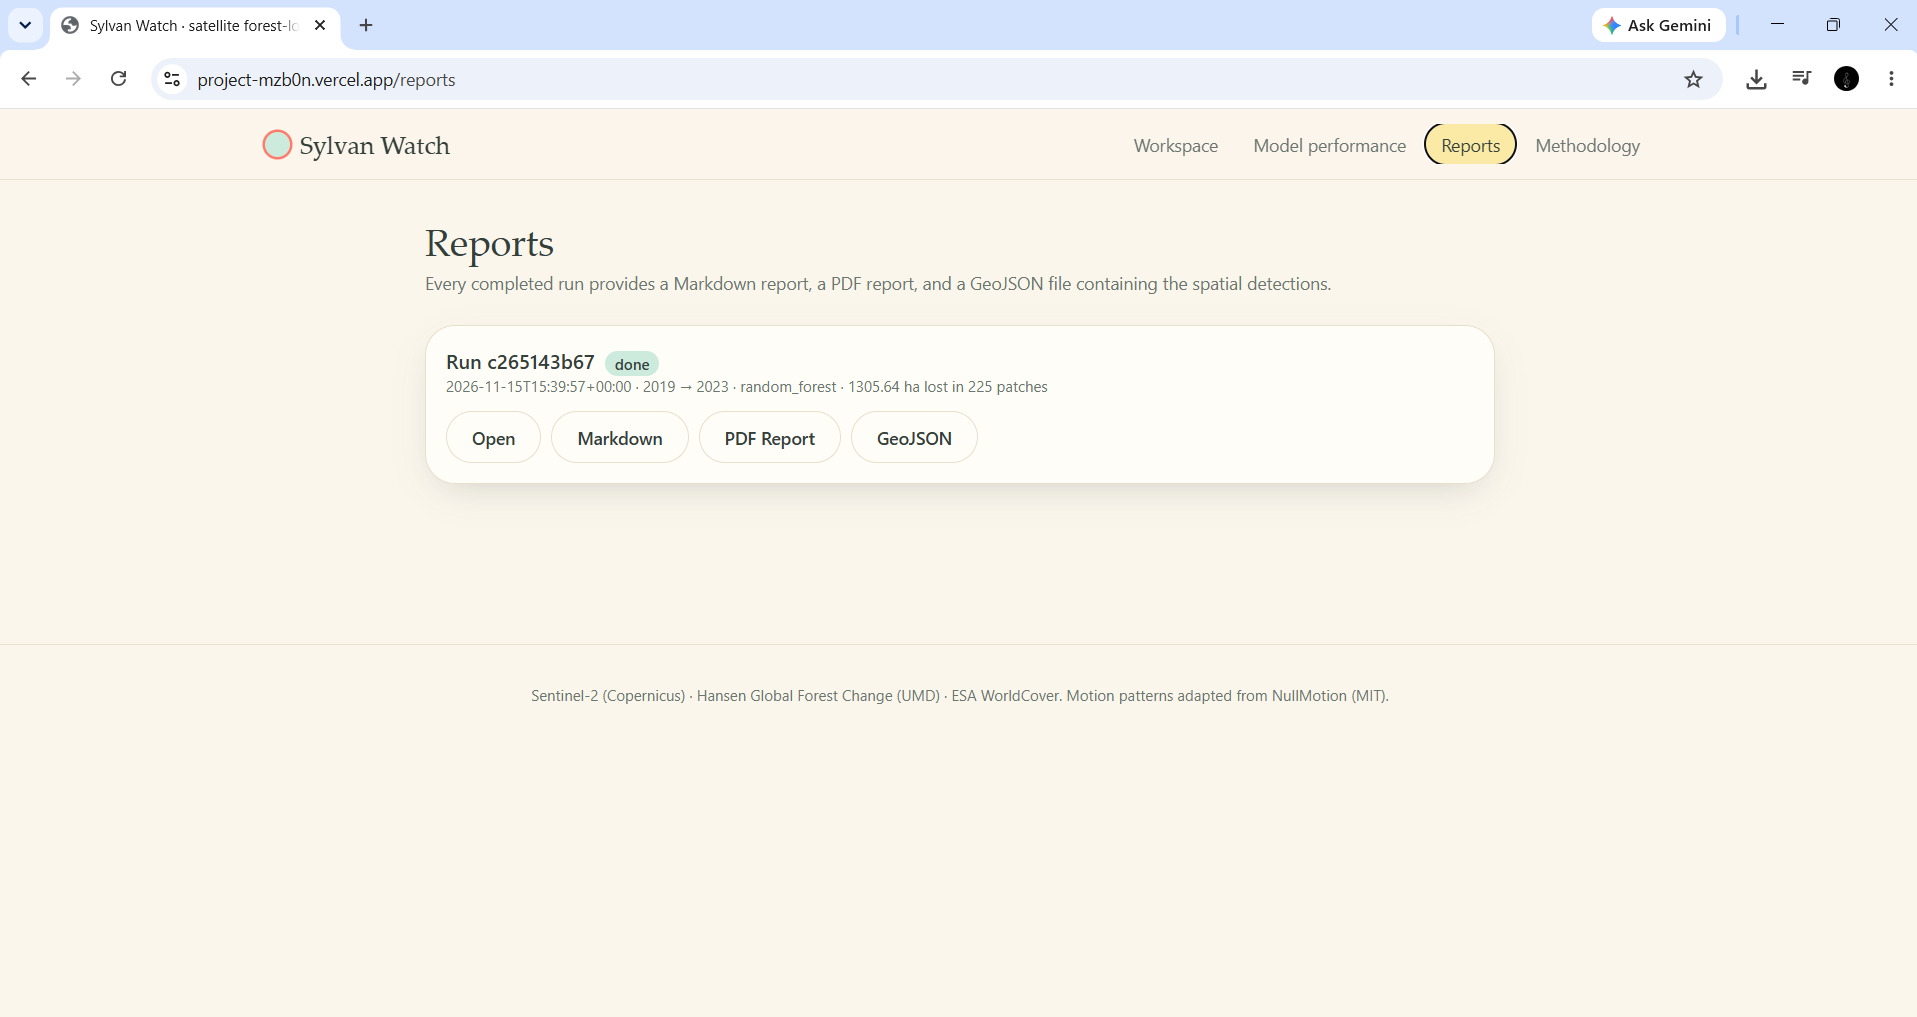
Generated Report — Forest-loss insights, mapped locations, and detection results.
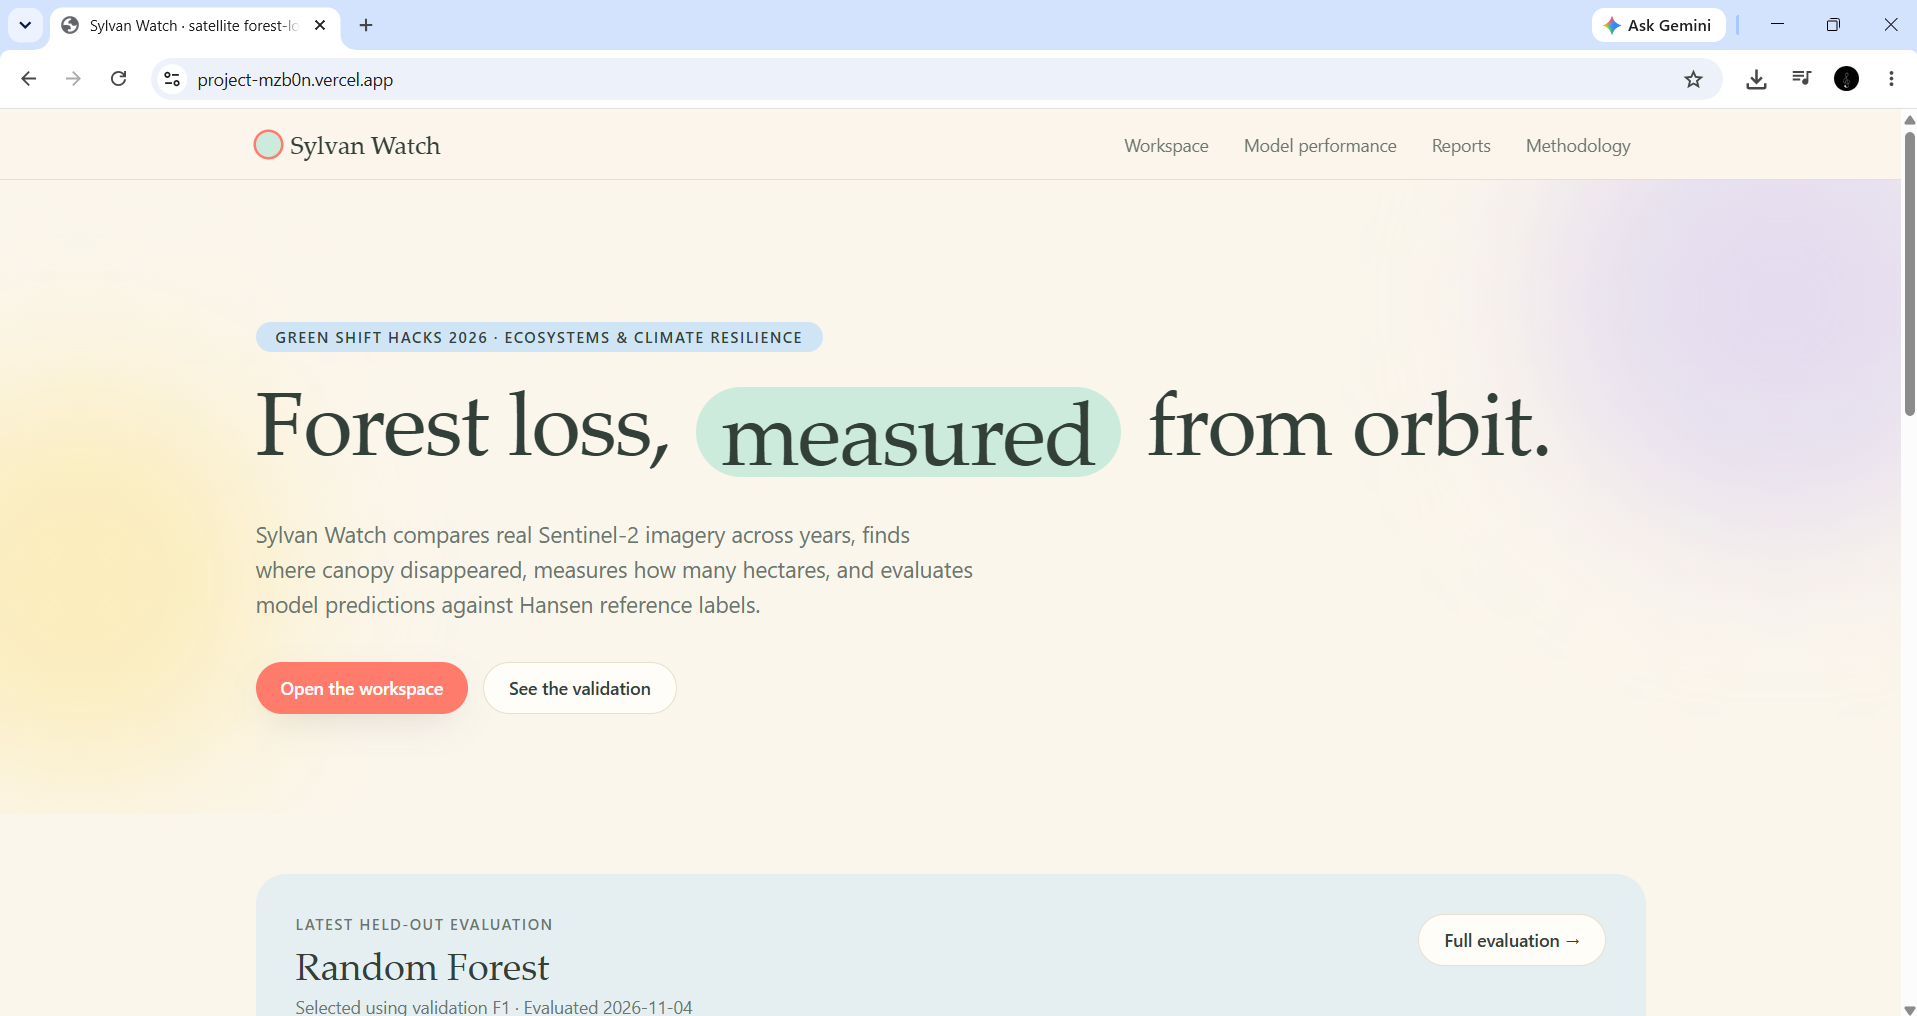
Sylvan Watch
Turning satellite observations into actionable forest monitoring.
Forests don't disappear all at once. Changes can happen across remote areas, and identifying exactly where those changes are taking place is not always easy. Satellite imagery provides an enormous amount of information, but turning that information into something a person can actually investigate is the real challenge.
That is the problem I wanted to work on with Sylvan Watch.
Sylvan Watch is a satellite-based forest monitoring tool that compares real Sentinel-2 imagery across two different time periods and identifies areas of potential forest-cover loss. Instead of making users manually examine satellite images, it brings the comparison, detection, visualisation and reporting process into one workspace.
How it works
The workflow is designed to be straightforward, even for someone who isn't working directly with machine learning.
A user selects an area on the map, chooses a before-and-after period, and selects matching seasonal months. Sylvan Watch processes the satellite imagery and runs its trained detection model.
The results are presented through an interactive map, where users can:
- Compare satellite imagery from two different periods.
- View areas identified as potential forest-cover loss.
- Inspect detected patches and their geographic locations.
- Review estimated affected area and detection statistics.
- Explore model performance and the underlying methodology.
- Generate reports that can support further investigation.
The idea is to move beyond simply showing that forest cover may have changed. The tool helps users understand where the change occurred, how much area may be affected, and which locations deserve closer attention.
Who can use it?
Sylvan Watch is intended as a decision-support tool for forest departments, conservation organisations, environmental researchers and teams involved in land monitoring.
For example, a conservation team monitoring a large forest region could use it to identify candidate locations for field verification instead of beginning with a manual review of the entire area.
The output is not an enforcement decision. It is a starting point for investigation, helping people direct their attention towards locations that may need it.
What happens behind the scenes?
The application combines satellite data processing, geospatial analysis and machine learning.
The imagery and supporting datasets come from:
- Sentinel-2 Surface Reflectance through Google Earth Engine.
- Hansen Global Forest Change.
- ESA WorldCover.
The workflow includes cloud masking, seasonal image compositing, spectral feature extraction, model inference and geospatial visualisation.
The application is built with a Next.js frontend and a FastAPI backend. Python and scikit-learn handle the machine-learning workflow, with Google Earth Engine supporting satellite-data processing.
Testing the model, not just building it
One of the most important parts of this project was evaluating whether the detection results were actually useful.
The selected Random Forest model achieved an F1 score of 0.545, recall of 0.808, and precision of 0.411 on geographically held-out test sites. Its F1 score had a 95% confidence interval of 0.487–0.598.
These results also revealed areas that need improvement. A higher recall means the model identifies a substantial proportion of reference loss areas, but its precision shows that some detections may be false positives.
The evaluation measures agreement with Hansen reference labels, not independently verified ground truth. This distinction matters when interpreting the results.
The environmental impact
The purpose of Sylvan Watch is not to replace people working in conservation. It is to give them a more useful starting point.
By turning satellite observations into mapped candidate changes and downloadable reports, the tool aims to make forest monitoring more focused and help teams prioritise locations for field verification.
The longer-term goal is to support earlier investigation and better-informed conservation decisions. Actual hectares protected or improvements in field response have not yet been measured, and validating those outcomes would be an important next step.
Challenges and what I learned
Building Sylvan Watch involved more than training a model and displaying its predictions on a map.
Working with satellite imagery meant dealing with cloud cover, seasonal differences, geographic variation and inconsistent reference labels. I also had to consider how model predictions should be presented so that users do not mistake a detection for confirmed deforestation.
Model evaluation was particularly important. A model can produce an impressive-looking map while still making mistakes. Testing it across different geographic locations and making its limitations visible helped shape the way the final application presents its results.
This project strengthened my understanding of geospatial data processing, machine-learning evaluation, API integration and deploying a complete application.
What's next?
The next stage is to improve performance across more geographic regions, strengthen validation with field-verified observations, and explore ways to make the results more useful for real conservation workflows.
Sylvan Watch is built around one practical idea: make satellite-based forest monitoring easier to investigate, understand and act upon.
Built With
- fastapi
- geospatial-analysis
- google-earth-engine
- machine-learning
- next.js
- python
- pytorch
- react
- remote-sensing
- render
- satellite-imagery
- scikit-learn
- sentinel-2
- typescript
- vercel
