-
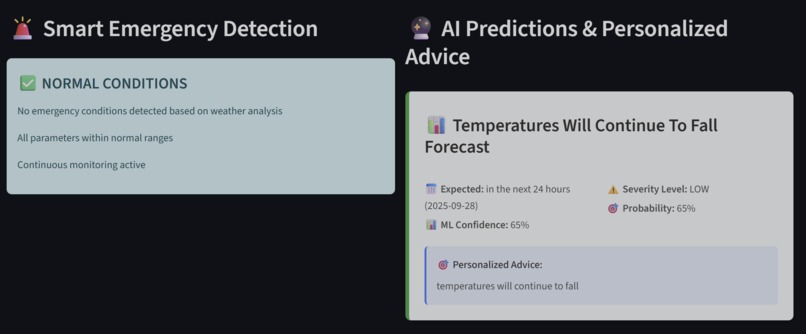
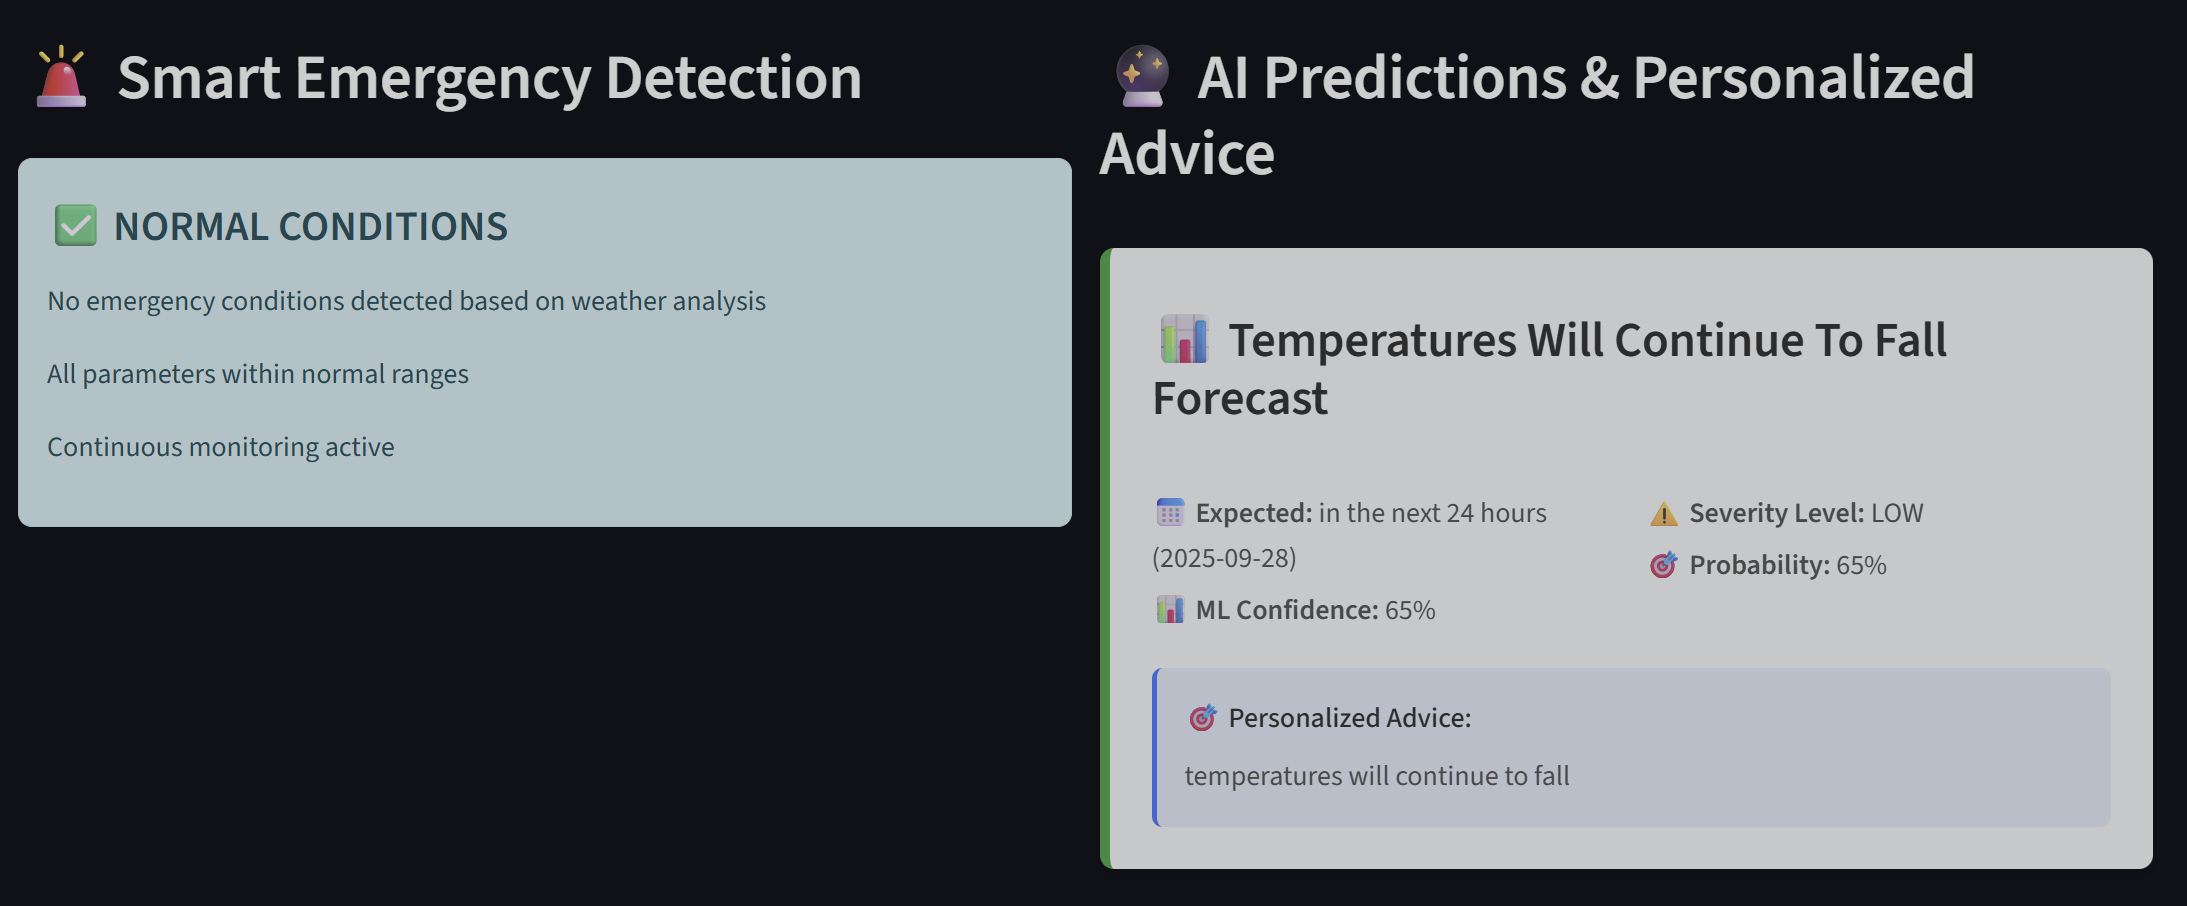
Emergency Alerts & AI Powered Predictions
-

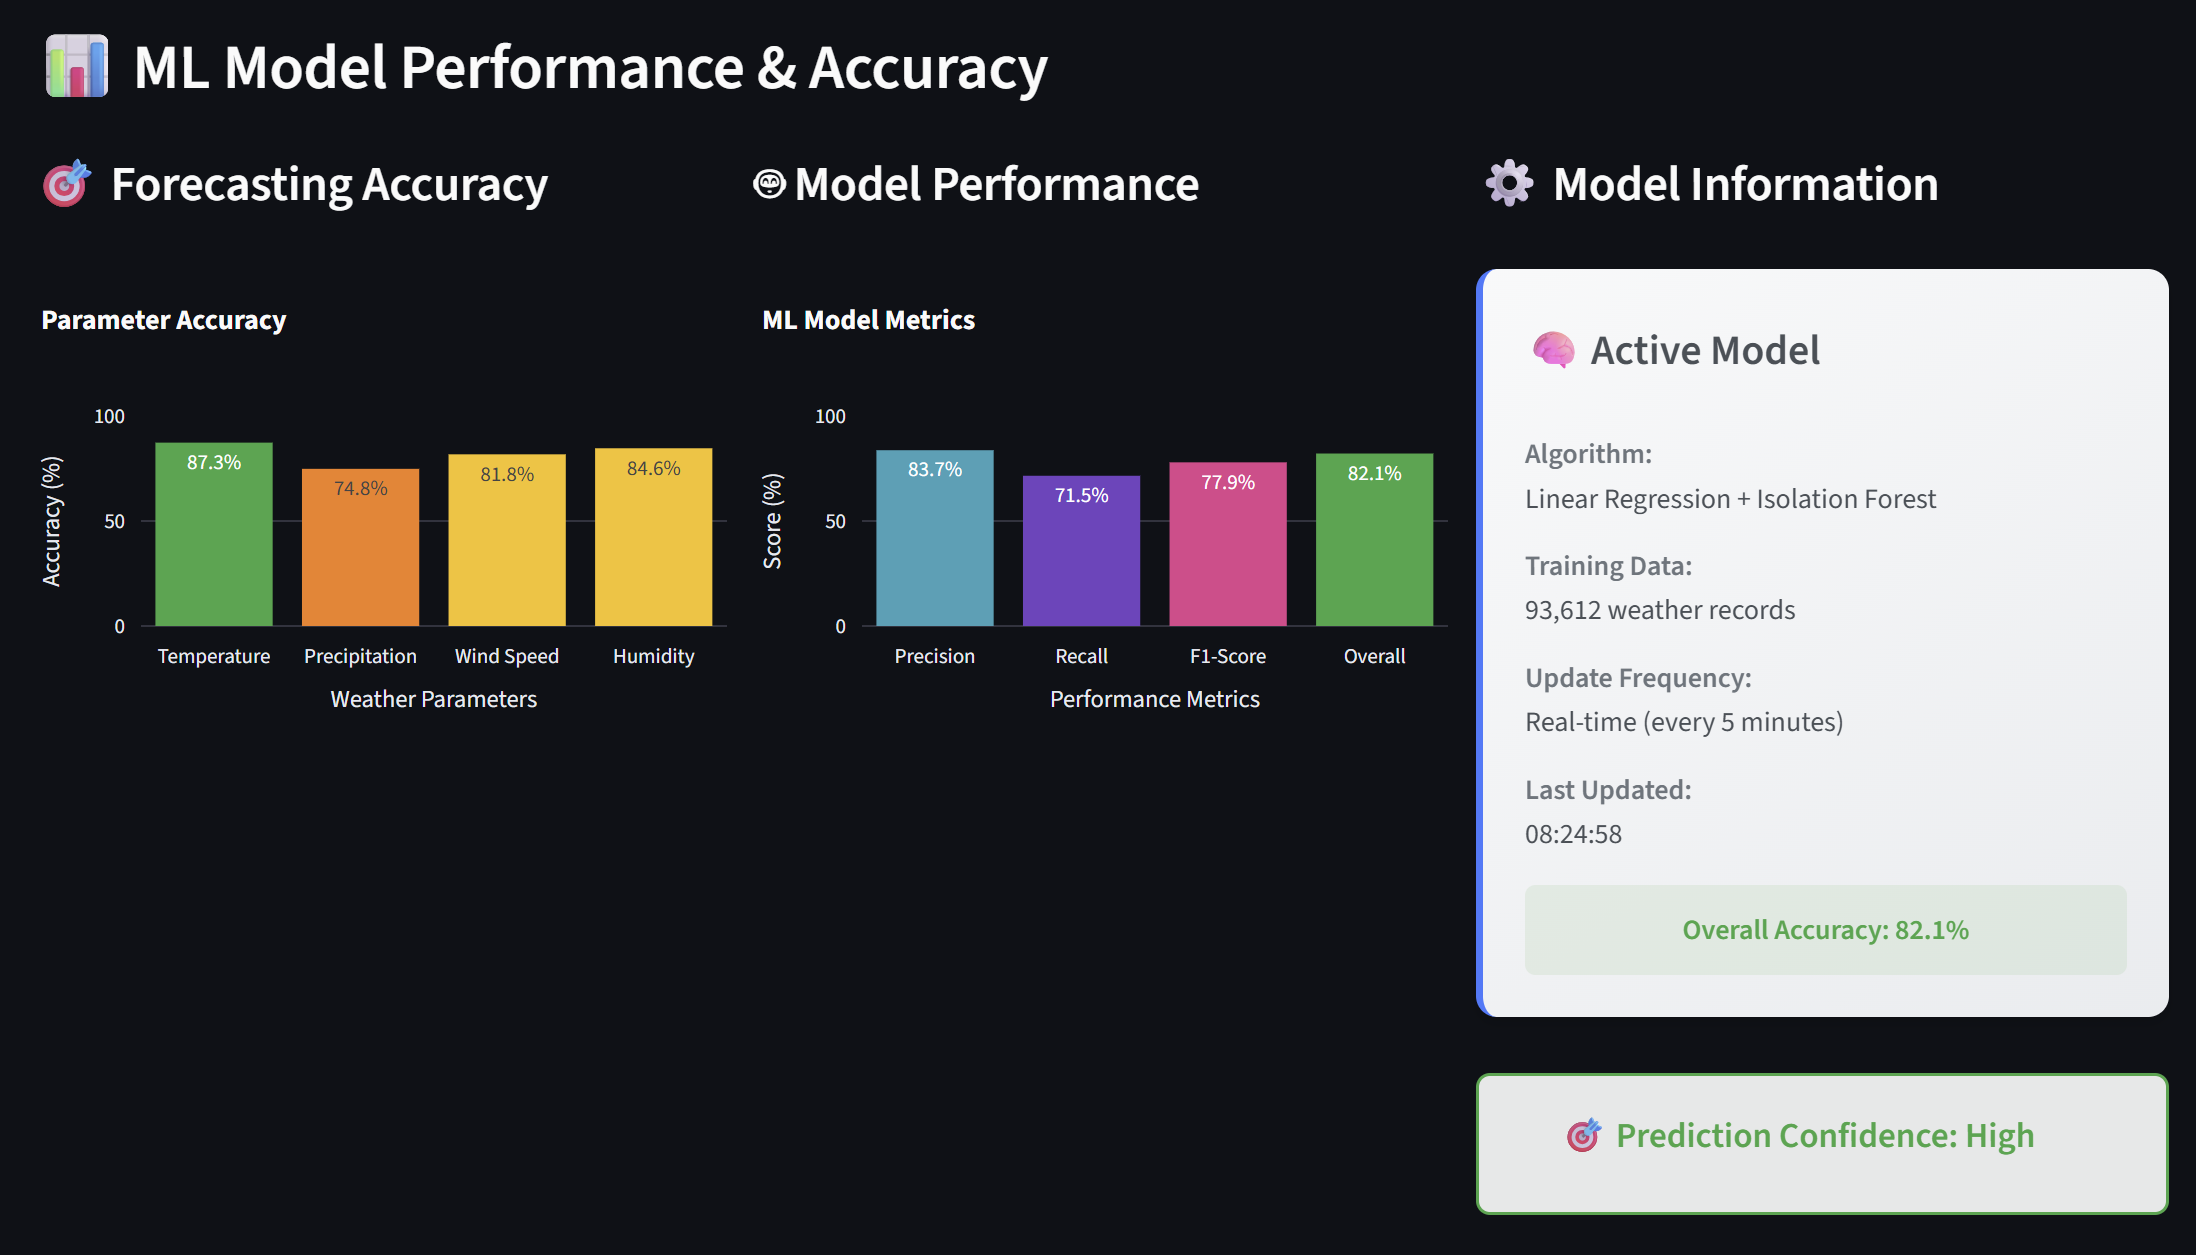
Machine Learning Model Performance Stats
-
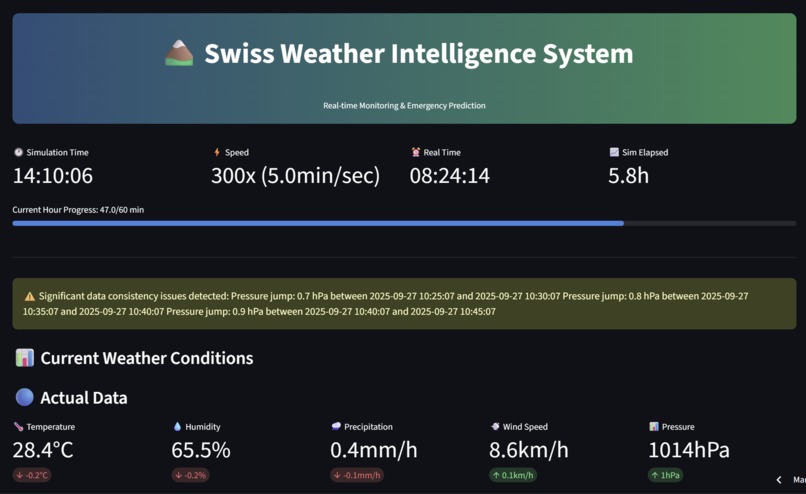
Realtime Dashboard & Simulation Details
-
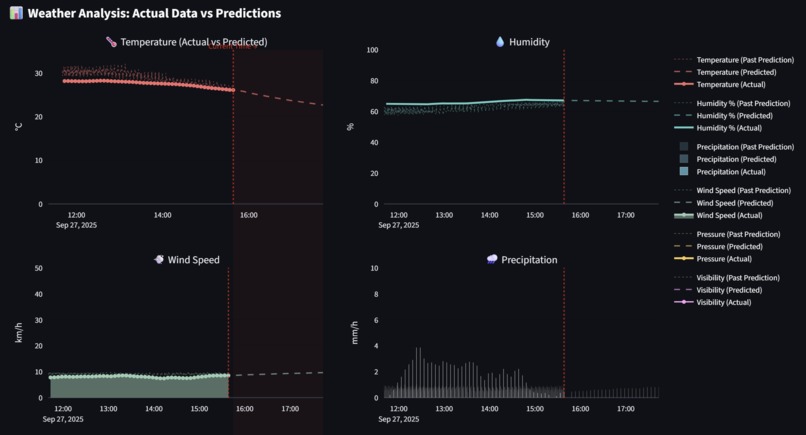
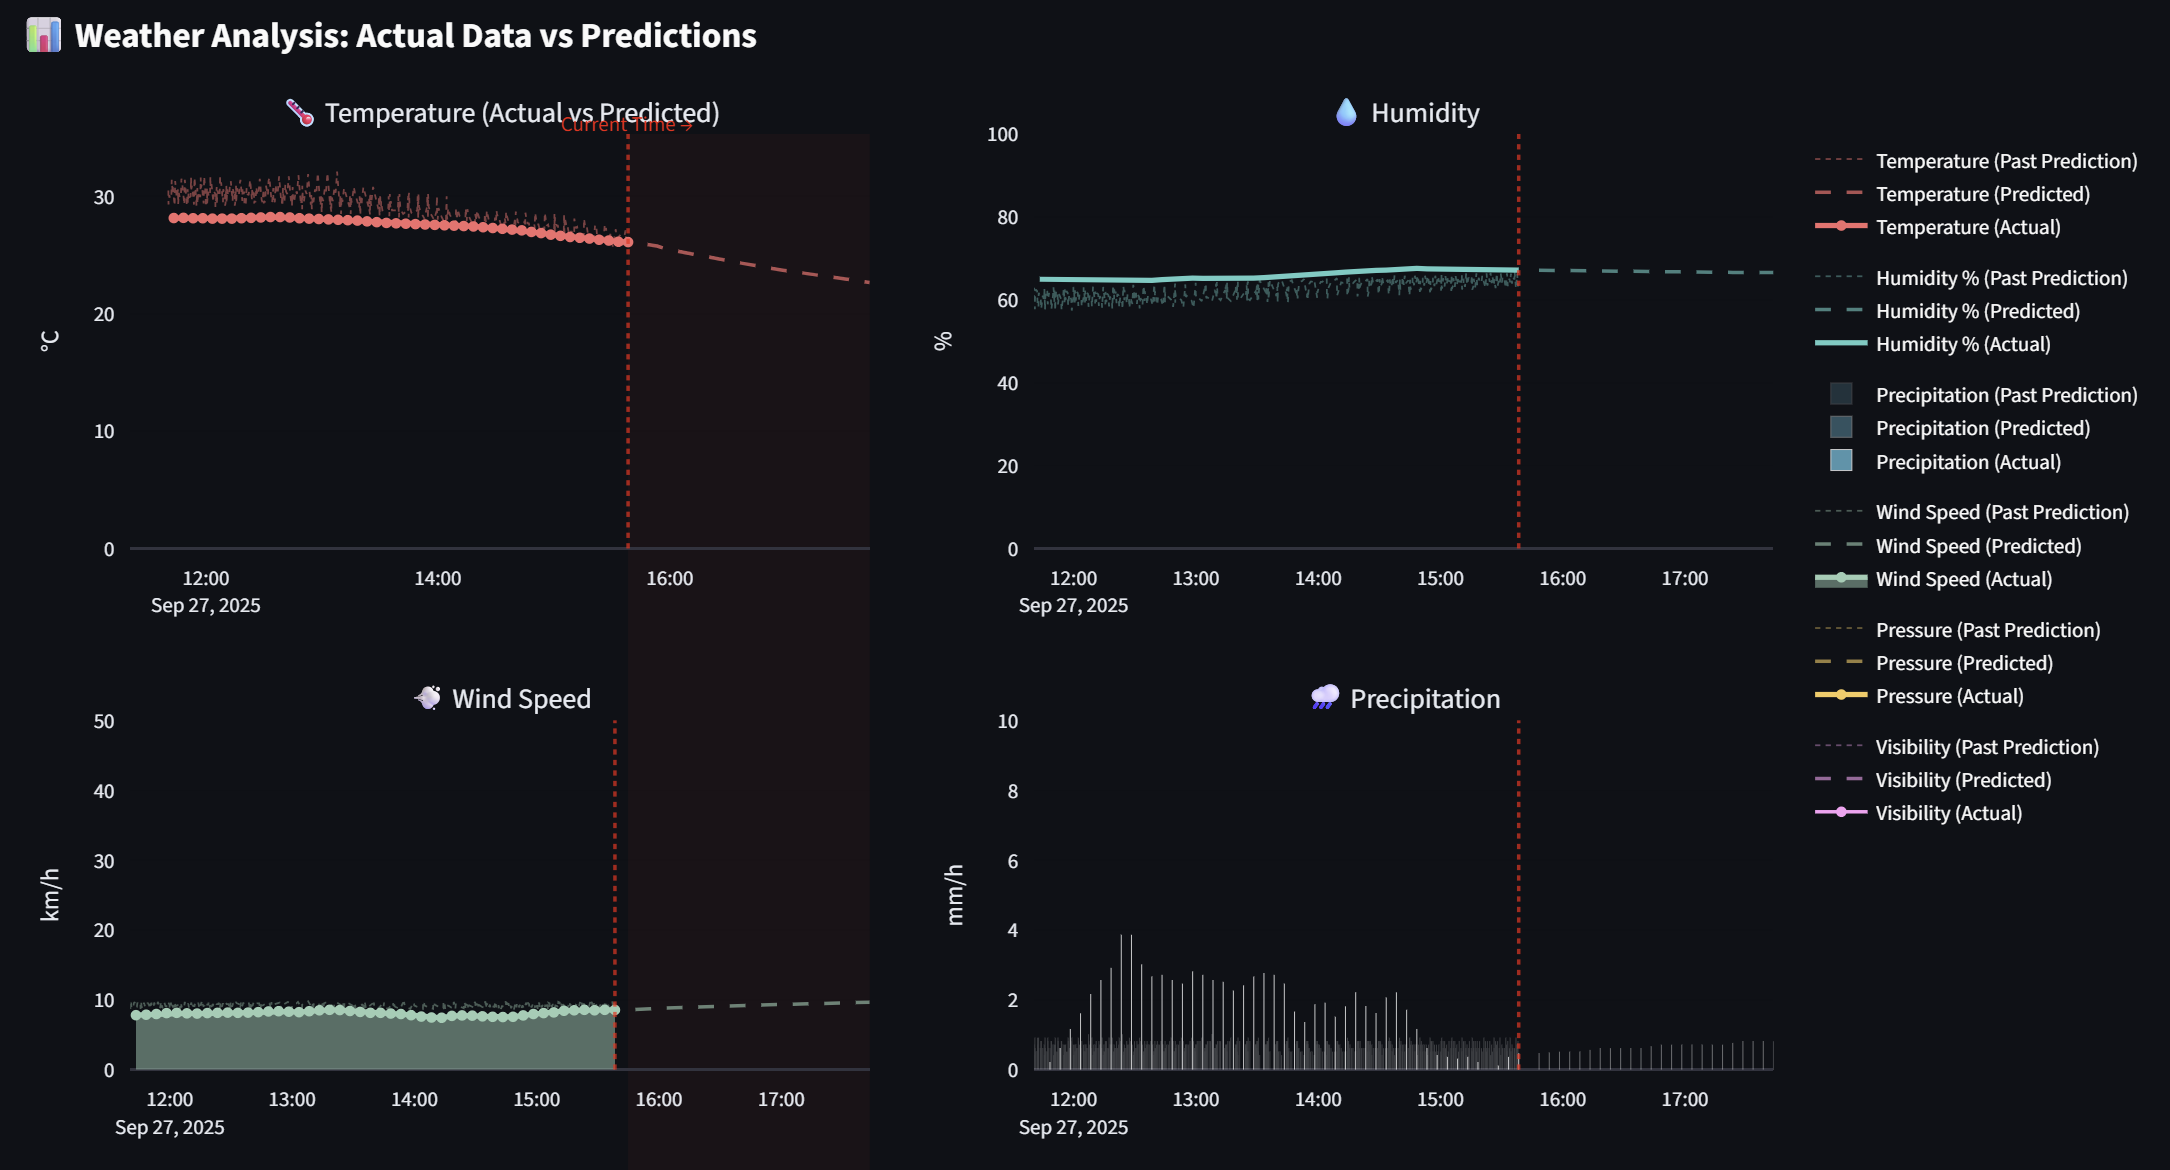
Actual & Predicted Weather Parameter Graphs

Inspiration
- Switzerland faces rapidly evolving weather extremes (heat waves, flash floods, severe storms) that demand timely, clear, and actionable intelligence.
- Emergency coordinators and the public need a single pane of glass: live conditions, short-term forecasts, and scenario-driven risk guidance.
- We aimed to blend solid data visualization with ML-driven, scenario-aware predictions to support fast, informed decisions.
What it does
- Real-time dashboard with interactive charts for temperature, humidity, wind, precipitation, pressure, and visibility.
- Emergency scenario simulator (Heat Wave, Severe Storm, Flash Flood) with accelerated time to stress-test response flows.
- Short-term (next 2 hours) ML-style forecasts with transparent comparison against past forecast runs.
- Smart alerting panel that highlights emerging risks and actionable recommendations.
- Lightweight personalization by user background (e.g., farmer, logistics, outdoor recreation) for relevant tips.
- Polished UX: unified hover, spikelines, grouped legends, forecast window shading, and optional forecast-run timestamps
How we built it
- Python + Streamlit for the web UI, Pandas/Numpy for data handling, Plotly for interactive charts.
- Scenario-aware data generator with 5-minute resolution and realistic physical constraints.
- Trend-based forecast engine that blends short/medium/long-term slopes and recent changes; scenario influence is applied carefully per parameter.
- Forecast snapshots stored in 5-minute buckets with generated_at timestamps; past predictions shown only when actuals exist for fair comparison.
- UI details: Normalization for continuity, optional hover info for past-run generation times.
- One-click Windows launcher (start_app.bat) and Docker setup for portable runs.
Challenges we ran into
- Making precipitation bars legible (overlap/opacity/width) while preserving temporal fidelity.
- Avoiding UX clutter (removed range slider; kept unified hover, spikelines).
- Ensuring fair past-vs-future comparisons: time-bucketed forecast runs, generated_at filtering, and pruning that doesn’t delete recent scenario runs.
- Managing Streamlit session state for accelerated time, reproducible historical data, and scenario switches without flicker.
- Keeping predictions realistic under scenario stress while respecting physical bounds.
Accomplishments that we're proud of
- A smooth, modern dashboard that’s demo-friendly and informative at a glance.
- Scenario-aware short-term forecasts that evolve over time, not just static “futures.”
- Transparent evaluation of past forecasts vs actuals, with optional tooltips showing forecast generation time.
- Robust, reproducible historical data generation that looks and “feels” realistic in 5-minute increments.
- Simple setup: one-click batch script on Windows and Docker support.
What we learned
- Transparent forecasting (time-bucketed snapshots, no hindsight) builds trust and is crucial for real operations.
- Small UX tweaks (unified hover, legend grouping, spikelines) dramatically improve interpretability.
- Streamlit session state orchestration is key to smooth simulations and consistent data pipelines.
What's next for Swiss Weather Intelligence System
- Integrate live data sources (e.g., MeteoSwiss/Open-Meteo) and add map overlays for regional insights.
- Upgrade the forecast engine with trained models (Prophet/LSTM/Ensembles) and probabilistic outputs.
- Persistent storage (SQLite/Postgres) for historical runs, accuracy tracking, and backtesting.
- Alert delivery channels (email/SMS/webhooks) and role-based dashboards for agencies and the public.
- Mobile-friendly layout, accessibility improvements, and multi-location monitoring.
- Deeper anomaly detection and early-warning analytics (multi-sensor fusion, confidence intervals).


Log in or sign up for Devpost to join the conversation.