-
-
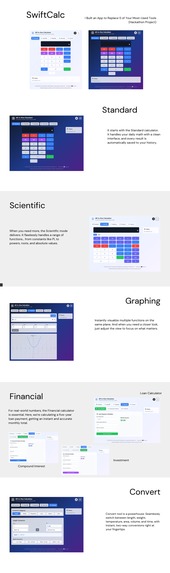
SwiftCalc - The All-in-One Calculator professional calculator suite for all your needs
Inspiration
The inspiration for Swift Calc came from a simple, everyday frustration: app clutter. As a student, my workflow was constantly interrupted by the need to switch between different tools. I'd have a tab open for a standard calculator, another for a graphing tool like Desmos, a third for a Google search to convert kilograms to pounds, and a fourth for a loan calculator when helping a friend with their finances. Each tool had a different interface, and the context switching was inefficient.
I envisioned a single, unified application that could do it all—a "Swiss Army knife" for calculations. The goal wasn't just to combine these tools, but to create a seamless, intuitive, and aesthetically pleasing experience that felt like one cohesive product. This hackathon was the perfect opportunity to turn that vision into a reality.
What it does
Swift Calc is a responsive, multi-mode, all-in-one calculator suite built for the web. It consolidates five distinct, high-utility tools into a single, clean interface:
- Standard Calculator: For quick, everyday arithmetic with a persistent history log.
- Scientific Calculator: Handles complex mathematical expressions, including trigonometric 3. functions, logarithms, powers, roots, and constants.
- Graphing Calculator: Allows users to plot multiple 2D functions on a dynamic chart, complete with customizable colors.
- Financial Calculator: Provides practical tools for real-world financial planning, starting with a powerful Loan Payment Calculator.
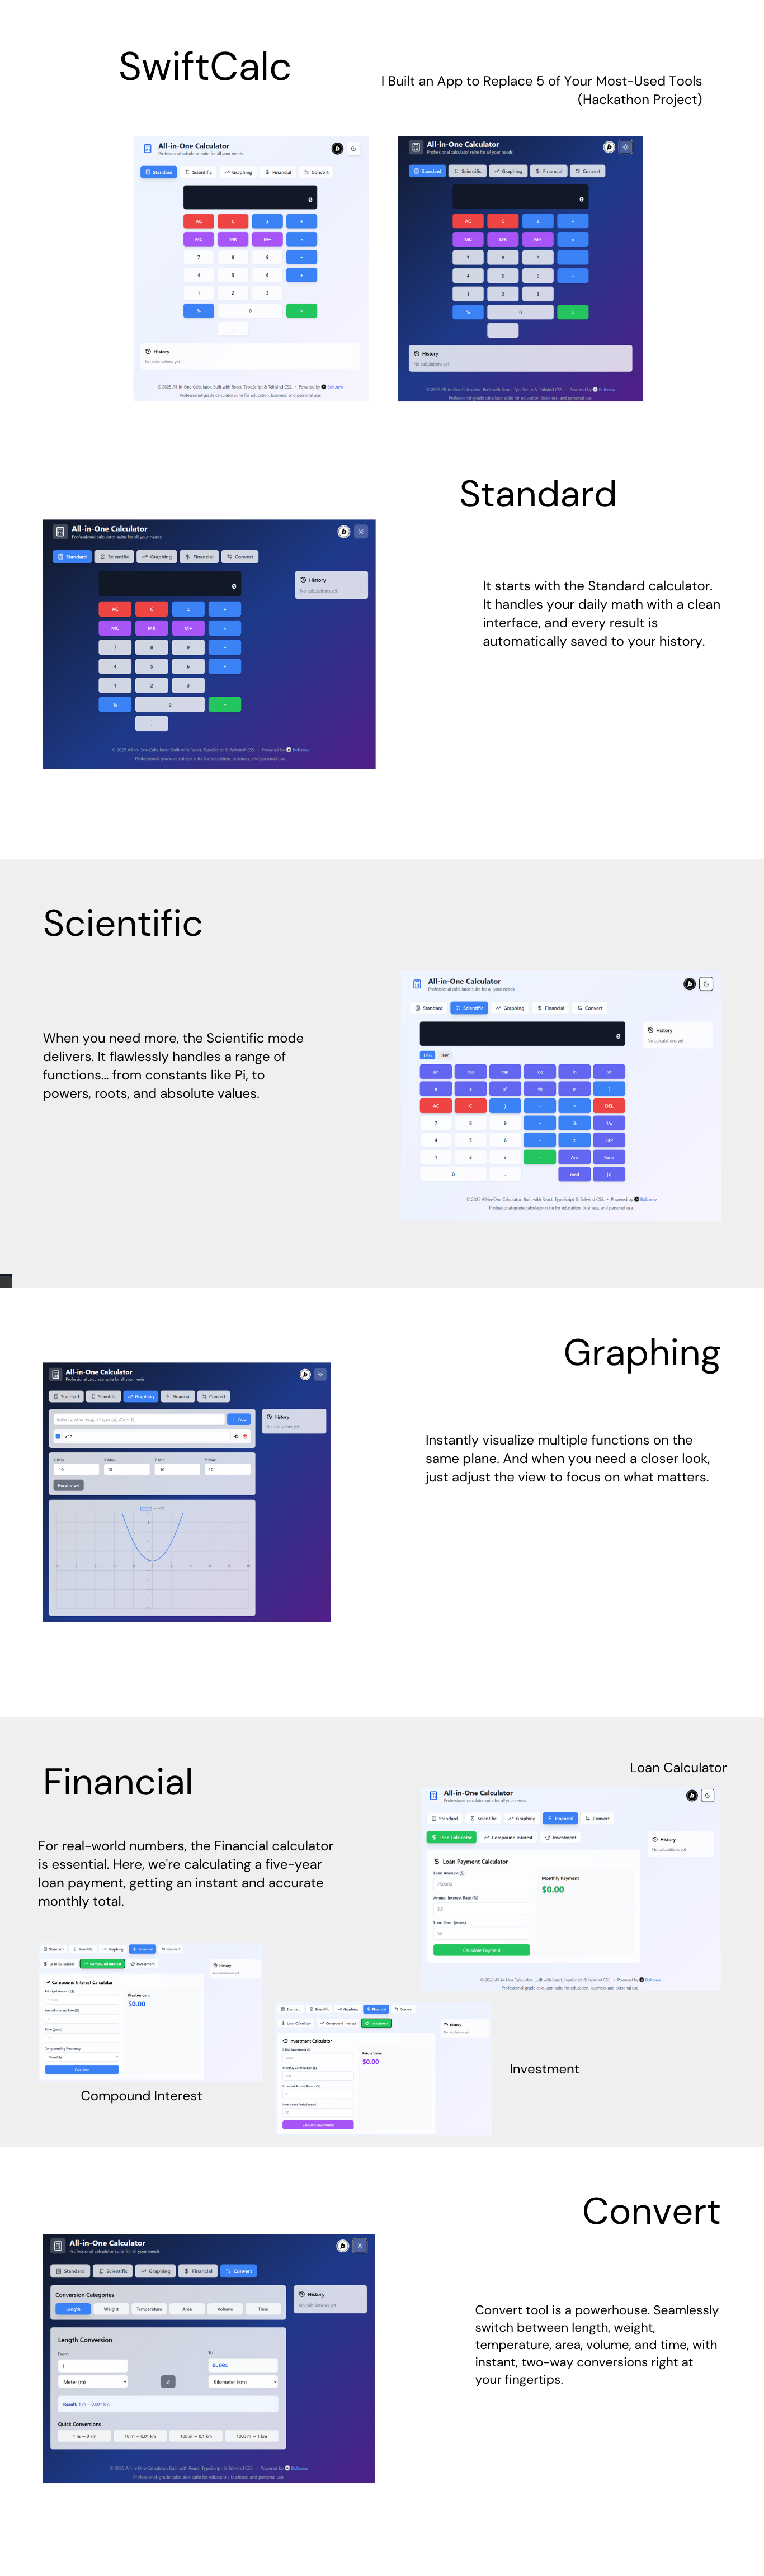
- Conversion Calculator: Offers seamless, real-time unit conversions across six common categories: Length, Weight, Temperature, Area, Volume, and Time.
It’s designed to be the only calculator a student, professional, or curious individual will ever need to keep open in their browser.
How I built it
Swift Calc was born from a unique and powerful collaboration between human vision and artificial intelligence, all driven by a single, comprehensive prompt.
My role was that of an architect and project lead. Instead of writing every line of code from scratch, I crafted a detailed engineering brief that outlined the entire application. This prompt specified:
- The five distinct calculator modes and their core features.
- Implementation suggestions, like using Math.js for scientific calculations and Chart.js for graphing.
- Key UI/UX considerations, such as the tabbed navigation and responsive design.
- The full tech stack and even the deployment strategy.
This is roughly the prompt that I submitted:
All-in-One Calculator Web App A responsive, multi-mode calculator with Standard, Scientific, Graphing, Financial, and Conversion functionalities.
Standard Calculator Features: Basic operations: +, -, *, / Memory functions: M+, M-, MR, MC Percentage (%), sign toggle (±), clear (C, AC) Decimal support
Implementation:
const [display, setDisplay] = useState("0");
const [memory, setMemory] = useState(0);

const handleButtonClick = (value) => {
  switch (value) {
    case "C": setDisplay("0"); break;
    case "M+": setMemory(memory + parseFloat(display)); break;
    case "MR": setDisplay(memory.toString()); break;
    default: setDisplay(prev => prev === "0" ? value : prev + value);
  }
};
Scientific Calculator Features: Trigonometry: sin, cos, tan, asin, acos, atan Logarithms: log, ln, exp Powers & Roots: x², √x, x^y, 10^x Constants: π, e Parentheses & advanced operators
Implementation: Use Math.js for complex expressions:
import { evaluate } from 'mathjs';

const calculateScientific = (expression) => {
  try {
    return evaluate(expression); // e.g., "sin(pi/2) + 2^3" → 9
  } catch (error) {
    return "Error";
  }
};
Graphing Calculator Features: 2D Function Plotting: y = x^2, sin(x) Zoom/Pan Multiple Graphs (different colors) Intersection Finder
Implementation: Use Chart.js or D3.js for rendering:
const plotGraph = (equation) => {
  const xValues = [-10, -9, ..., 10];
  const yValues = xValues.map(x => evaluate(equation.replace(/x/g, x)));

  new Chart(ctx, {
    type: 'line',
    data: { labels: xValues, datasets: [{ data: yValues }] }
  });
};
Financial Calculator Features: Loan Calculator (PMT, FV, PV) Compound Interest Amortization Schedule Investment Returns (ROI)
Implementation: Use finance.js or custom formulas:
const calculatePMT = (principal, rate, years) => {
  const r = rate / 12 / 100;
  const n = years * 12;
  return principal * r * Math.pow(1 + r, n) / (Math.pow(1 + r, n) - 1);
};
Conversion Calculator Features: Unit Types: Length, Weight, Temperature, Currency Dynamic Dropdowns (e.g., "kg → lbs") Real-time API for Currency (optional)
Implementation: Use convert-units or a lookup table:
const conversions = {
  length: { "m": 1, "ft": 3.28084 },
  weight: { "kg": 1, "lb": 2.20462 }
};

const convert = (value, fromUnit, toUnit, category) => {
  return value * conversions[category][toUnit] / conversions[category][fromUnit];
};
UI/UX Considerations Mode Switcher: Tabs or dropdown to switch between calculator types. Responsive Layout: Works on mobile (use grid for buttons). History Tape: Display past calculations. Dark/Light Mode (CSS variables).
Deployment, Build with npm run build, Deploy to Netlify
With this blueprint, a generative AI partner scaffolded the initial application using the specified technologies: React, TypeScript, and Tailwind CSS.
The final, refined application was then deployed using Netlify, completing the rapid development cycle from a single, detailed prompt to a live, functional product.
Accomplishments that I'm proud of
I'm incredibly proud of building a functional, feature-rich application with five distinct modes as a solo developer in such a short period. The fact that all five tools work harmoniously within a single, polished UI is the biggest accomplishment.
Specifically, the graphing calculator was a major win. Getting multiple functions to plot with different colors and implementing a dynamic view that responds to user input felt like a huge step up from a simple calculation tool. I'm also proud of the clean, responsive design that looks and works great on both desktop and mobile.
What I learned
This project was a massive learning experience in front-end architecture and project management.
The Power of Modular Components: Breaking down each calculator into its own set of components was the only way this project was feasible. It reinforced the importance of planning your component tree before writing a single line of code.
State Management is Key: I gained a much deeper appreciation for robust state management. Using React's useState and useContext effectively was crucial for keeping the application's logic sane.
Don't Reinvent the Wheel: Integrating libraries like Math.js and Chart.js saved countless hours and resulted in a far more powerful and reliable final product. Knowing when to build from scratch and when to leverage existing tools is a vital skill.
What's next for Swift Calc
While this hackathon version is a complete product, there's always room for growth! My vision for the future of Swift Calc includes:
- Expanded Financial Tools: Adding calculators for Compound Interest, Investment ROI, and Amortization Schedules.
- Currency Conversion: Integrating a real-time exchange rate API into the Conversion tab.
- Graphing Enhancements: Adding features like finding intersections, derivatives, and integrals directly on the graph. In addition, there are some bugs example with the sin and cos, to name a few.
- User Accounts & Saved History: Allowing users to create accounts to save their calculation history and favorite functions across sessions.
- Dark/Light Mode Persistence: Saving the user's theme preference in local storage.
Built With
- chart.js
- math.js
- netlify
- react
- tailwind-css
- typescript
- vite

Log in or sign up for Devpost to join the conversation.