-
-
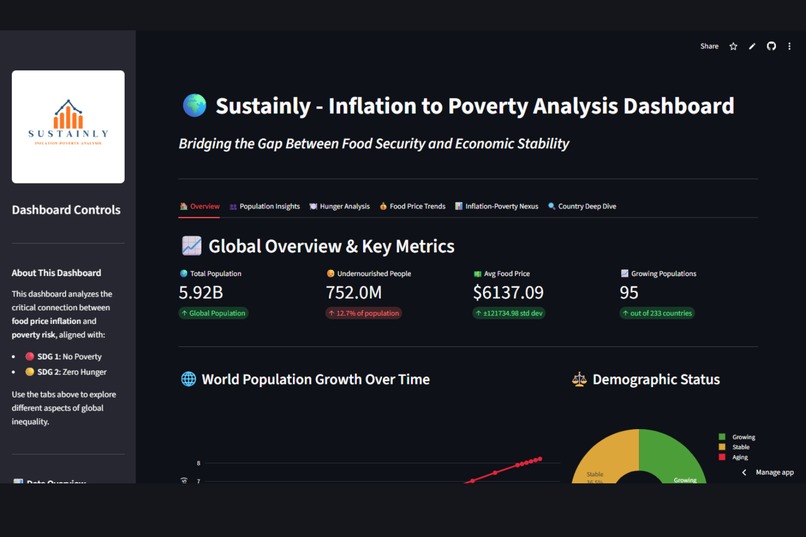
Dashboard Overview & Metrics
-
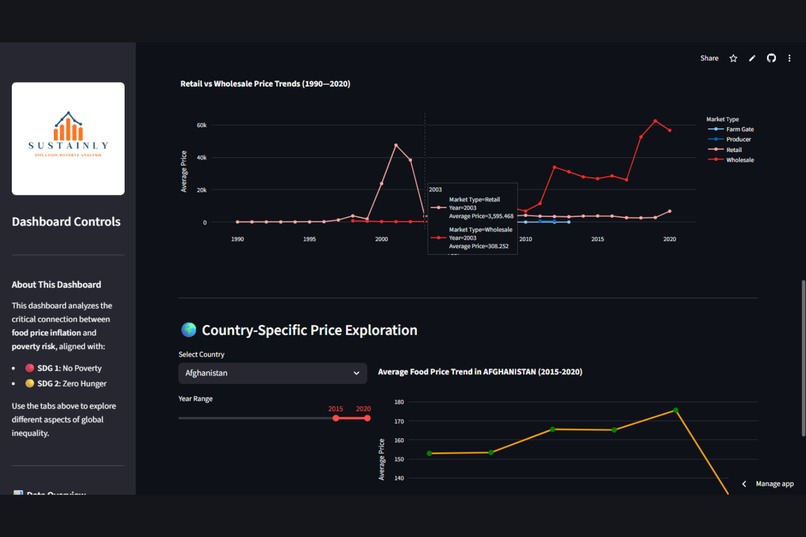
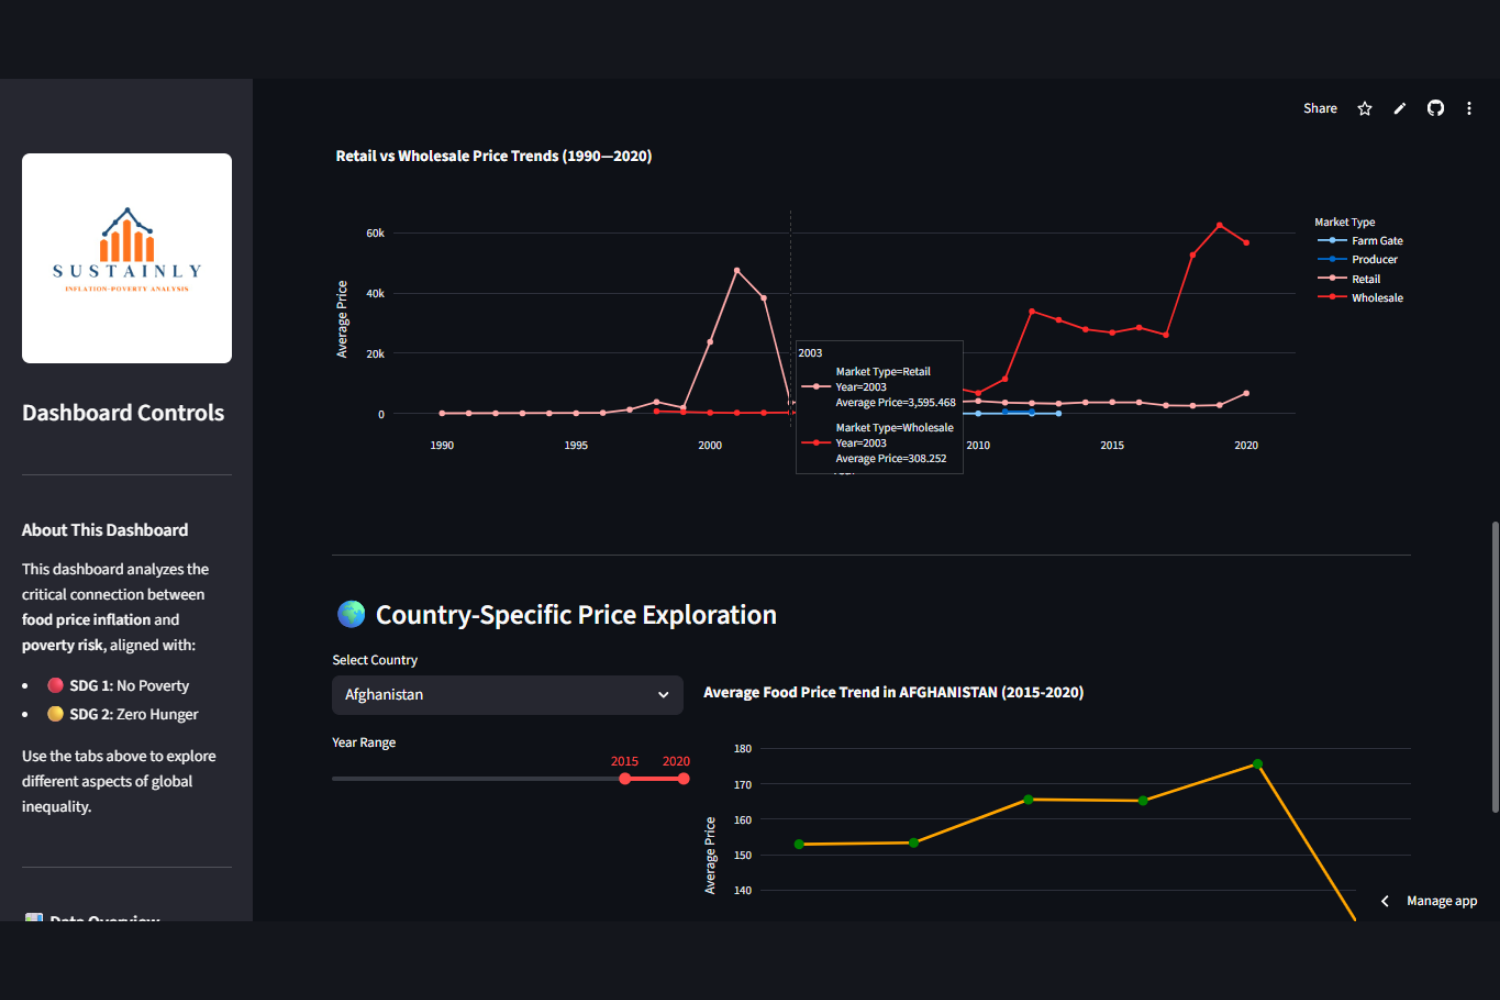
Food Price Trends
-
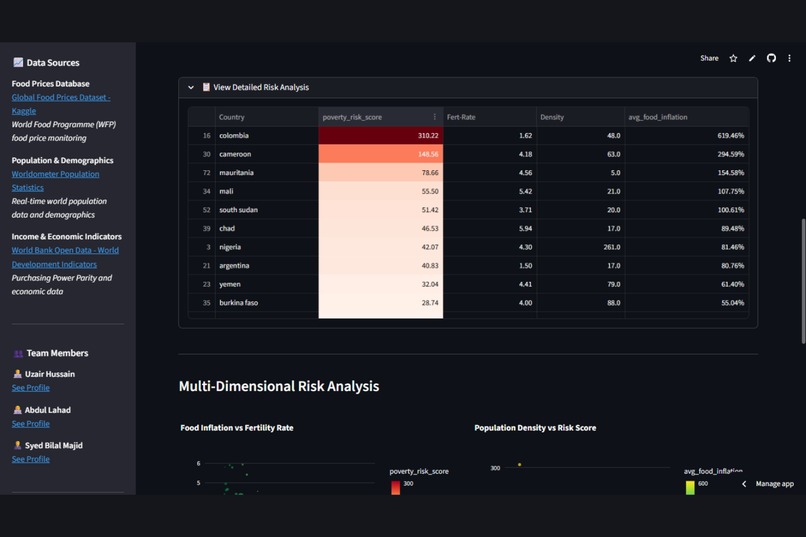
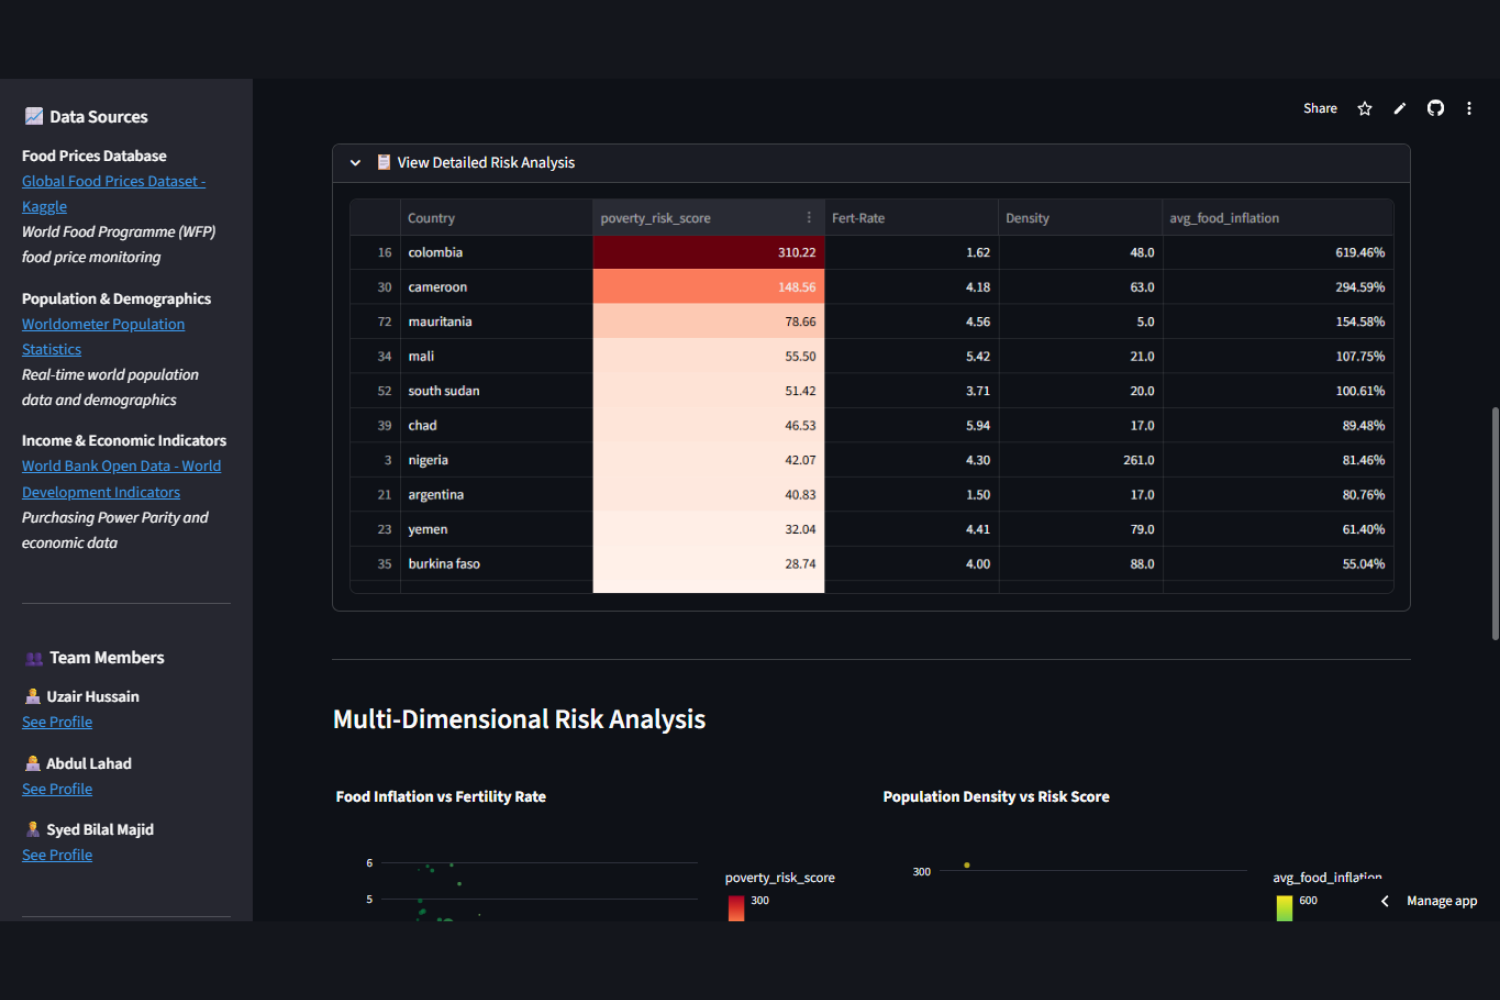
Poverty Risk Score Analysis
-
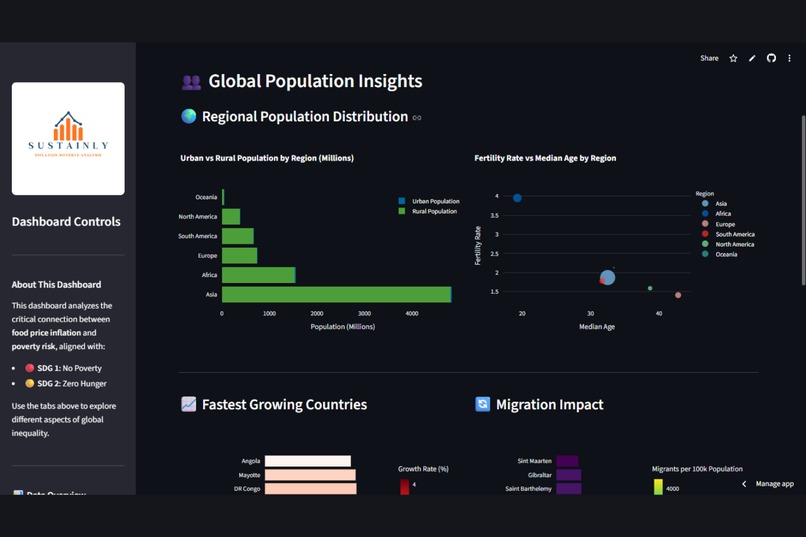
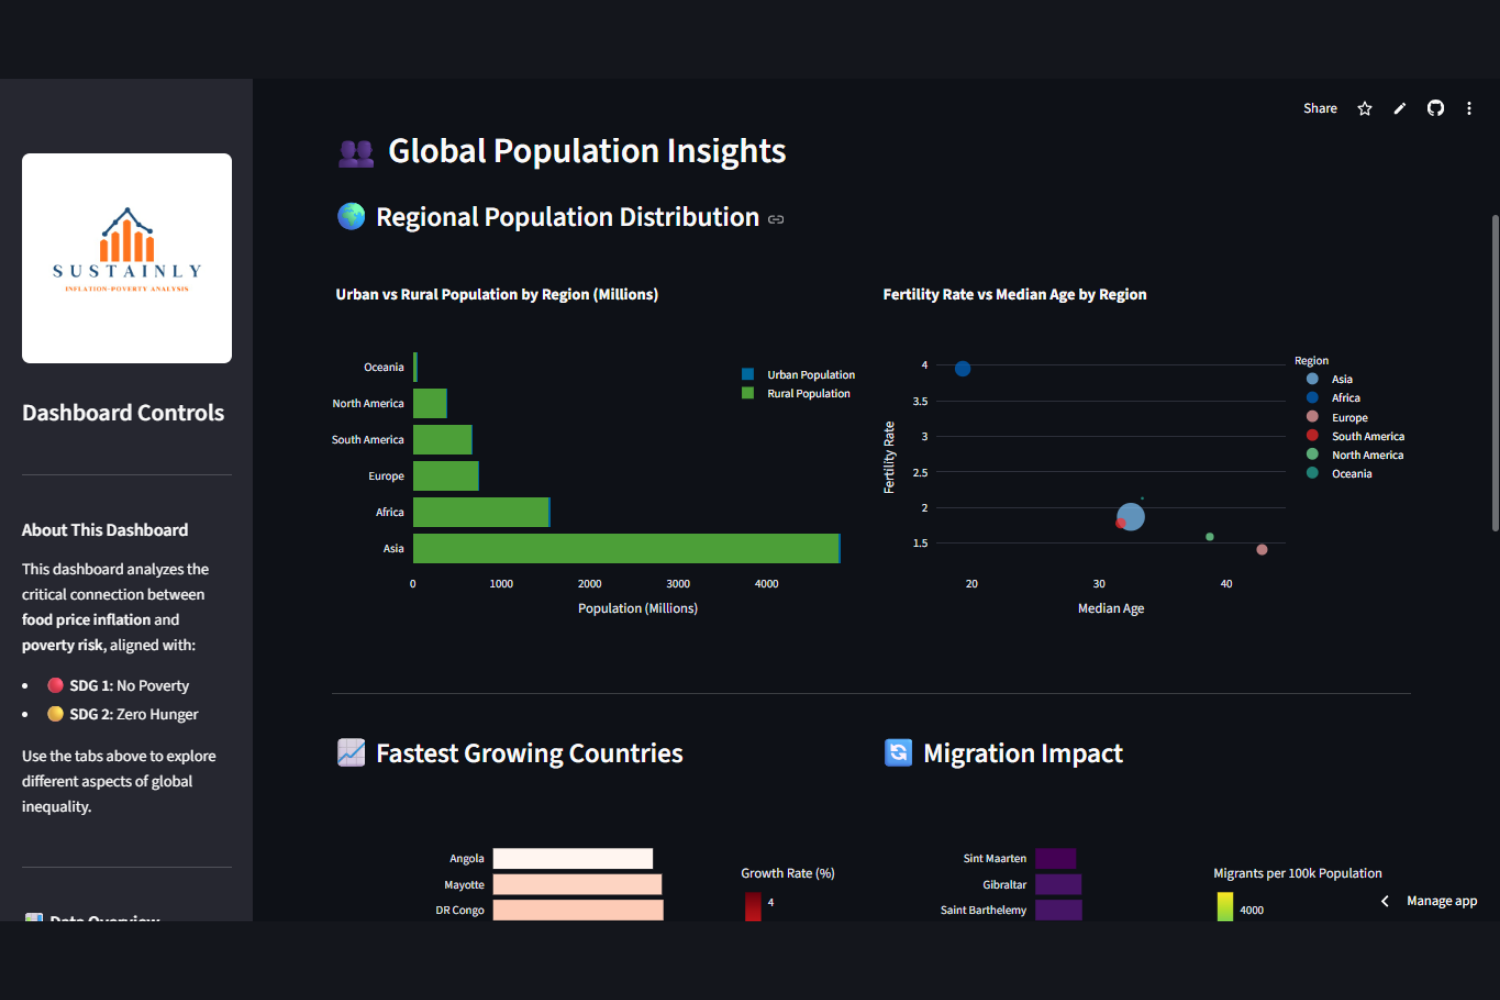
Regional Demographics Analysis
-
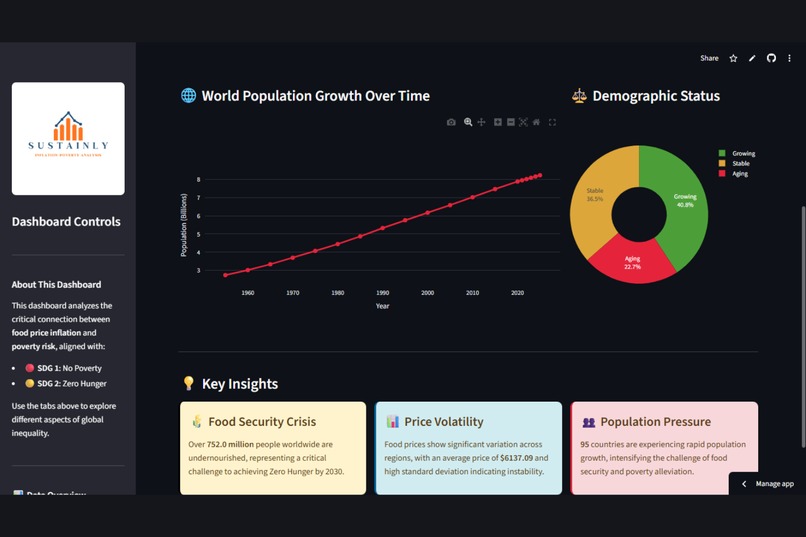
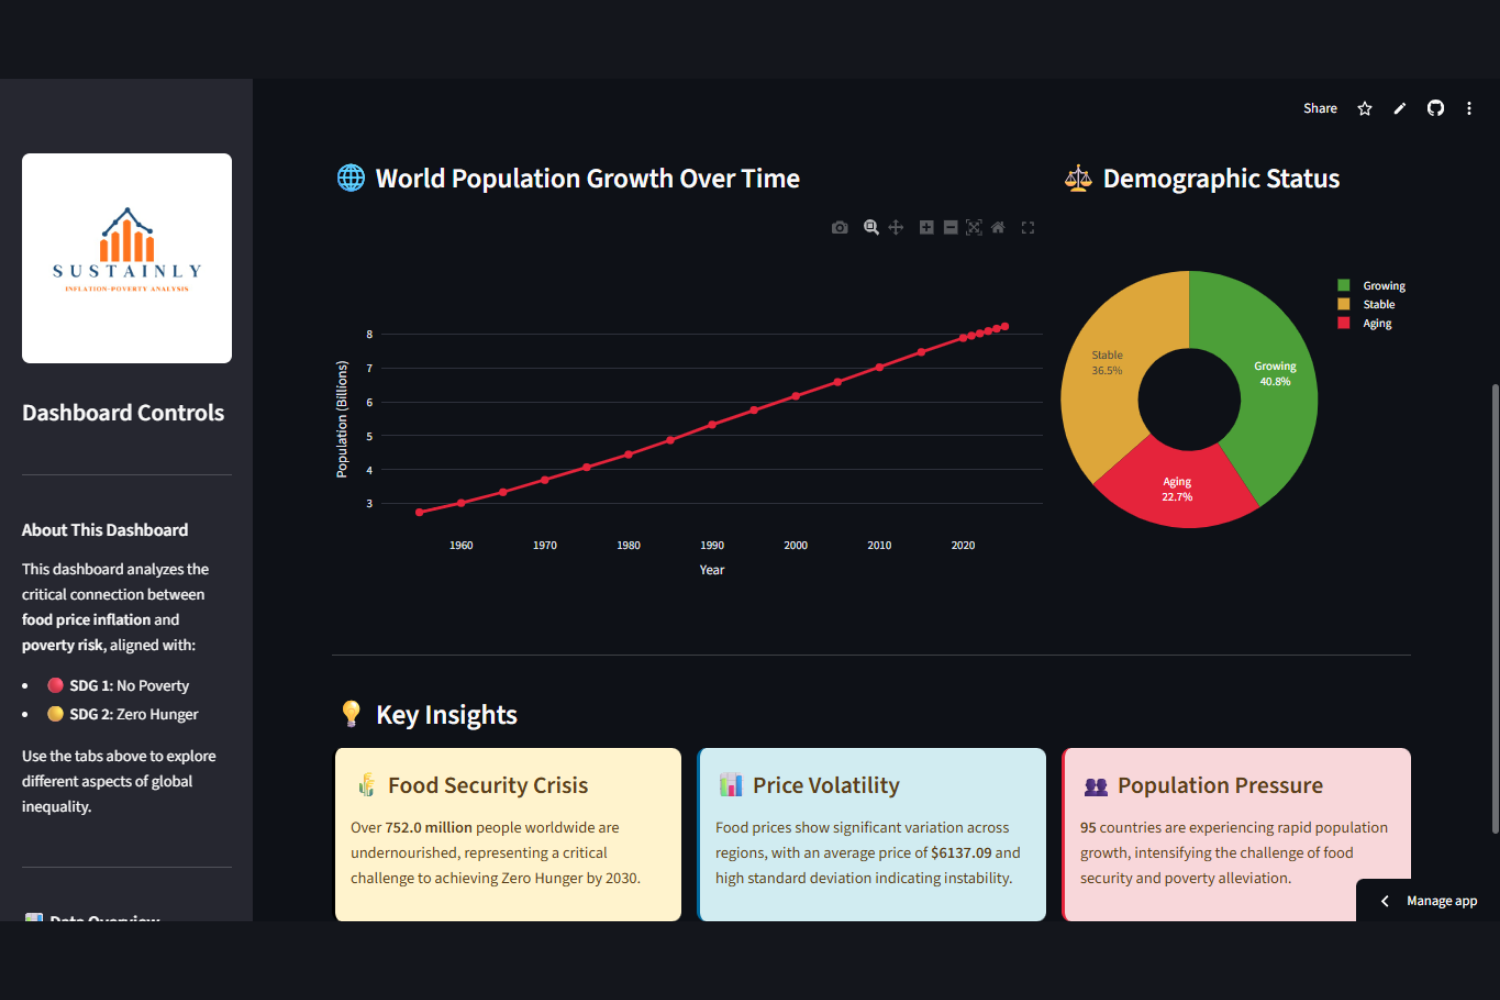
Population Growth & Insights
-
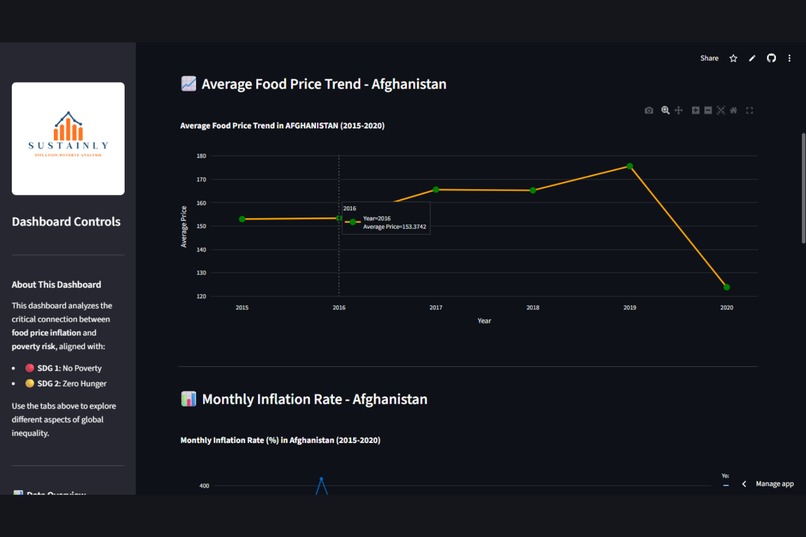
Country-Specific Deep Dive
-
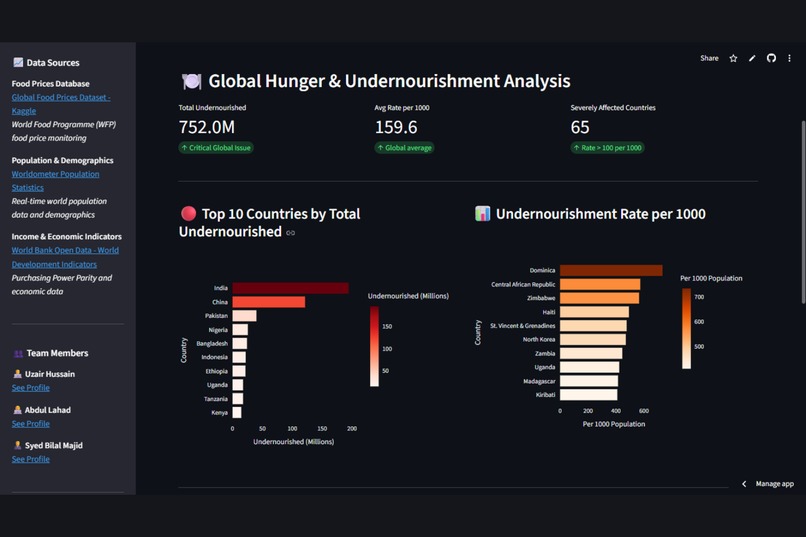
Undernourishment Hotspot Mapping
Inspiration
Our inspiration for Sustainly came from observing how rising food prices and population growth silently intensify poverty and hunger in many parts of the world. While inflation statistics are widely reported, their real impact on purchasing power and access to food is often invisible to the public and policymakers. We wanted to bridge that gap by creating a tool that makes these relationships clear and measurable, supporting smarter, faster decisions toward achieving the United Nations Sustainable Development Goals 1 and 2 — No Poverty and Zero Hunger.
What it does
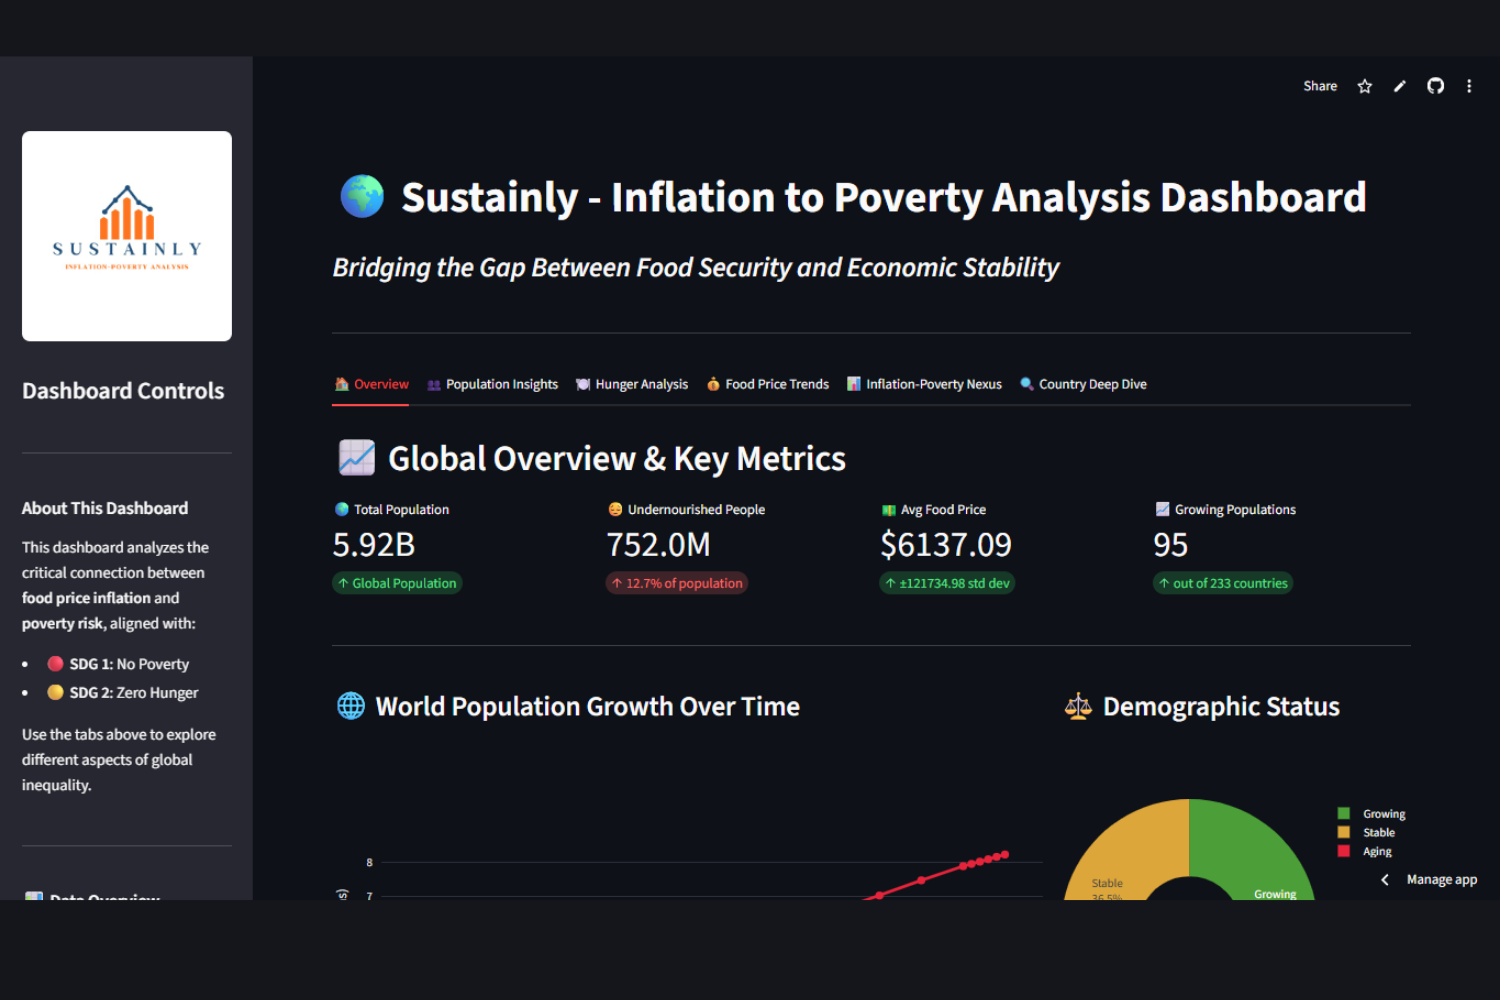
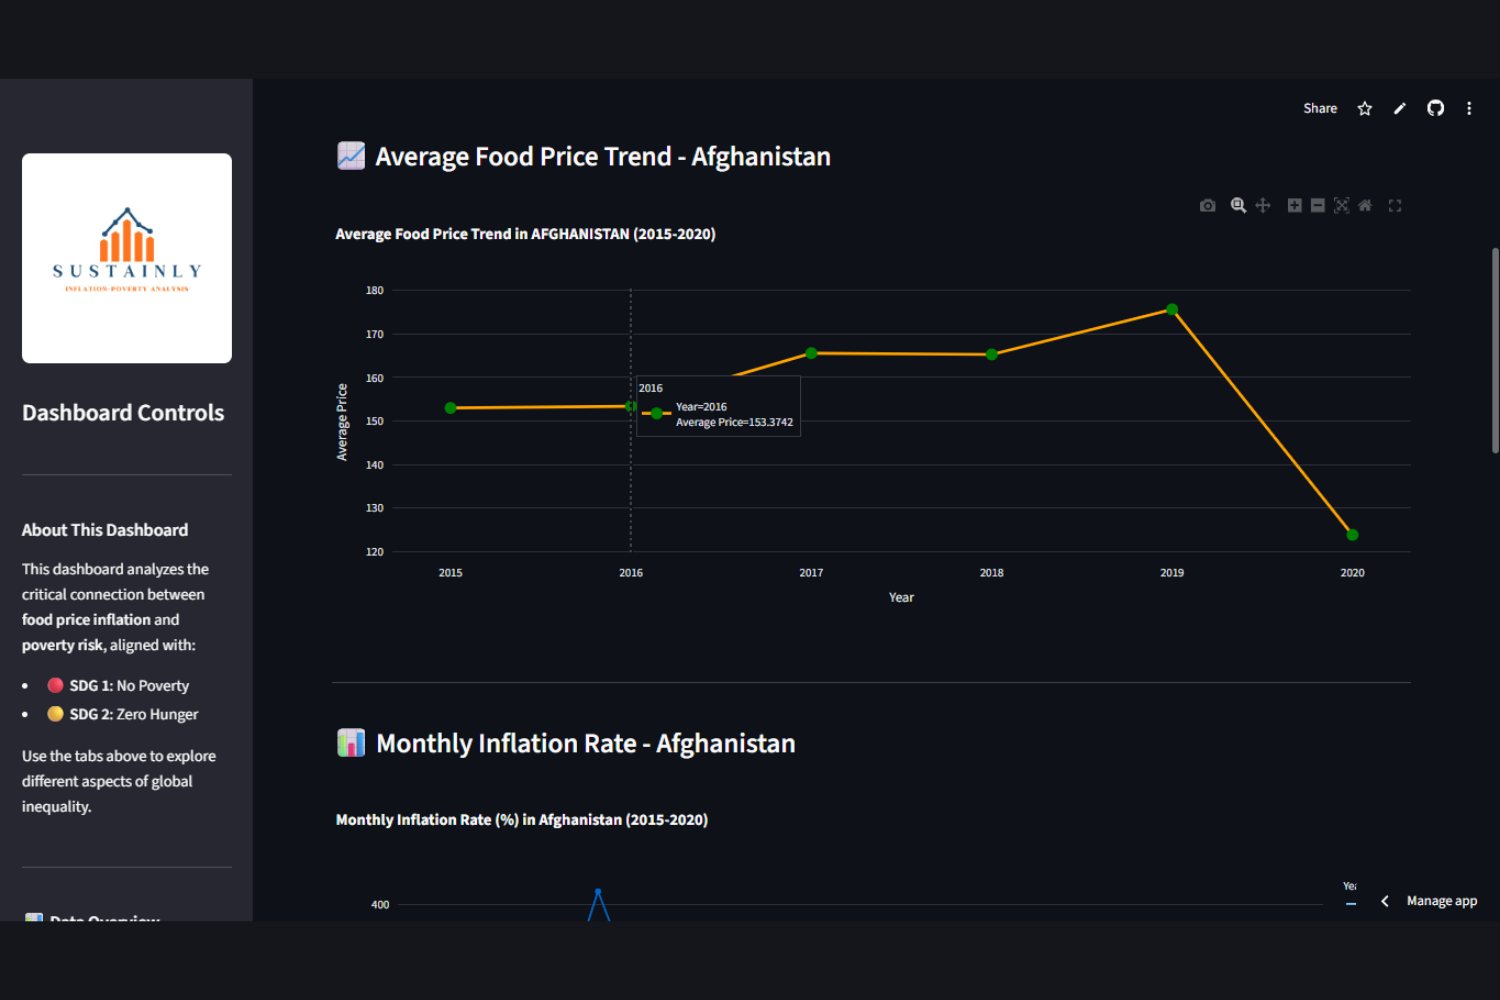
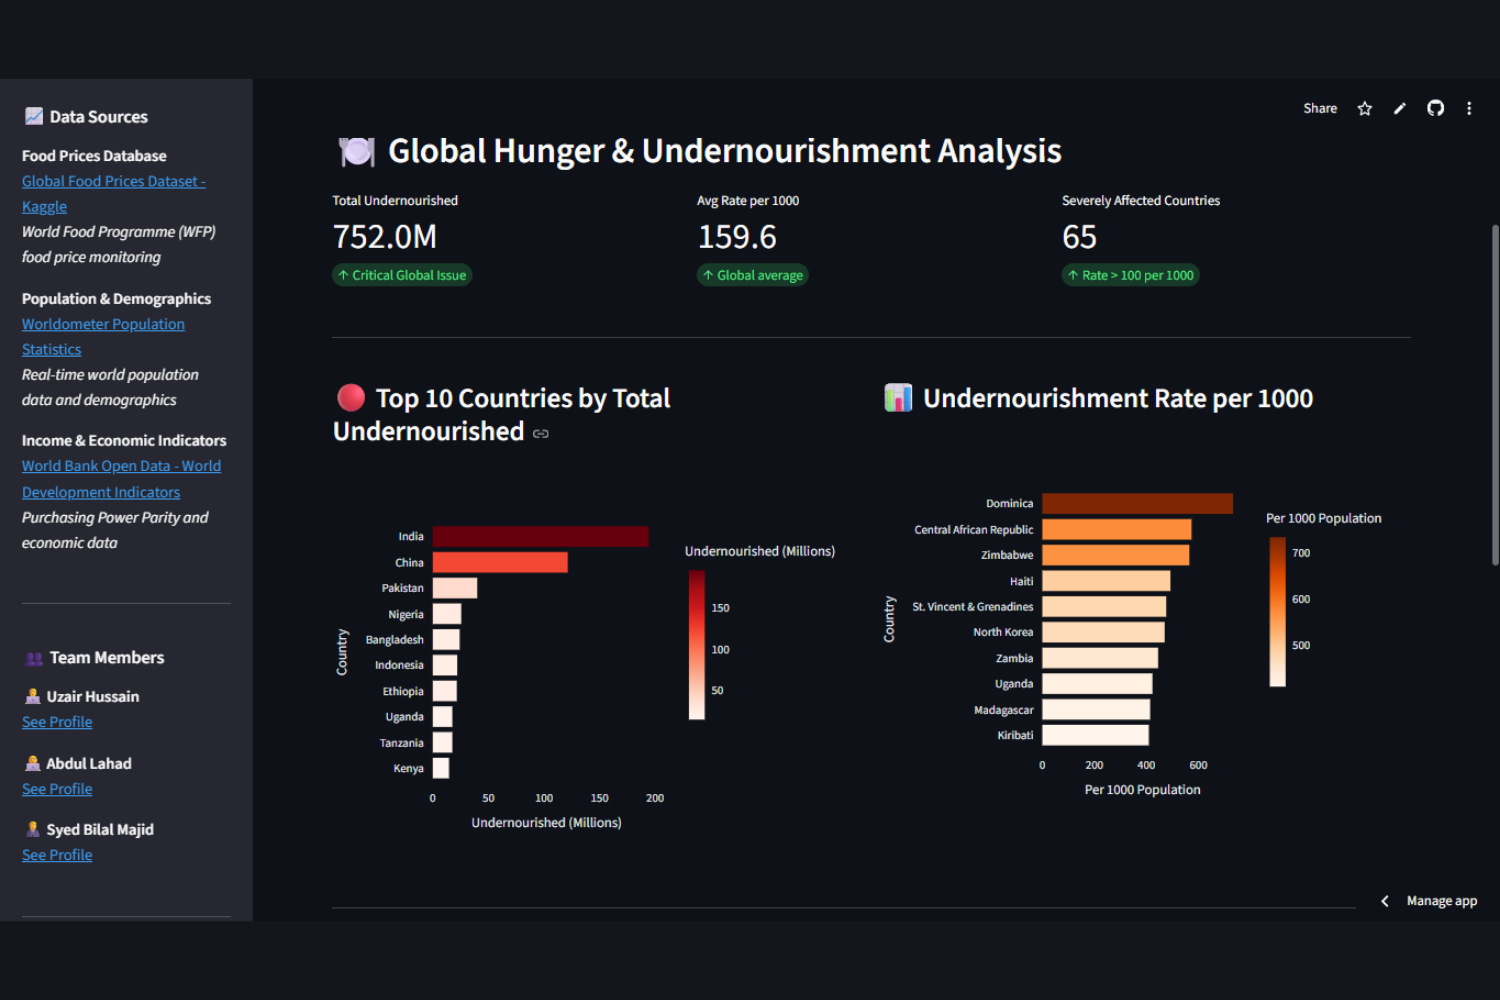
Sustainly is an interactive, data-driven dashboard that visualizes the connection between food price inflation, population growth, and purchasing power. It allows users to explore how these factors combine to affect poverty and hunger risks across different countries. The platform includes a Poverty Risk Score, which highlights regions most vulnerable to inflation-driven poverty, and provides visual analytics on undernourishment, income disparity, and affordability trends. By turning complex datasets into accessible visuals, Sustainly empowers policymakers, researchers, and humanitarian organizations to act based on real data rather than assumptions. Sustainly visualizes how food price inflation, population dynamics, and purchasing power combine to shape global poverty risks. It features a Poverty Risk Score highlighting vulnerable regions, and Food Purchasing Power Index (FPPI) to assess affordability. By translating complex datasets into clear visuals, Sustainly equips policymakers, researchers, and humanitarian organizations with the insights they need to take data-driven action against poverty.
How we built it
We built Sustainly using Streamlit for the interactive interface and Python libraries such as Pandas, Plotly, Matplotlib, and Seaborn for data processing and visualization. The project integrates datasets from the World Food Programme, World Bank, and Worldometer, all of which were cleaned, merged, and normalized using cloud-based storage on AWS S3. We designed a model to compute key indicators, such as the Food Purchasing Power Index (FPPI) and Poverty Risk Score, allowing real-time insights into affordability and economic vulnerability. The system architecture was designed for scalability and reliability, ensuring smooth performance even with large global datasets.
Challenges we ran into
One of our biggest challenges was data integration — each dataset came in a different structure and format, with missing values, inconsistent naming conventions, and time lags between reporting years. Aligning them into a single analytical model that could accurately represent real-world dynamics required significant effort in data cleaning, normalization, and correlation mapping. Another challenge was building an interface that balances technical depth with usability, ensuring the dashboard remains simple enough for general audiences while offering meaningful analytics for researchers and policymakers. Overcoming these challenges strengthened our skills in data engineering, visualization, and storytelling.
Accomplishments that we're proud of
We are proud to have developed a functional, interactive dashboard that connects inflation, income, and food access in one integrated view. Creating a quantitative Poverty Risk Score that reflects real-world vulnerabilities is one of our proudest technical accomplishments. It demonstrates how data can be used not just to analyze, but to inform real policy decisions. We are also proud of how Sustainly aligns with global goals, offering a scalable solution for understanding and reducing poverty through better access to information. This project reflects our commitment to using technology for social impact and sustainable development. We’re proud to have built a working interactive dashboard connecting inflation, income, and food access in one unified view. Our Poverty Risk Score is a novel metric that quantifies economic vulnerability across countries. Most importantly, Sustainly reflects our belief that data transparency can drive social change, aligning technology with sustainable development goals.
What we learned
Through this project, we learned the power of data storytelling, how large volumes of raw information can be transformed into meaningful, actionable insights. We deepened our understanding of economic indicators, data modeling, and global development metrics, particularly how food inflation interacts with purchasing power and hunger rates. We also learned how to handle and visualize multi-source datasets effectively and the importance of designing clear, evidence-based tools that can communicate complex issues in simple, interactive ways. The process reinforced how impactful data-driven innovation can be in addressing real-world inequalities. This project taught us how to convert complex economic data into understandable, visual insights, reinforcing that data science can be a bridge between awareness and action.
What's next for Sustainly
Our next goal is to expand Sustainly beyond static analysis and make it predictive. We plan to integrate real-time global data feeds and add AI-based forecasting models to predict future poverty risks under different inflation and income scenarios. Additionally, we aim to collaborate with NGOs, governments, and research institutions to help them use Sustainly in real policy design and intervention planning. We also plan to introduce a policy simulation tool that allows users to visualize the potential effects of subsidies, inflation control measures, and income growth on poverty outcomes. Ultimately, Sustainly will continue to evolve as a platform for data transparency, global awareness, and social good.

Log in or sign up for Devpost to join the conversation.