-
-
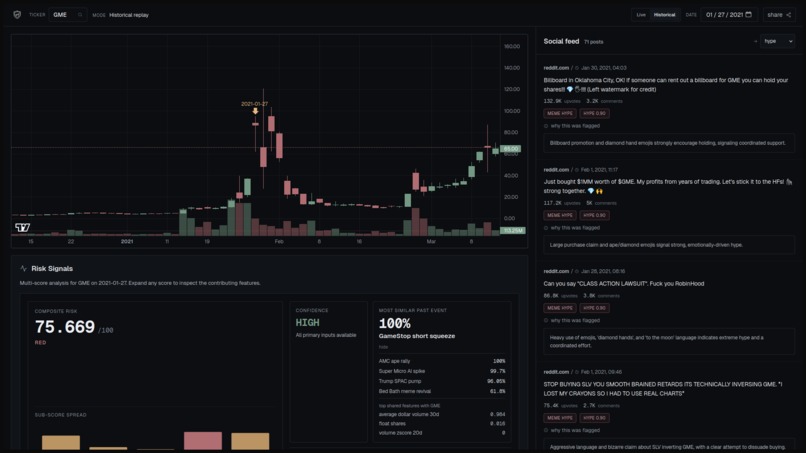
Main Page
-
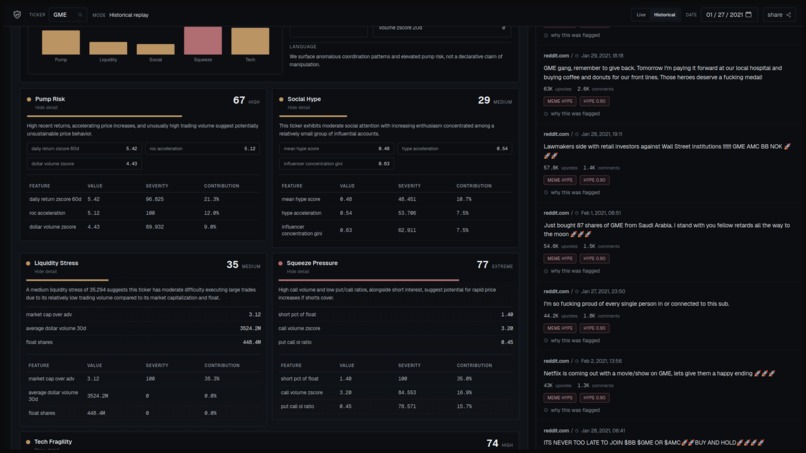
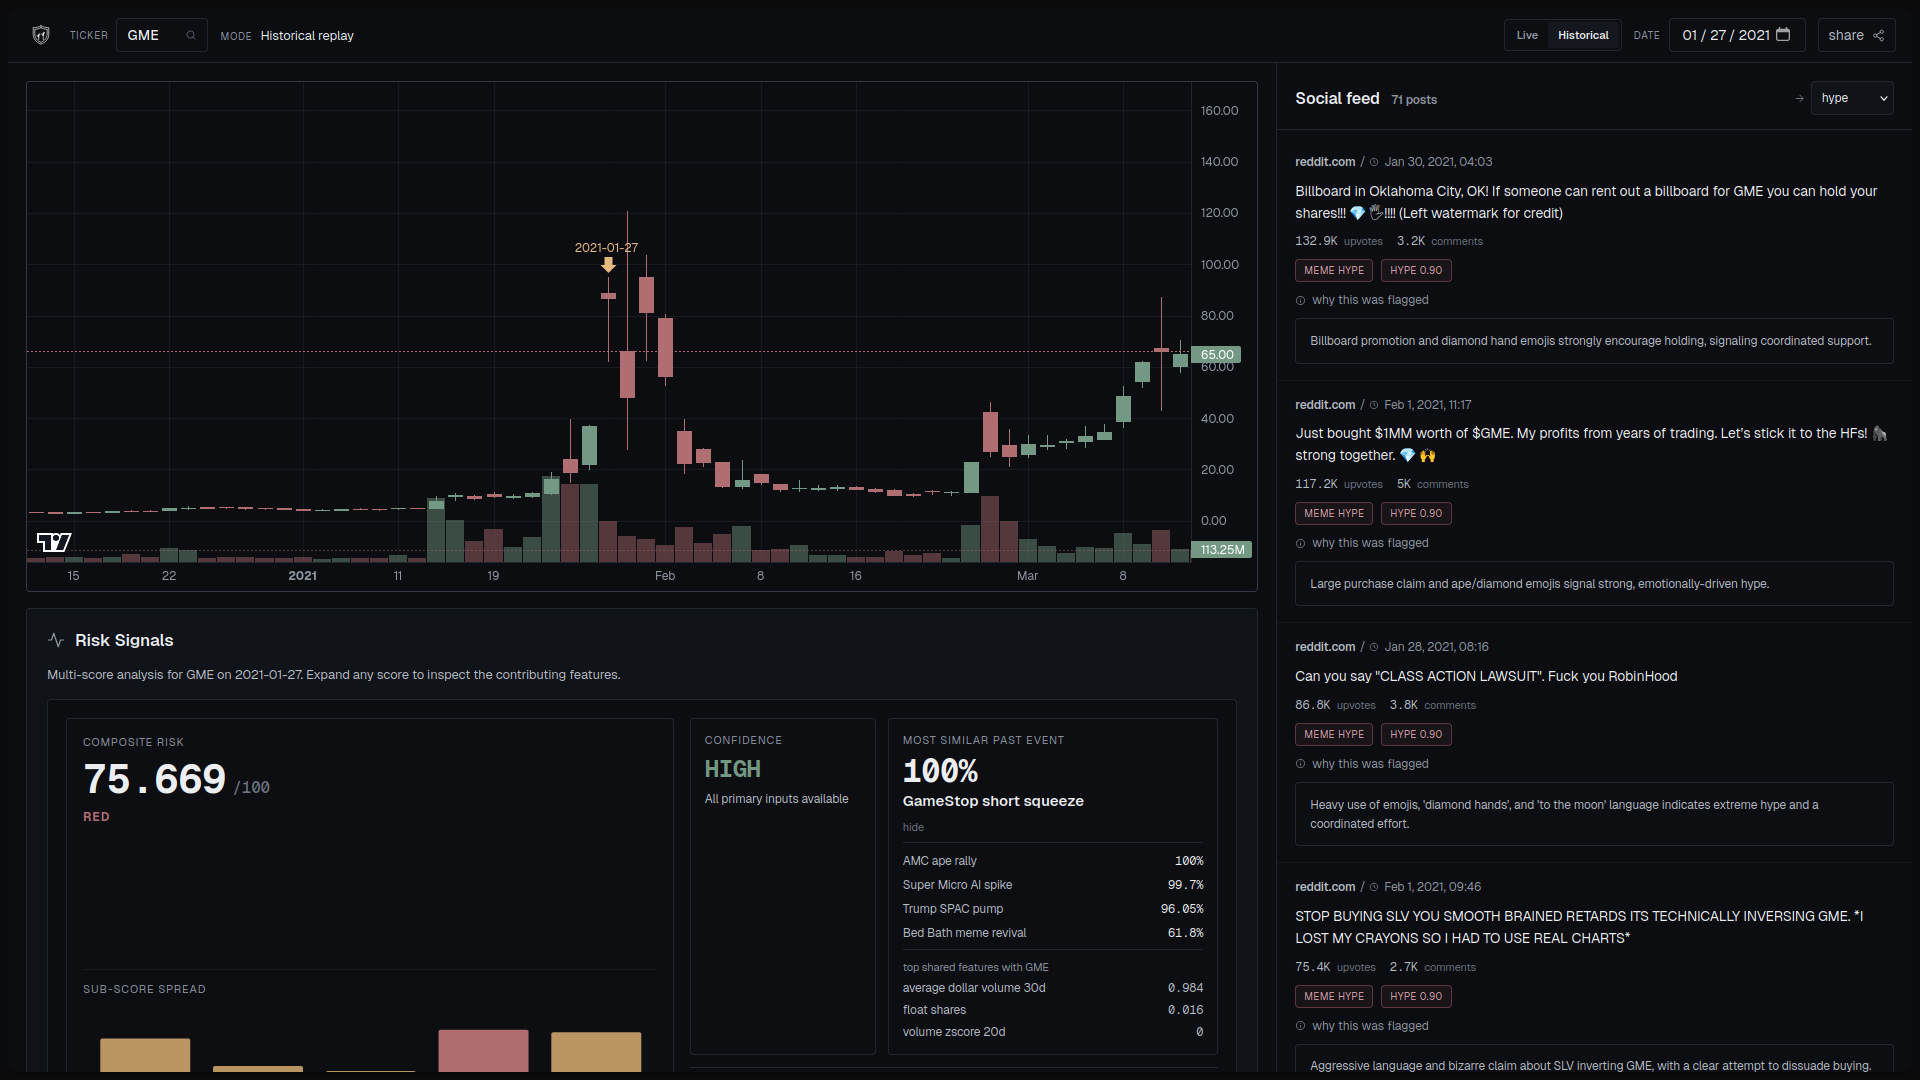
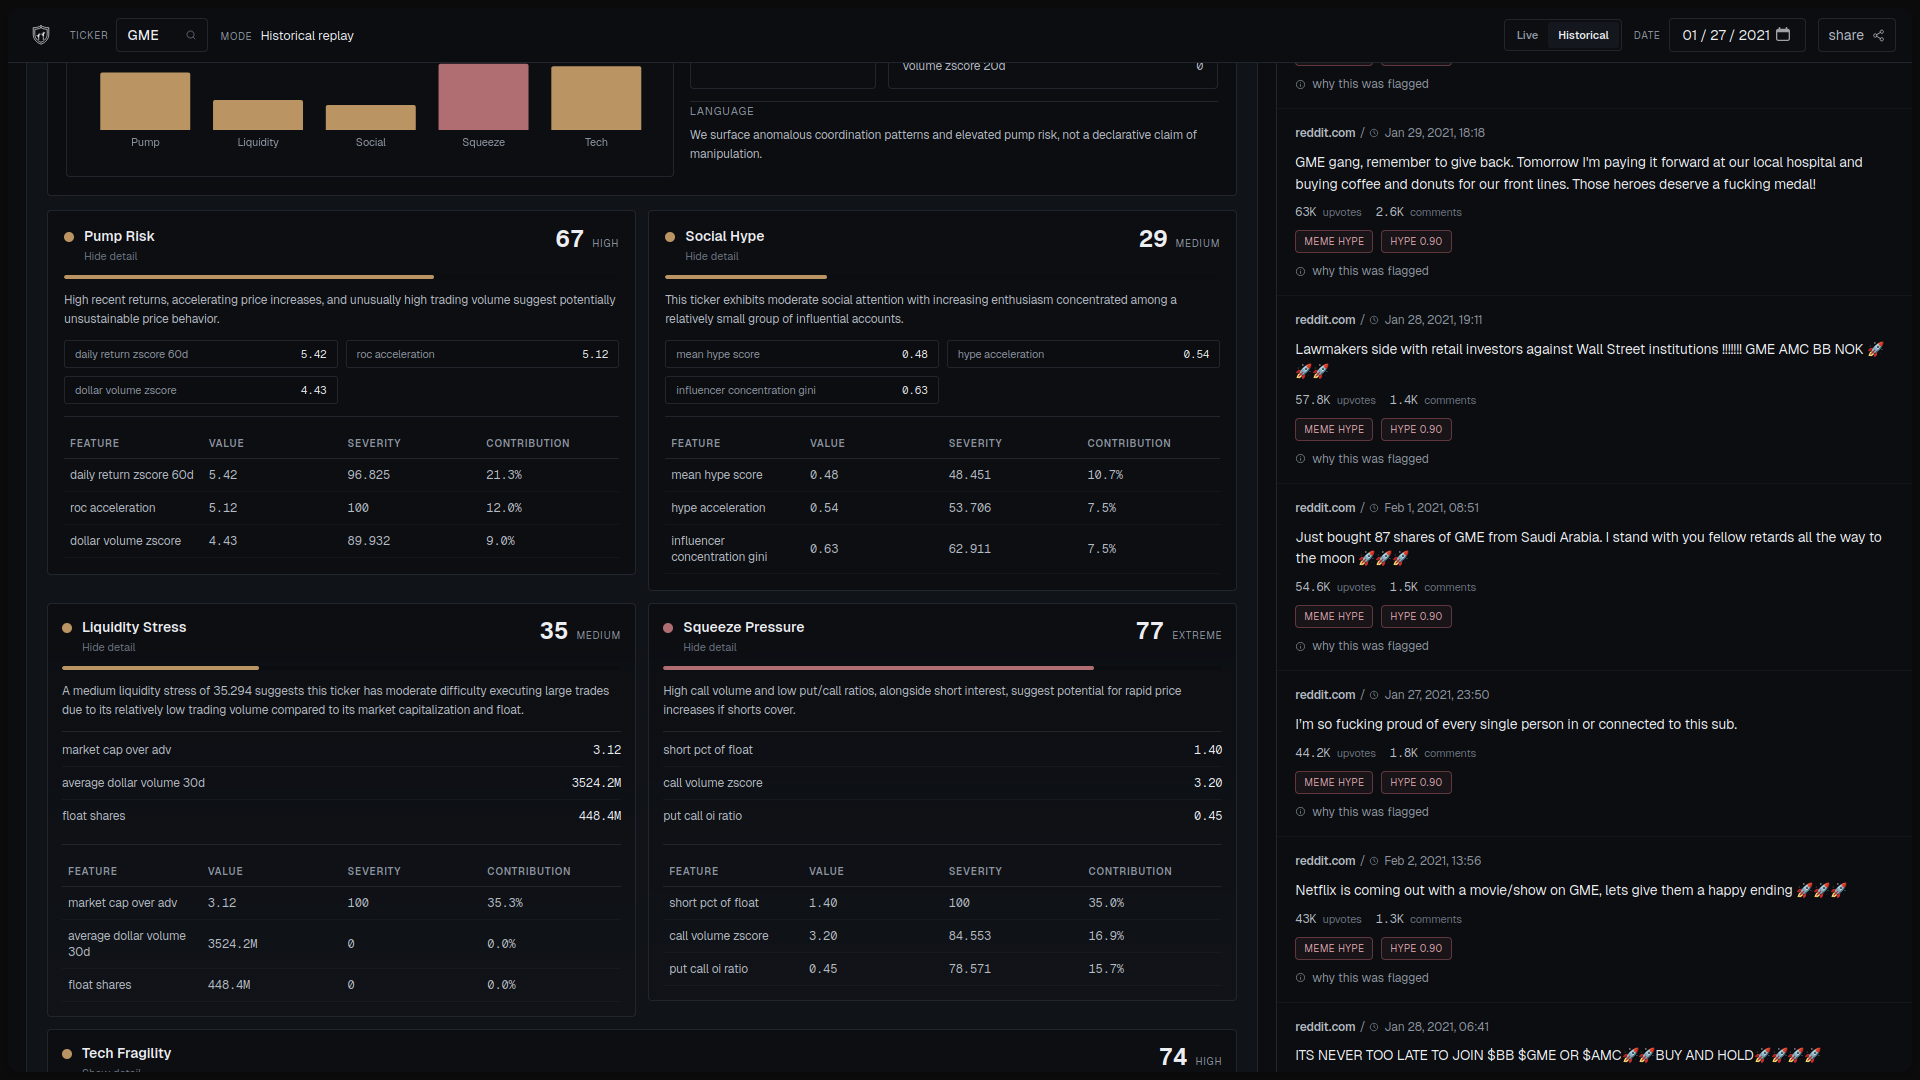
Risk Signals
-
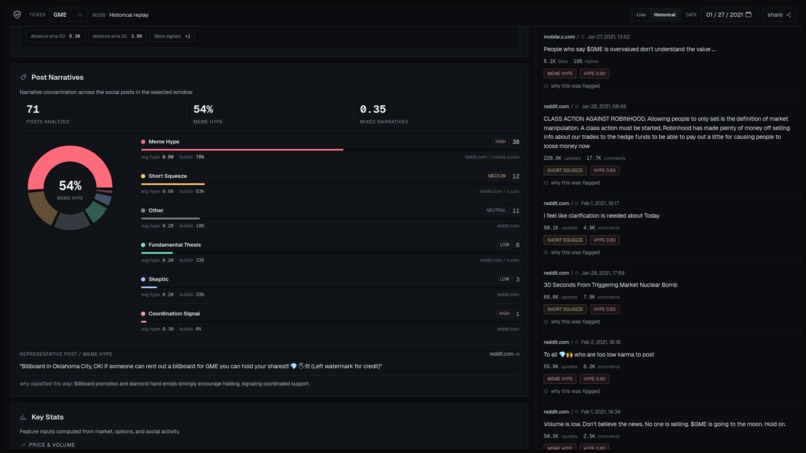
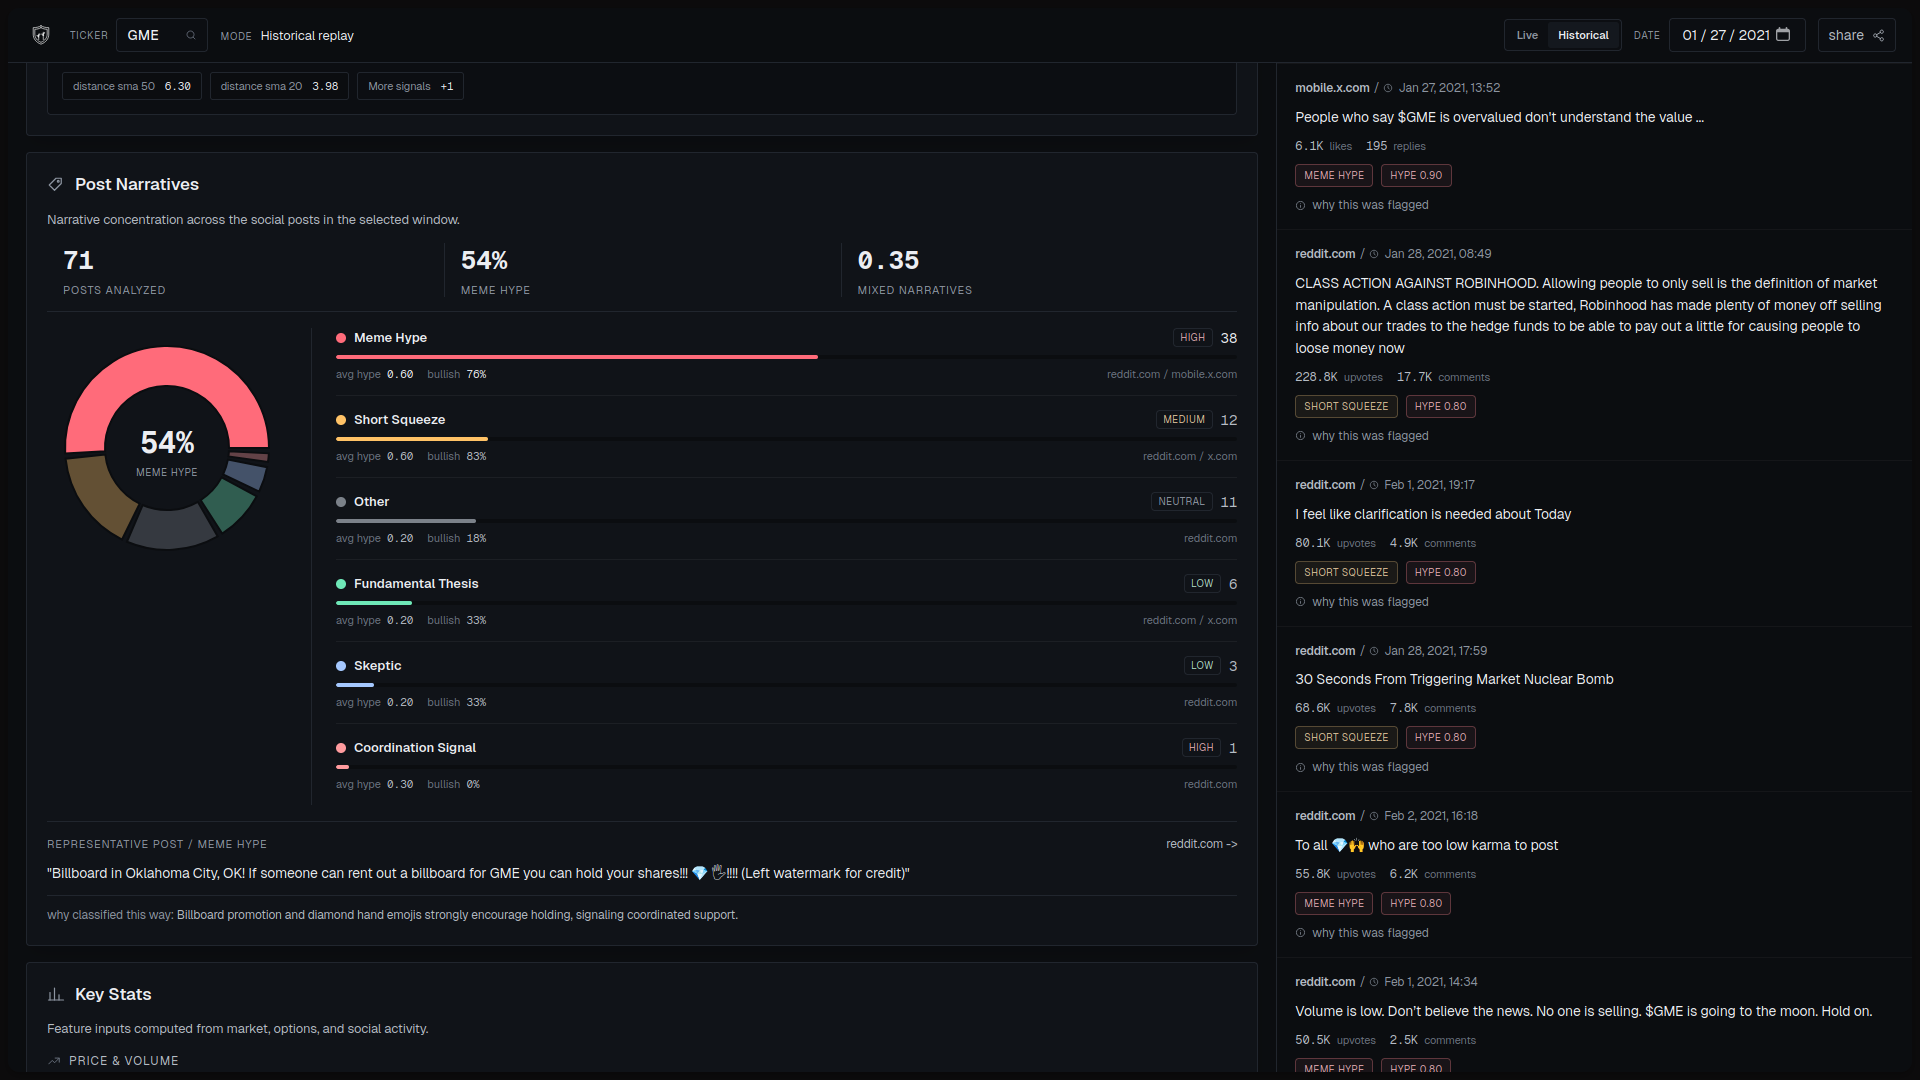
Post Narratives
-
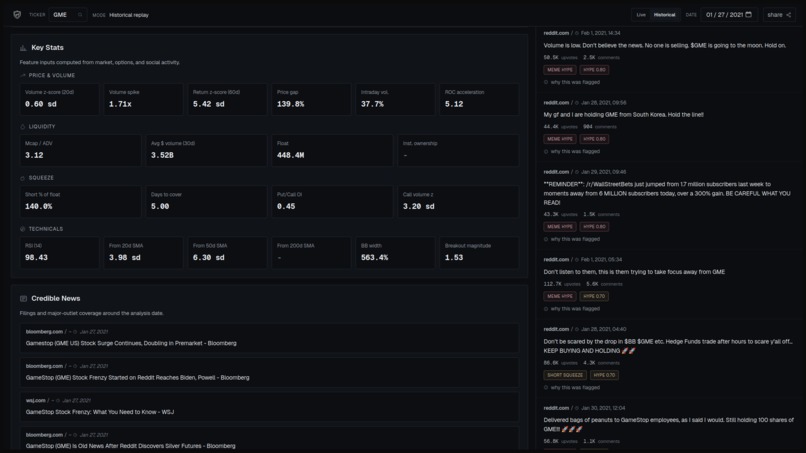
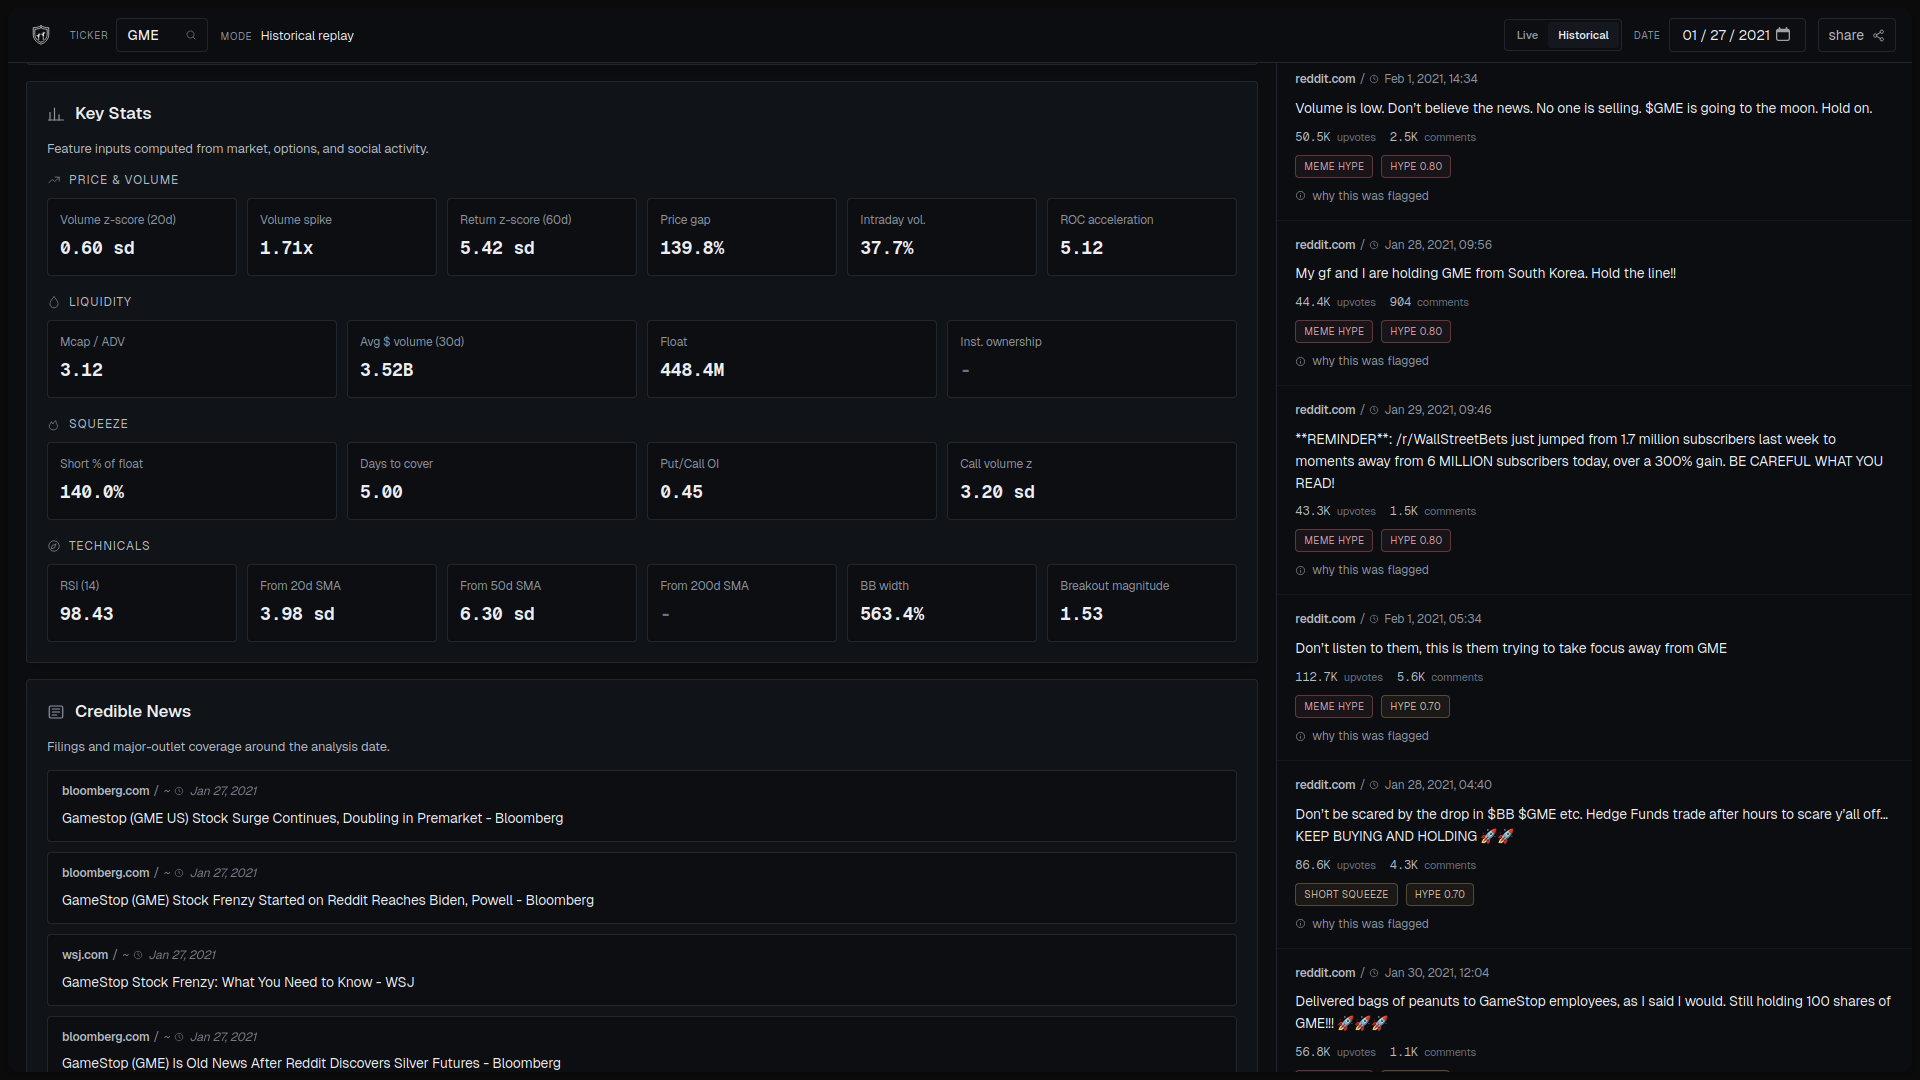
Key Stats & Credible News
-
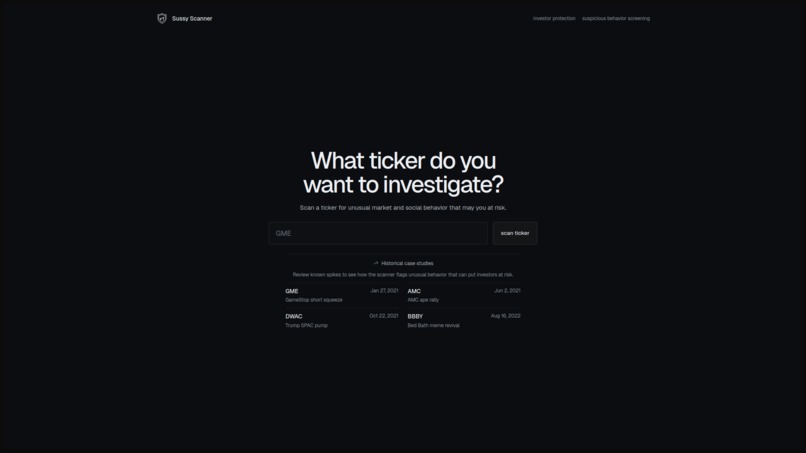
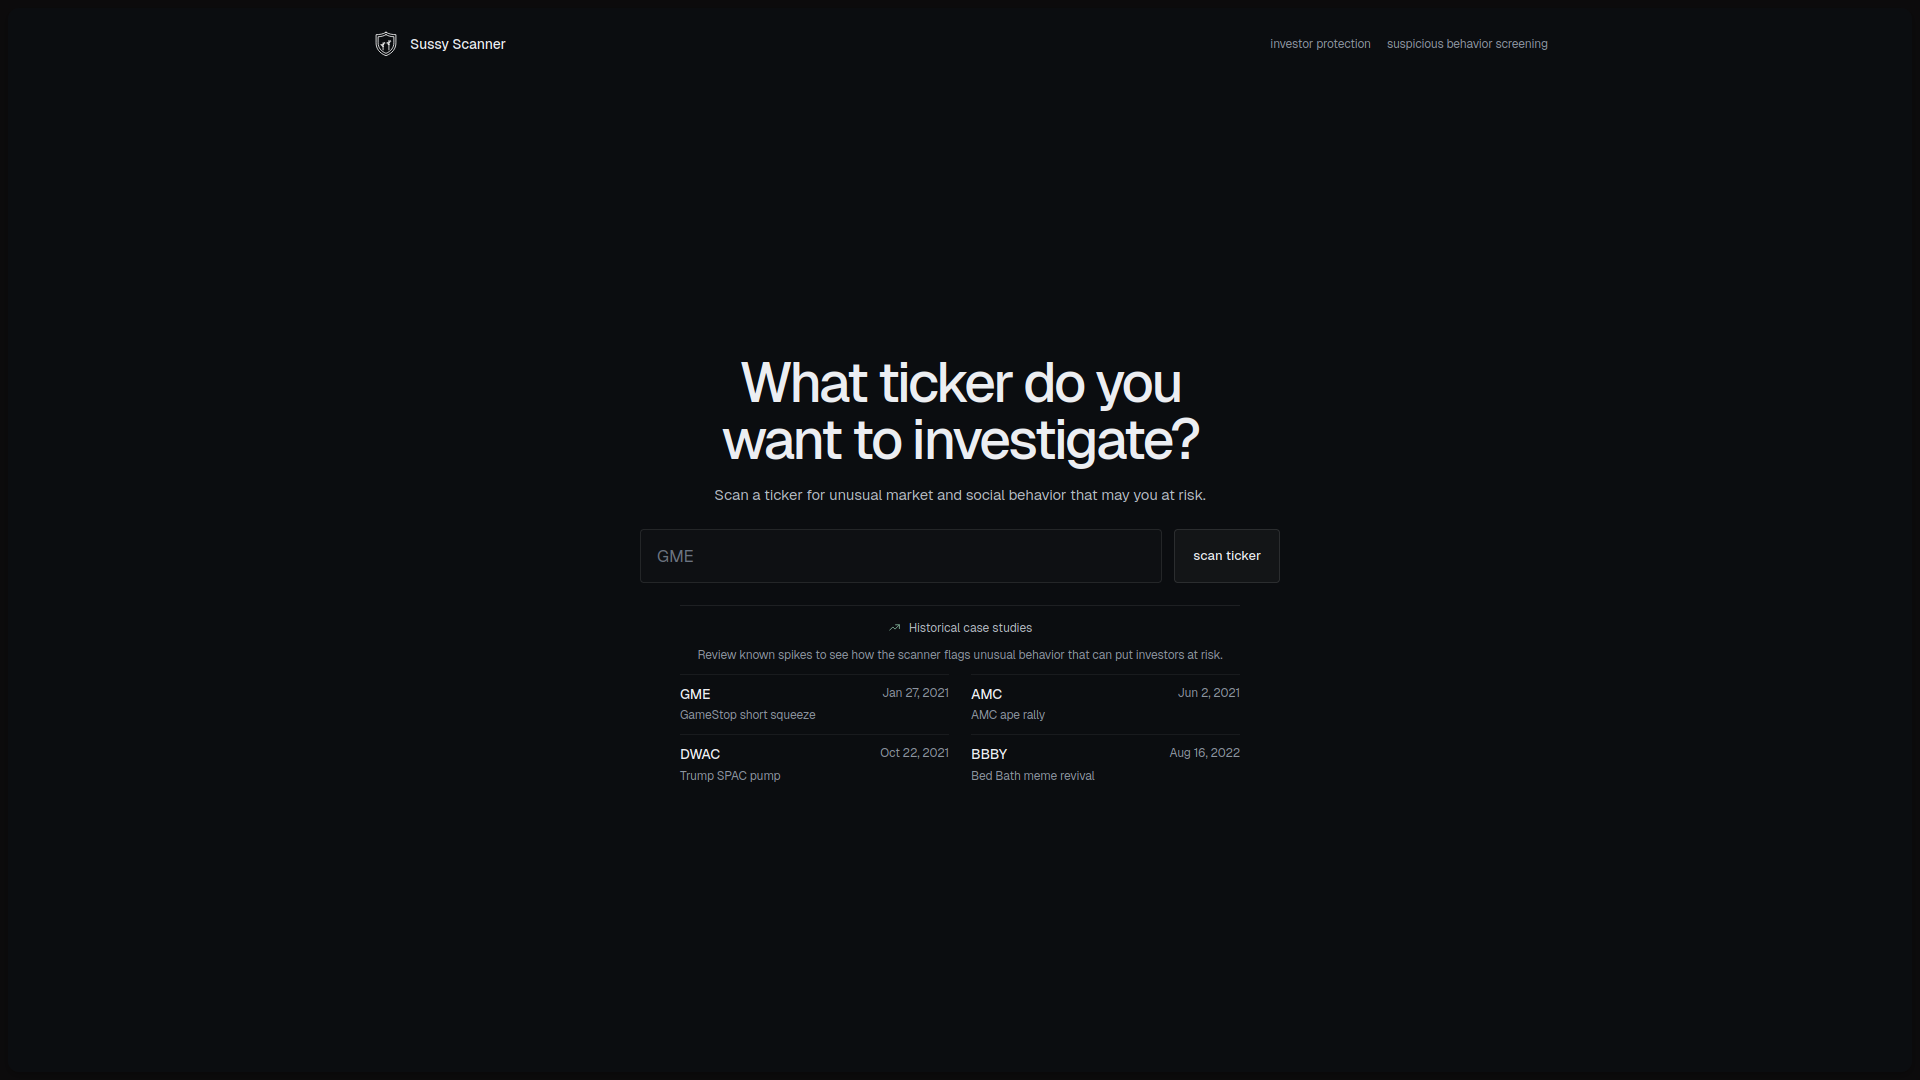
Home Page
Inspiration
We watched the GameStop saga unfold in January 2021 and saw both the power and the danger of social media-driven market movements. While some walked away with life-changing gains, countless ordinary investors lost their savings after coordinated pump-and-dump schemes collapsed. What struck us was the asymmetry of information: hedge funds employ entire surveillance departments to detect suspicious activity, while retail investors have nothing.
We built Sussy Scanner to level the playing field. We wanted to give everyday investors the same red-flag detection that professional risk managers use, packaged in a clean, intuitive interface that anyone can use in seconds. The name "Sussy Scanner" nods to the internet slang "sus" because detecting suspicious market behavior should be accessible, not intimidating.
What It Does
Sussy Scanner is a real-time market manipulation detection dashboard. Enter a stock ticker and within seconds it cross-references market data with social media activity to produce a comprehensive risk assessment. The system simultaneously pulls price/volume history from Yahoo Finance, social posts via Tavily and Reddit, options chains, and news articles, then computes over 30 statistical features including volume z-scores, RSI, Bollinger Band breaches, mention velocity, and hype acceleration.
These features feed into five independent scoring engines: Pump Risk (30%), Social Hype (25%), Liquidity Stress (20%), Technical Fragility (15%), and Squeeze Pressure (10%). Google Gemini analyzes every social post to classify promotional language, urgency signals, sentiment, and narrative type. A similarity engine then compares the stock's behavior against known manipulation events like the GameStop squeeze and AMC rally.
Results render in an interactive dashboard with TradingView candlestick charts, expandable risk signal cards, narrative breakdown donut charts, and a social media feed with AI annotations. Users can also analyze historical events by date to see exactly what the risk scores looked like on any given day.
How We Built It
We designed Sussy Scanner as a decoupled client-server architecture. The frontend is a React 18 SPA built with Vite, React Router, Recharts, TradingView Lightweight Charts, and Axios. The backend is an Express.js server using ES modules, with the core analysis pipeline orchestrated by explainability.js coordinating parallel data fetching, feature computation, scoring, and AI analysis.
The backend follows a layered architecture: an ingestion layer normalizes data from Yahoo Finance, Tavily, Reddit, and Finnhub into a common format; a feature engineering layer transforms raw data into statistical features; a scoring layer maps features onto 0–100 scales using sigmoid and linear severity functions; and an AI layer uses Google Gemini for post classification and narrative generation. A composite scorer aggregates the five sub-scores with configurable weights, applying stacking floors and correlation caps to prevent dilution.
We optimized aggressively with a SQLite TTL cache (5 minutes for live data, 30 days for historical), parallel fetching via Promise.all, and pre-filtering that regex-screens social posts before sending them to Gemini to reduce AI costs.
Challenges We Ran Into
Every free-tier API we used (Yahoo Finance, Finnhub, Tavily) enforces aggressive rate limits. We built a SQLite caching layer and carefully managed request patterns to avoid 429 errors. When Finnhub's free tier returned 403s on many endpoints, we constructed fallback paths through Stooq for historical data. Computing 30+ statistical features from raw OHLCV data under hackathon time pressure required us to implement RSI, Bollinger Bands, and z-score normalization from scratch using simple-statistics, then iterate repeatedly to tune the sigmoid severity curves.
Sending every social post to Gemini would have burned through API credits fast. We solved this with a two-tier pre-filter: benign financial keywords trigger auto-classification as neutral, pump language gets flagged immediately, and only ambiguous posts reach the AI. We also faced wildly inconsistent timestamp formats across social sources (ISO strings, Unix epochs, relative time, or nothing at all), which we normalized with a dedicated timestampEnricher.js.
The analysis endpoint can take 10–30 seconds on a cold cache when fetching from 4+ APIs and running AI analysis. We built a comprehensive skeleton loading system with animated placeholders for every dashboard section to keep the UX feeling responsive during long waits.
Accomplishments That We're Proud Of
We tested Sussy Scanner against known manipulation events (GME, AMC, BBBY) and it correctly flags them as HIGH/CRITICAL risk while labeling blue-chip stocks like AAPL and MSFT as LOW risk. The weighted composite scoring with stacking floors and correlation caps produces intuitive results that resist overreaction to single outlier metrics. Every risk score includes the top contributing features and a Gemini-generated explanation, so users can expand any score card and see exactly why it scored the way it did.
The similarity engine compares current stock behavior against a curated database of known pump events using cosine similarity on the feature vector. When the tool reports "87% similar to the GameStop short squeeze," that delivers a powerful and actionable insight. We also shipped a production-quality UI with skeleton loading states, error handling, responsive layout, TradingView charts, and a cohesive design system, all within a hackathon weekend.
What We Learned
Diving into market microstructure taught us how short squeezes work, how thin floats amplify price movements, and how options gamma creates feedback loops. We initially considered training a custom ML model for manipulation detection but discovered that well-engineered statistical features combined with simple weighted scoring outperform a black-box model for this use case and prove far more explainable.
We learned to design for API rate limiting from the start by caching aggressively, building fallback data sources, and implementing retry logic. Gemini's biggest value-add turned out to be making sense of unstructured social media text (identifying promotional language, classifying narratives, generating explanations) rather than numerical analysis, confirming that AI and statistical layers complement each other.
A polished dashboard with loading skeletons and smooth interactions makes a far stronger impression than a raw JSON endpoint, even when the underlying logic is identical. Investing time in the frontend was absolutely worth it.
What's Next for Sussy Scanner
We plan to add WebSocket-based real-time monitoring that continuously updates risk scores as new market data and social posts arrive, with push notifications when stocks cross risk thresholds. A React Native mobile app with push alerts would make the tool genuinely useful for everyday investors on the go. We also want to expand beyond US equities to cover cryptocurrency markets, forex, and international stocks where manipulation runs even more rampant.
We aim to build a community dashboard showing the most suspicious stocks across the market in real time, essentially a manipulation heat map that surfaces threats before mainstream news picks them up. Adding a user feedback loop where users flag false positives and negatives would create a labeled dataset to fine-tune scoring weights over time.
Longer term, we want to integrate brokerage APIs so users can connect their portfolios and receive automatic risk alerts for holdings, and incorporate SEC EDGAR filings, Form 4 insider trading disclosures, and FINRA short interest reports as additional data sources for more comprehensive analysis.
Built With
- axios
- express.js
- finnhub
- gemini
- javascript
- lightweight-charts
- react
- recharts
- sqlite
- stooq
- tavily
- tradingview
- yahoo-finance

Log in or sign up for Devpost to join the conversation.