-
Fused VDOT Activity Data Model Providing spatio temporal updates in real time
-
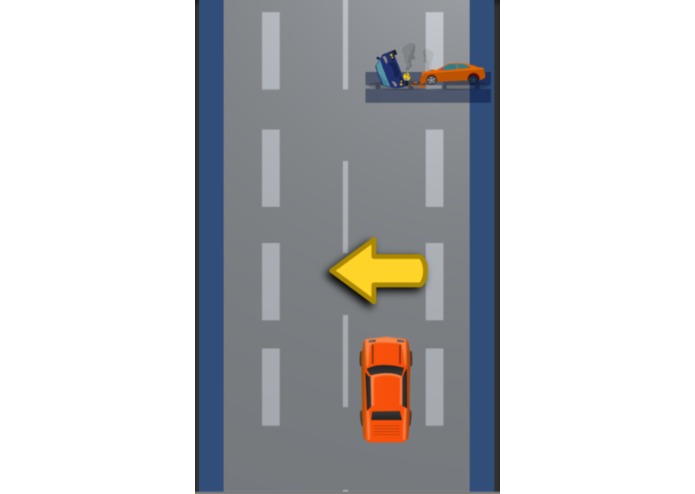
Demonstration of Unity Application prototype compilable to Android, iOS, PC, Mac
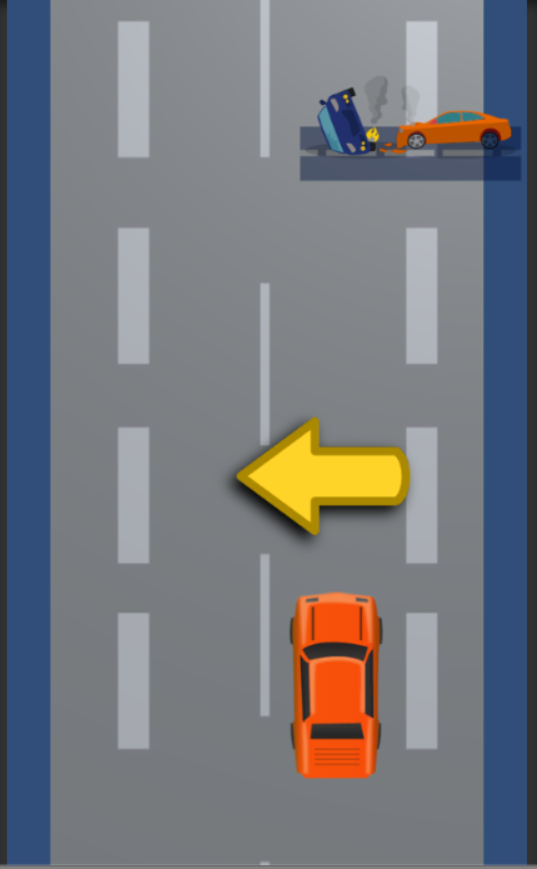
Use VDOT datasets to provide a spatio-temporal safety metric
What it does:
Ingests and applies a variety of VDOT data sources to include speed limit, crashes, lane closures, and road work to define a safety metric to be depicted in the UI
How we did it.
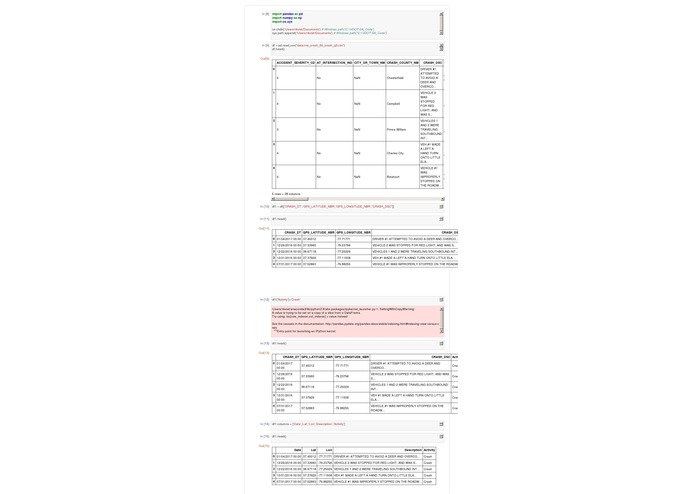
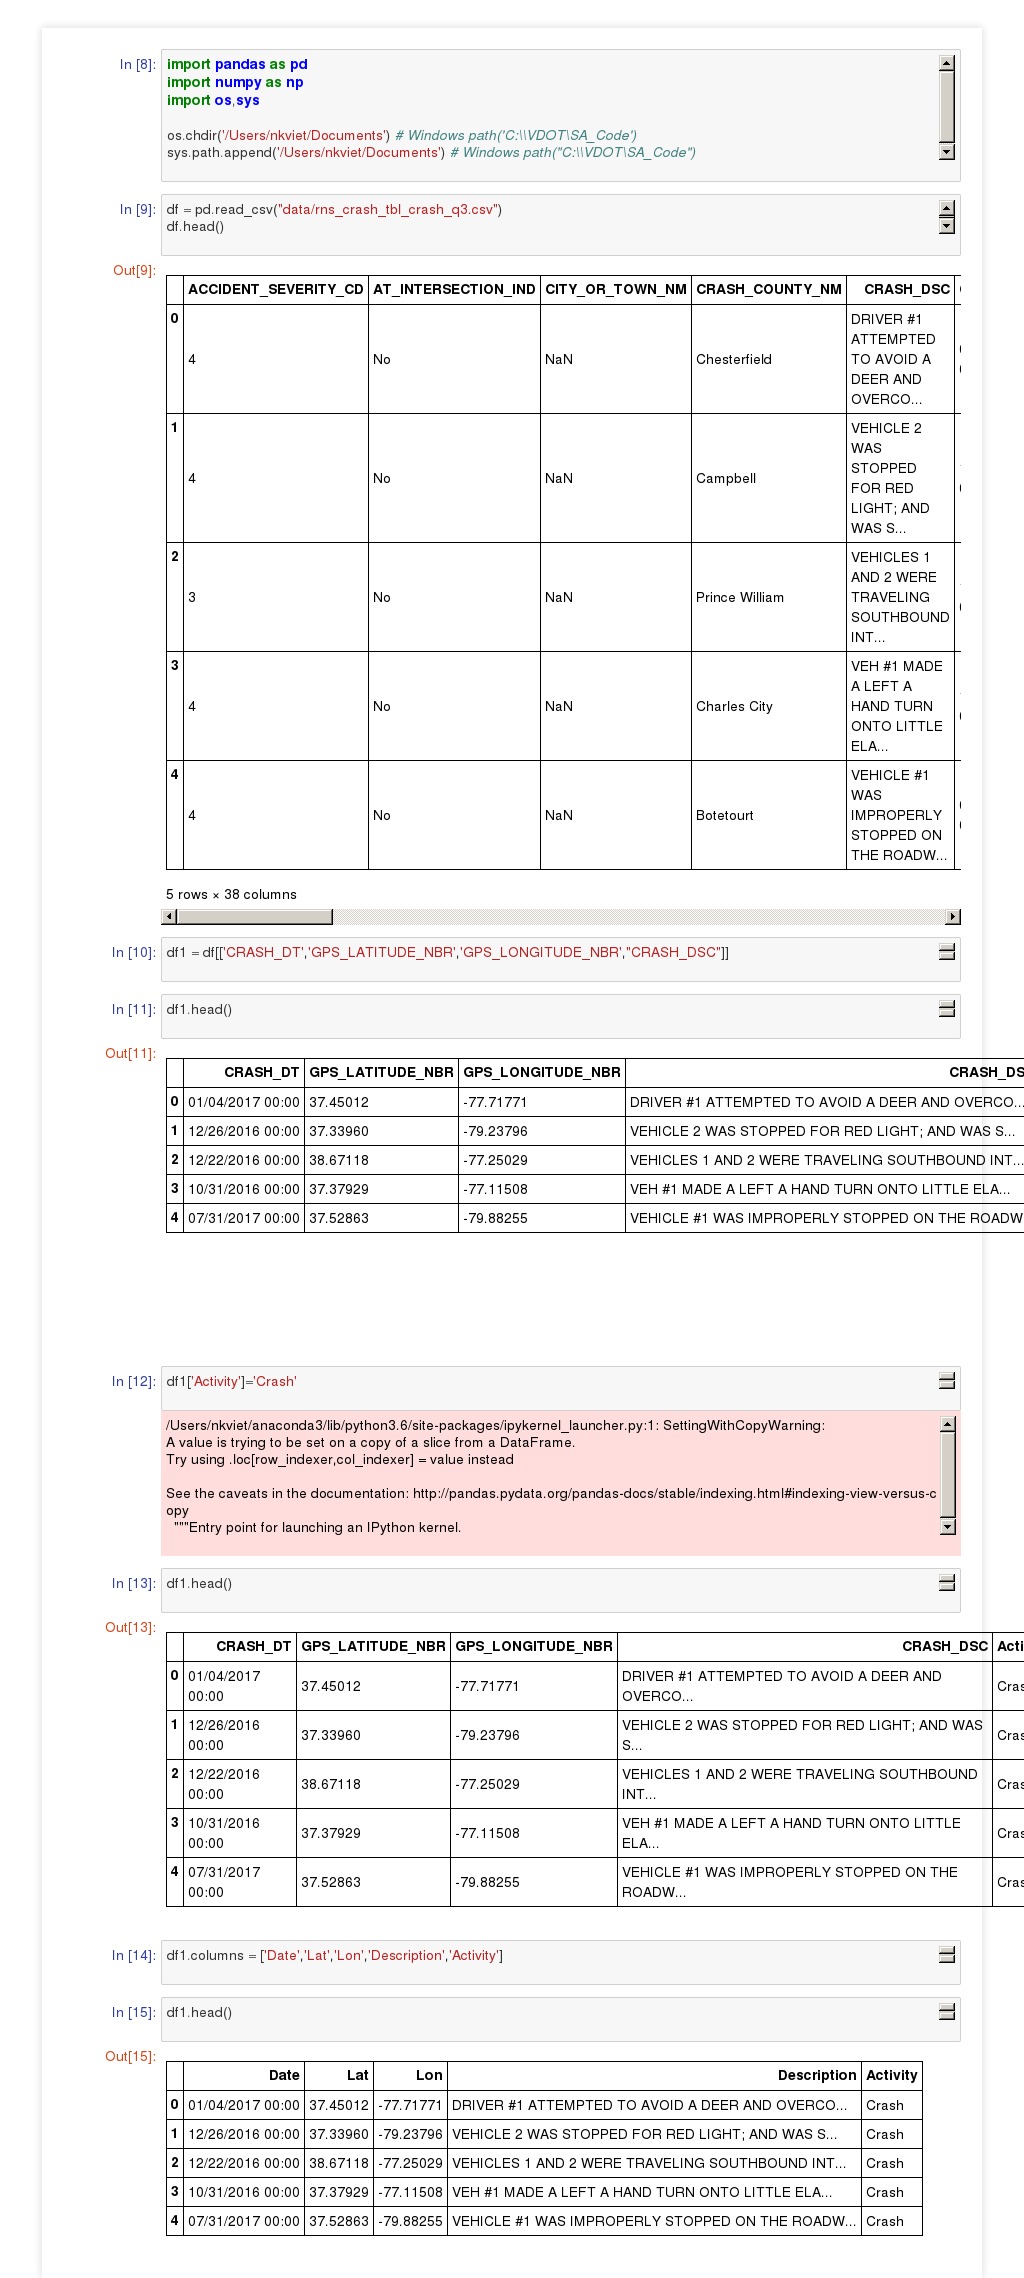
Parsed data sets into a fused data set of activity, location, and datetime
Challenges:
- Time of activities is not always clear (e.g. crash time is per day, no hours/minutes, time and last updated time).
- UI's are not quick to build
What we are proud of:
Determining a very simple fused data model of activity, location, and datetime
What's next for Surviving Asteroids:
Adding additional data sets into the algorithm for determining the safety categorizations. Moving to a more complex categorization than red, yellow, and green to a numeric that can be input into a autonomous vehicle control system.
Datasets
We used the SmarterRoads Quarterly Crash Data


Log in or sign up for Devpost to join the conversation.