-
-
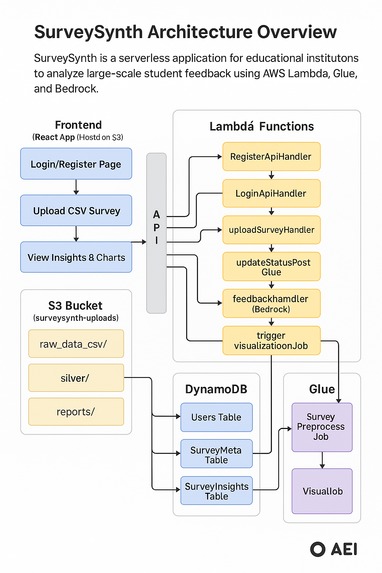
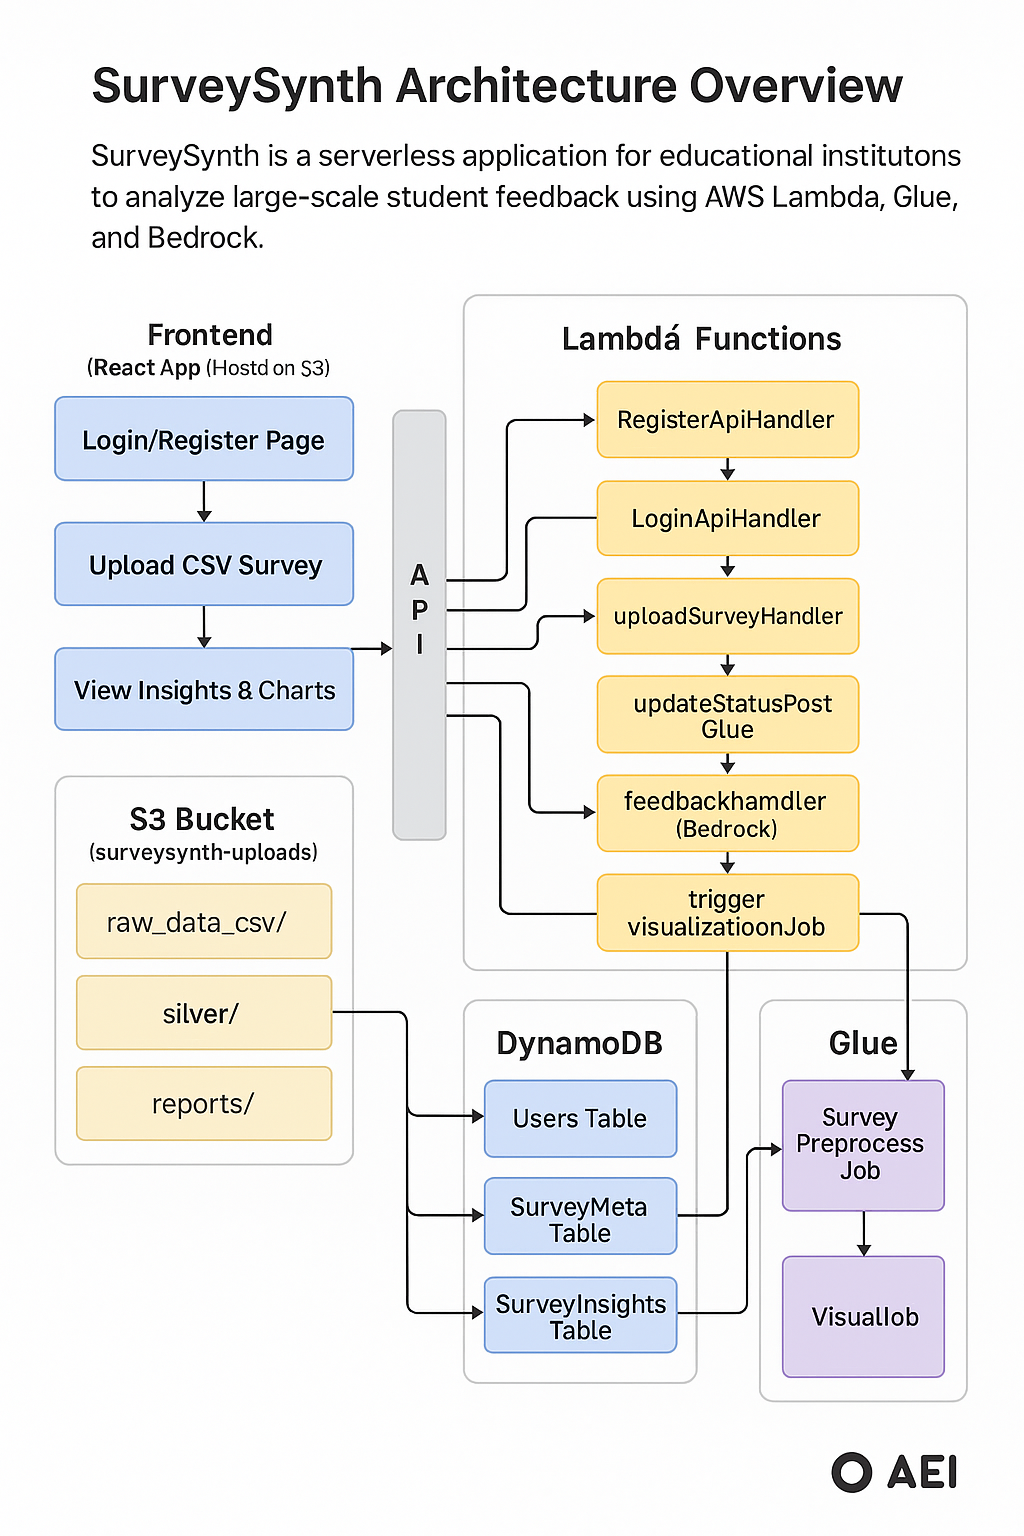
Application Architecture
-
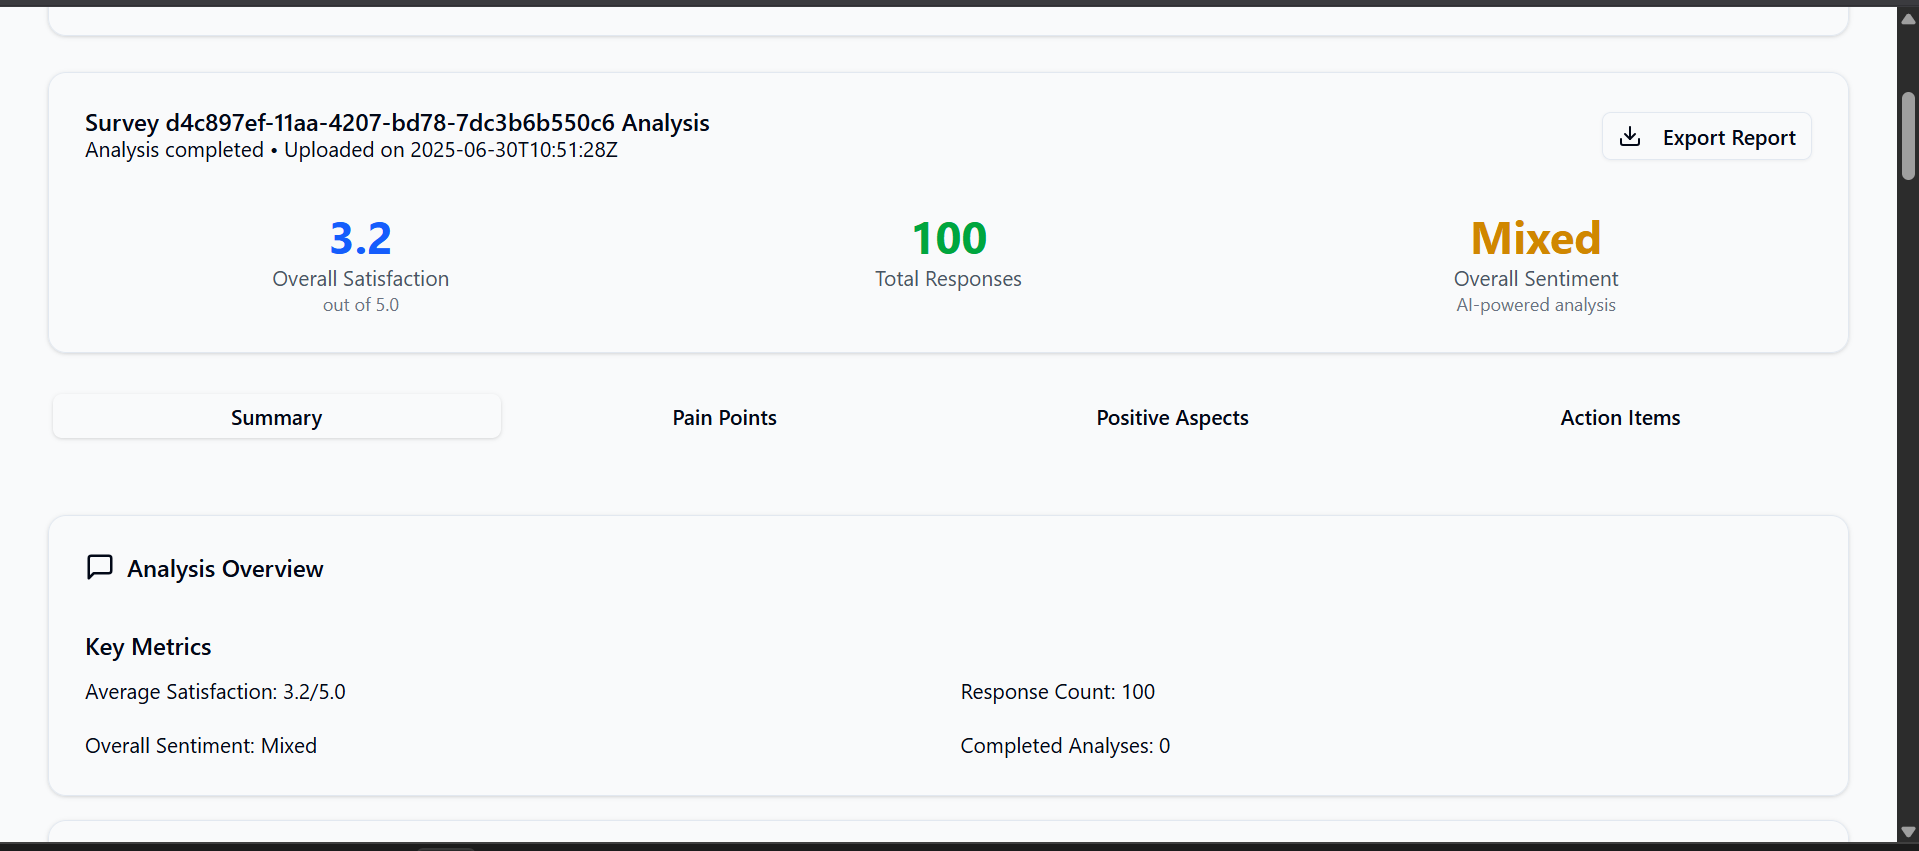
Insights
-
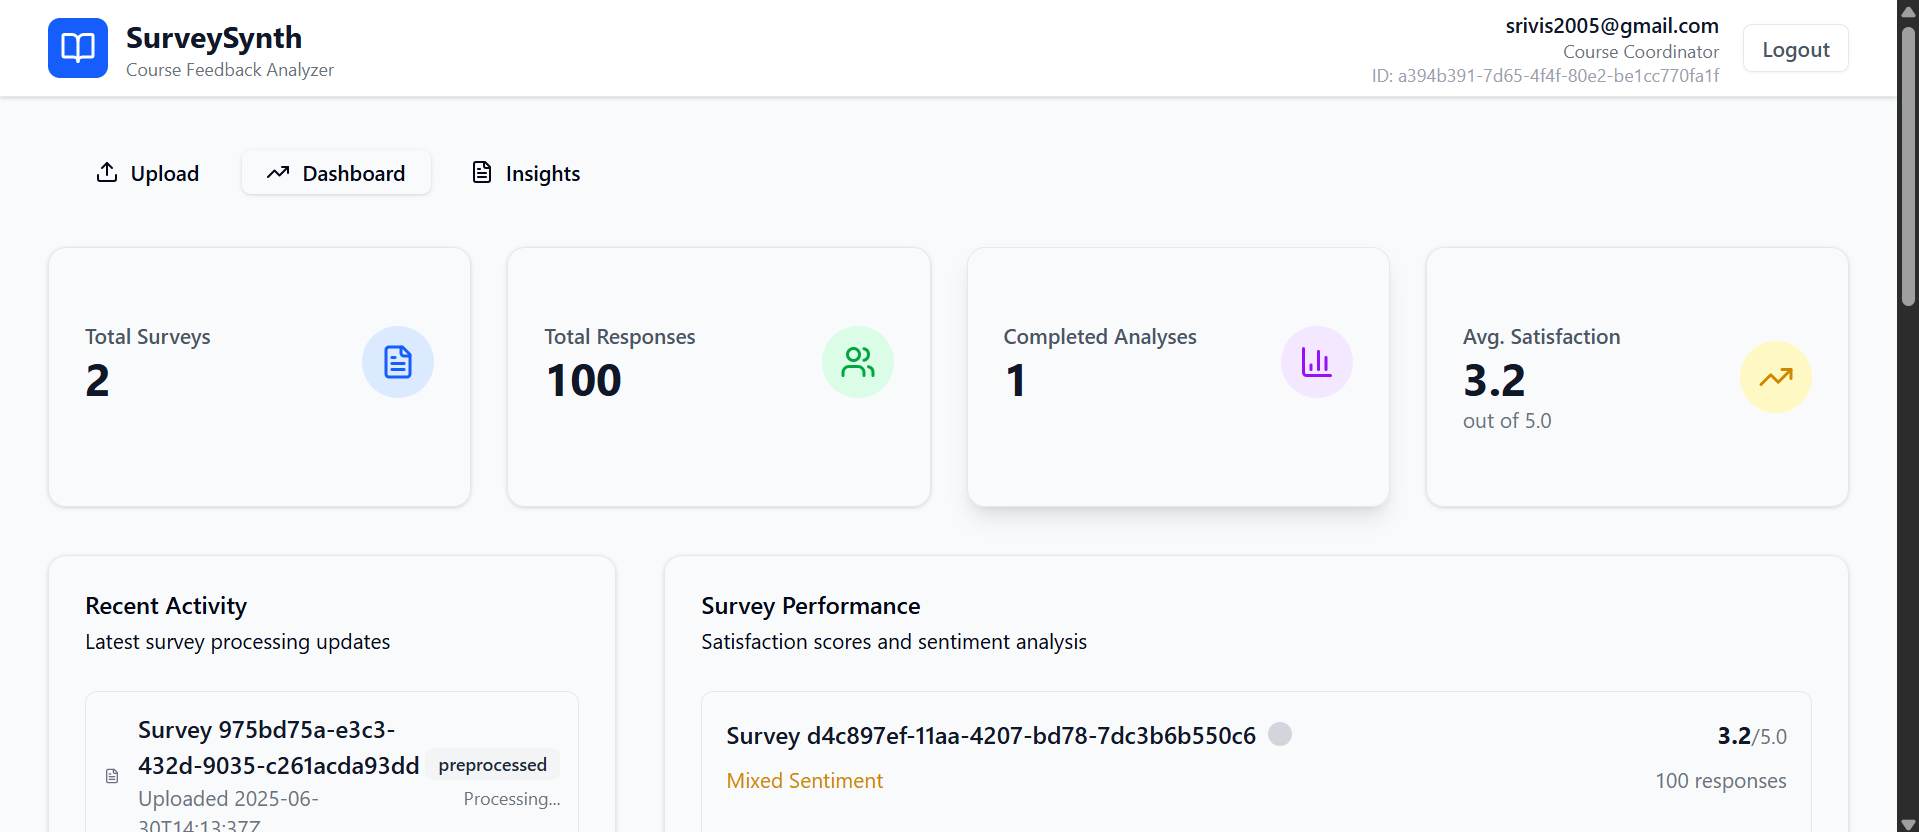
DashBoard
-
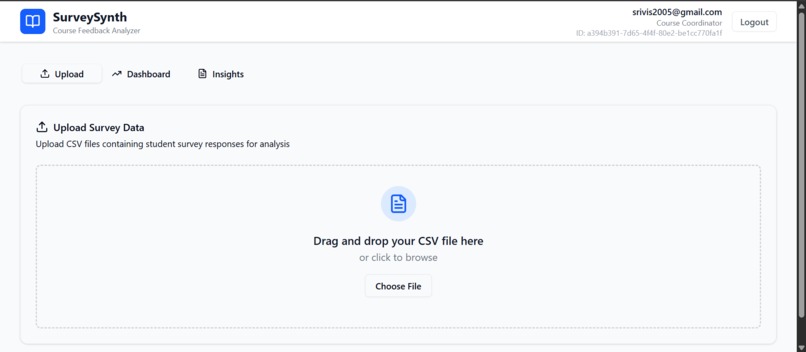
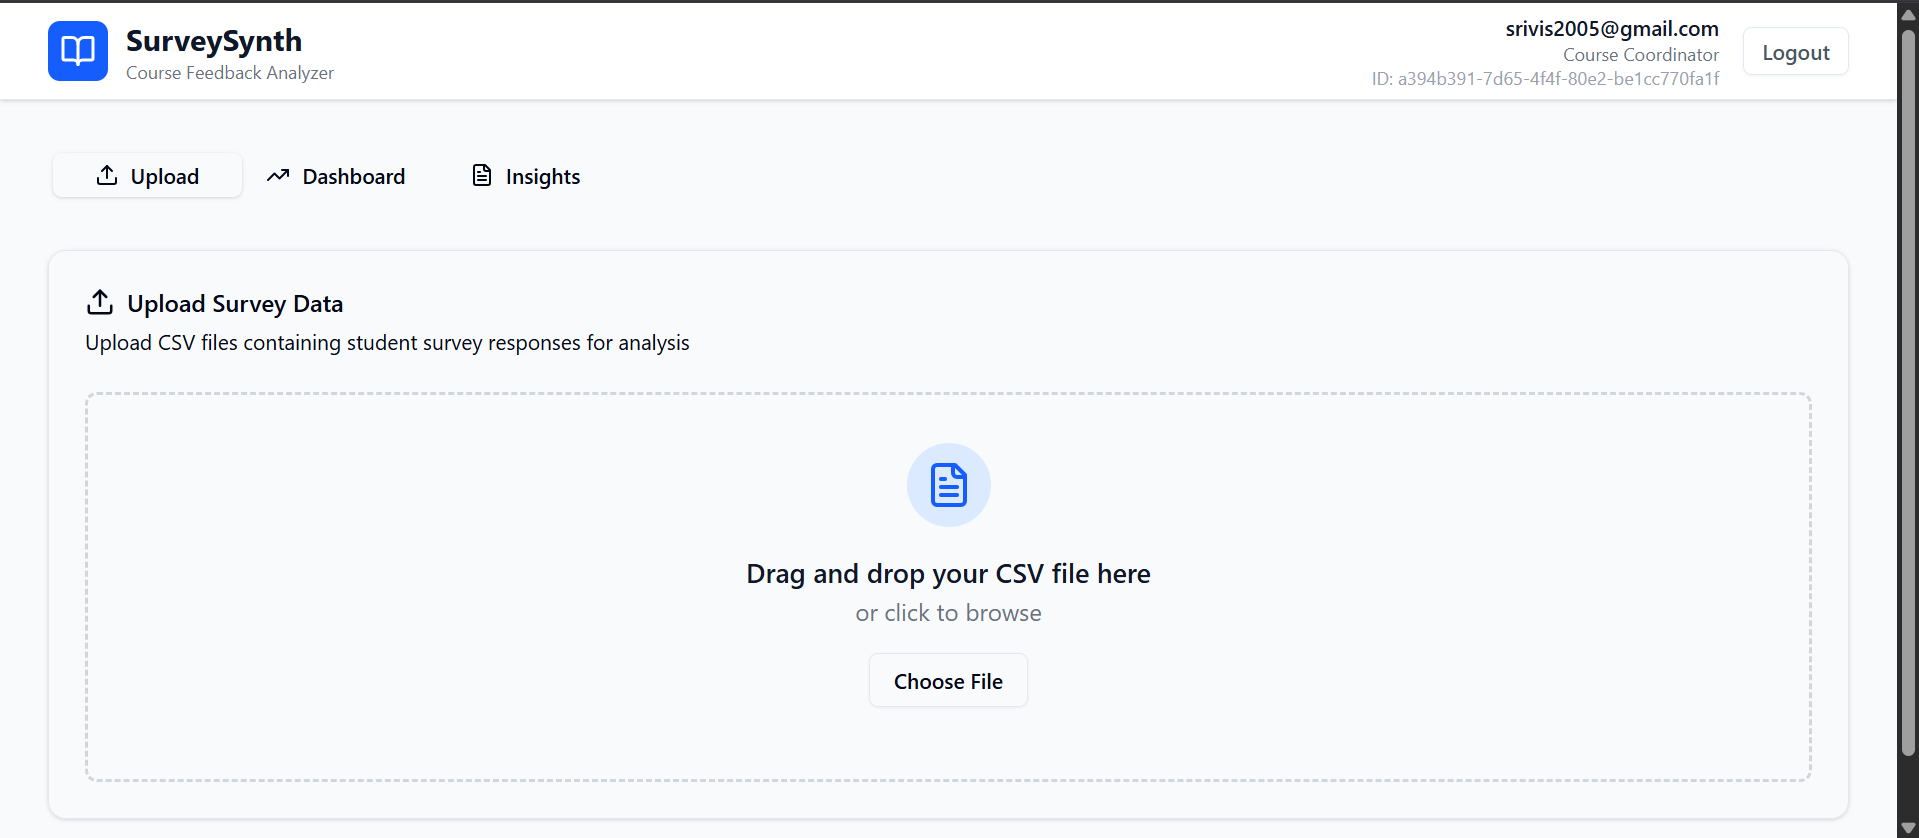
Upload Page
-

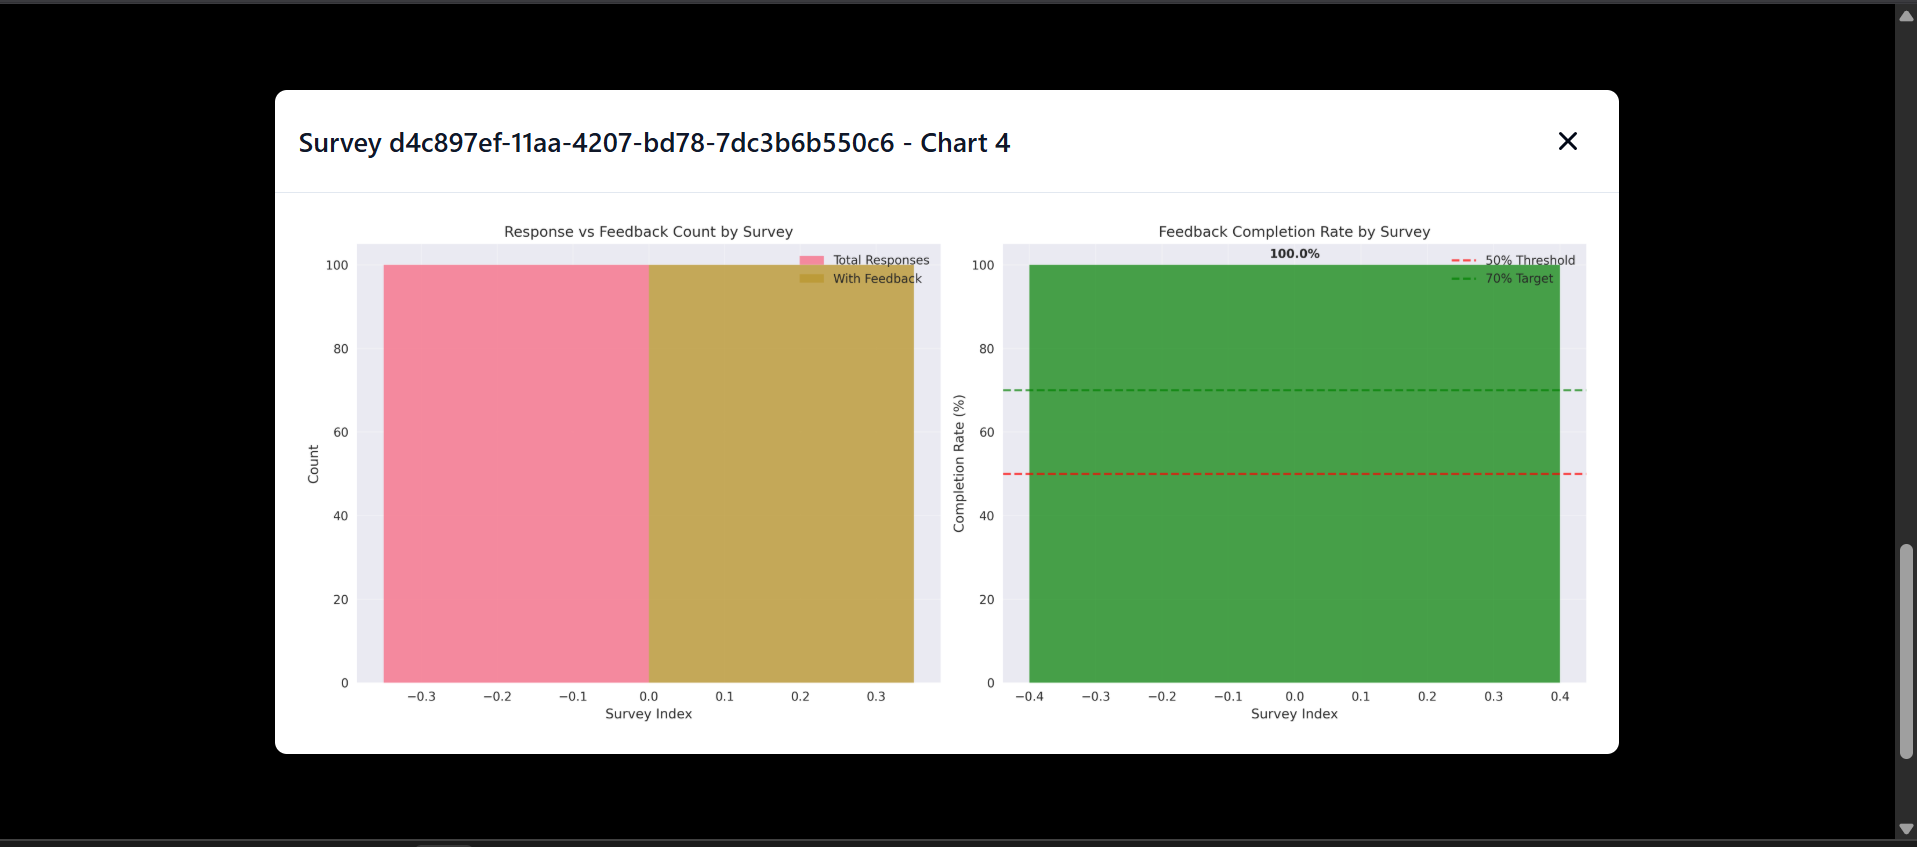
full view of charts
-
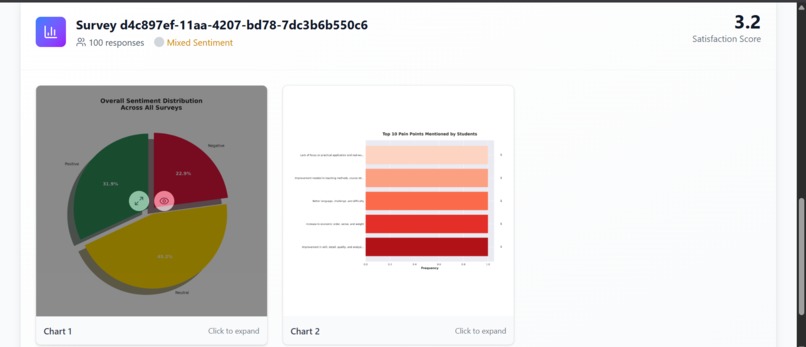
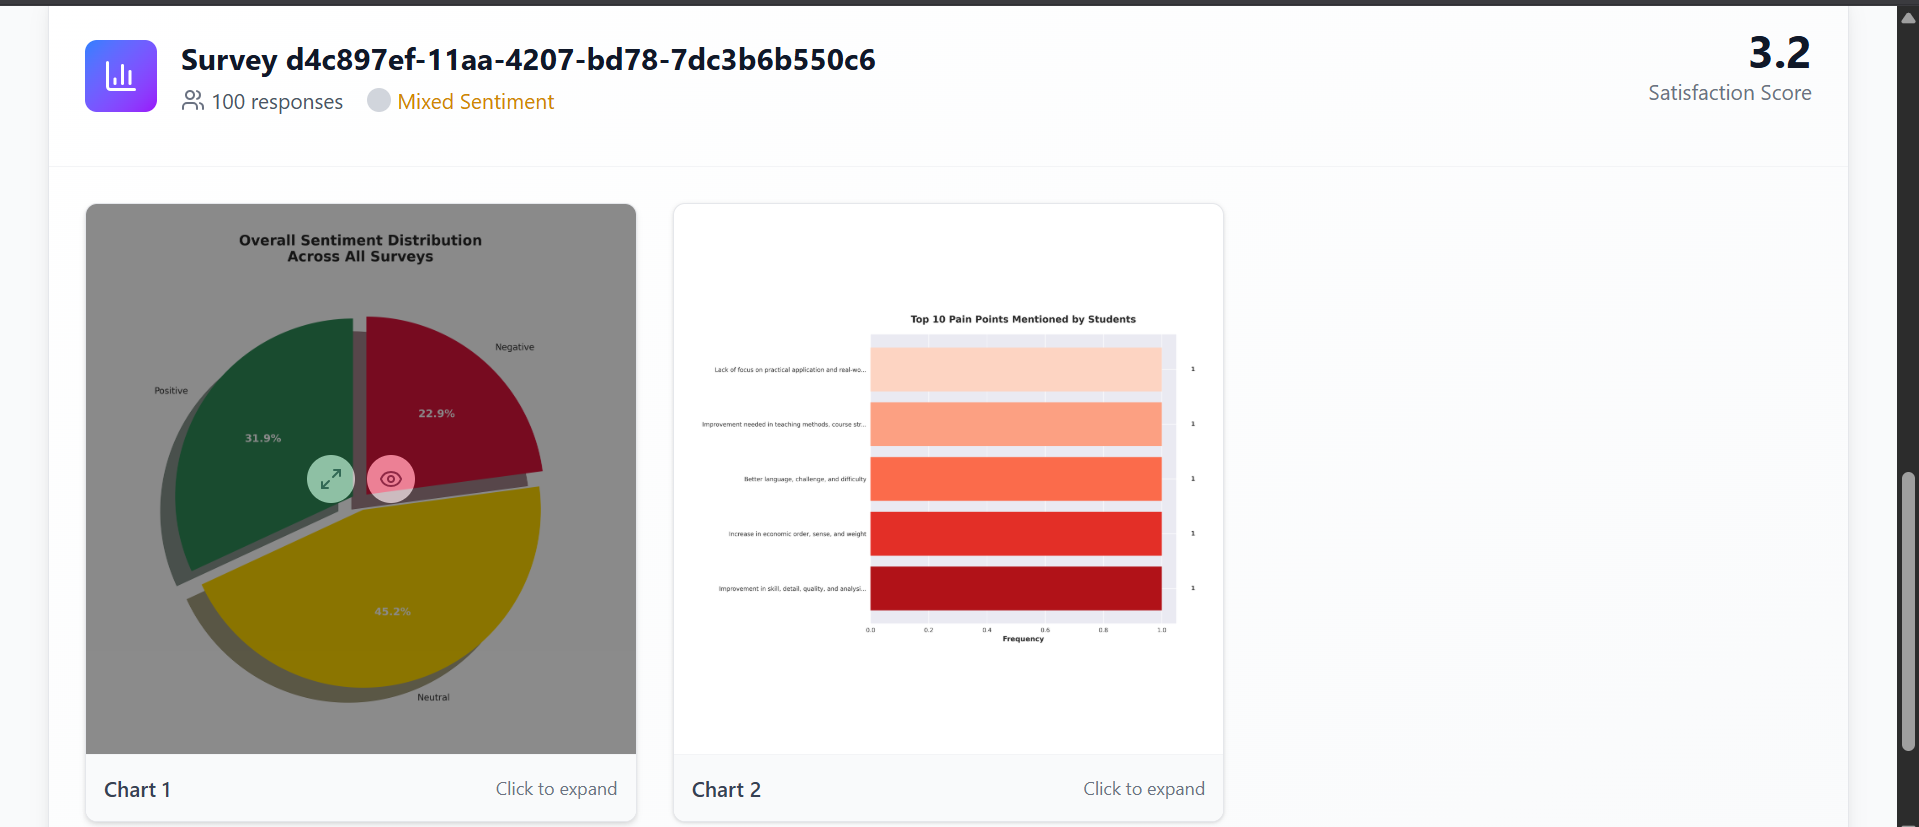
Charts generated
-
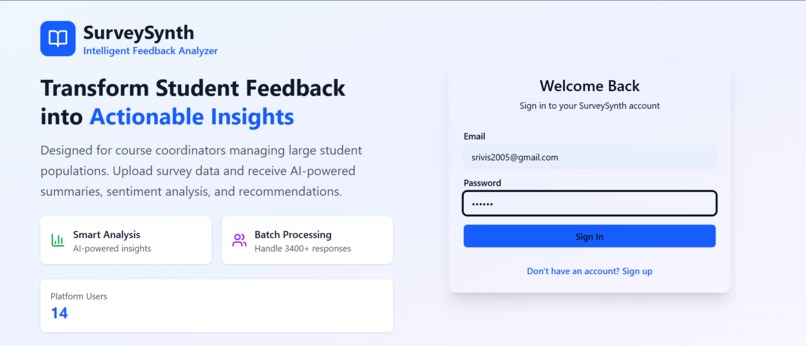
Login Page

SurveySynth – Serverless Survey Analyzer for Education
By: Vishnu Murthy | B.Tech Final Year | KL University
Deployed Frontend: SurveySynth UI (S3)
Problem Statement
In large universities like mine (KL University), thousands of Computer Science students share the same set of core courses. Each course is managed by a course coordinator who gathers post-course feedback to improve the syllabus and delivery for future batches.
However, manually analyzing CSV-based survey responses (often hundreds or thousands of entries) is inefficient and subjective. There’s no automated system to extract pain points, sentiment, or actionable suggestions from open-text feedback.
Solution: SurveySynth
SurveySynth automates this end-to-end process using serverless architecture, enabling coordinators to:
- Upload raw CSV survey files
- Automatically clean and analyze data
- Generate AI-powered summaries and suggestions
- View visual charts and download reports
Key Features
- User Registration & Login (React + API Gateway + Lambda + DynamoDB)
- CSV Upload → Stored in S3 → Triggers ETL
- AWS Glue preprocesses the data and stores it in a refined format
- Amazon Bedrock analyzes textual feedback for insights
- AWS Glue generates Seaborn/Matplotlib charts for dashboard
- Exportable PDF reports
Architecture Overview

Built 100% using Serverless Technologies on AWS
1. Register/Login → API Gateway → Lambda
2. Upload CSV → S3 → uploadSurveyHandler → DynamoDB
3. Triggers Glue ETL Job → Cleans & Writes Silver CSV
4. Lambda updateStatusPostGlue updates metadata
5. summarizeFeedbackHandler uses Bedrock for insights
6. Results saved to SurveyInsights table
7. Stream triggers triggerVisualizationJob → Glue → PNG charts
8. Frontend polls for results → renders summary + visuals
🔗 Endpoints & Lambda Flows
| Flow Step | Trigger/Service | Lambda Function | Purpose |
|---|---|---|---|
| Register/Login | API Gateway | UserApiHandler |
Auth (Mock, stores in DynamoDB) |
| Upload Survey | API Gateway | uploadSurveyHandler |
Upload to S3, update SurveyMeta |
| Preprocess CSV | S3 → Glue Trigger | SurveyPreprocessJob |
Clean CSV → silver/ folder |
| Update ETL Status | EventBridge | updateStatusPostGlue |
Set status = preprocessed |
| Generate AI Summary | Lambda Stream | summarizeFeedbackHandler |
Bedrock → SurveyInsights |
| Generate Charts | DynamoDB Stream | triggerVisualizationJob |
Triggers Visual_job Glue Job |
| Final PNG Charts | Glue Job | Visual_job |
Generate & upload Seaborn/Matplotlib |
| 📡 Fetch Data for UI | API Gateway | SurveyMetaHandler, SurveyInsightHandler, getChartUrlsHandler |
Feed UI |
Highlights
Language Support: Works with free-text fields in English
Scalability: Serverless — scales with number of students/surveys
AI Integration: Amazon Bedrock → Claude Model for summarization
Visualization: Seaborn-based PNG charts (instead of QuickSight)
Deployment: Fully deployed via AWS SAM and S3
AWS Services Used
| Service | Usage |
|---|---|
| Lambda | Business logic: 8+ functions (auth, upload, summarize, chart gen) |
| API Gateway | Login, Register, Upload, Insights APIs |
| DynamoDB | Users, SurveyMeta, SurveyInsights metadata |
| S3 | Stores raw/silver CSVs, PNG charts, optional PDF |
| AWS Glue | 2 jobs: SurveyPreprocessJob (cleaning) and Visual_job (charts) |
| Amazon Bedrock | Summarization and sentiment analysis using Claude model |
| EventBridge | Detect Glue job completion |
| CloudWatch | Logging, debugging during development |
| CloudFormation | Serverless Application model |
Frontend Flow (React + S3 Hosted)
- Register/Login → Save session in localStorage
- Upload CSV file (base64) → /upload endpoint
- Polls /survey-meta and /insights APIs
- Displays:
- Summary
- Actionable Suggestions
- PNG Charts (fetched from S3)
- Frontend is deployed at: 👉 http://buck30300.s3-website-us-east-1.amazonaws.com/ You can Use These Credentials instead of signup: (srivis2005@gmail.com && 123456) || (srivis2001@gmail.com && 123456)
- https://github.com/murthy30300/SurveySynth/blob/feature/master/synthetic_students_feedback_500.csv
- use this csv file for upload, it will take less than 3 minutes of time at least.
- Note: the above csv file generated by GPT, the comments may not be accurate in data but according the sentiment of data in csv file the charts can be generated according the sentiment.
Example Output (from 10 feedback rows)
{
  "summary": "Users found the interface intuitive but faced performance issues.",
  "pain_points": ["App crashes", "Slow load times", "Login bugs"],
  "positive_feedback": ["Great design", "Useful search function"],
  "actionable_suggestions": [
    "Fix login crashes",
    "Improve app speed",
    "Add dark mode"
  ]
}
Local Setup (if required)
- Setup S3
- create Dynamodb table
- npm install # React frontend
- npm run dev # Runs at http://localhost:5173
- sam build && sam deploy --guided # Deploy backend
Future Enhancements
- Generate downloadable PDF Reports
- Embed charts inside PDF
- Add email notification on upload completion
- Switch to Amazon Cognito for full auth
- Multi-language summarization
About the Developer
Vishnu Nukala University ID: 2200030300 Final-year B.Tech | KL University Used SurveySynth to solve a real problem at scale — improving courses for thousands of students based on feedback that matters.
Built With
- amazon-cloudwatch
- amazon-dynamodb
- amazon-glue
- amazon-web-services
- bedrock
- claude
- cloudformation
- dynamodb
- github
- lambda
- python
- react
- sam
- shadcn
- tailwind

Log in or sign up for Devpost to join the conversation.