Inspiration
The grand adventures of mythology might seem distant, but a far more impressive journey unfolds every day – the complex supply chains that bring the products we use to our hands. From raw materials to finished goods, a single smartphone or pair of shoes traverses continents, undergoing incredible transformations. This project explores that journey.
What it does
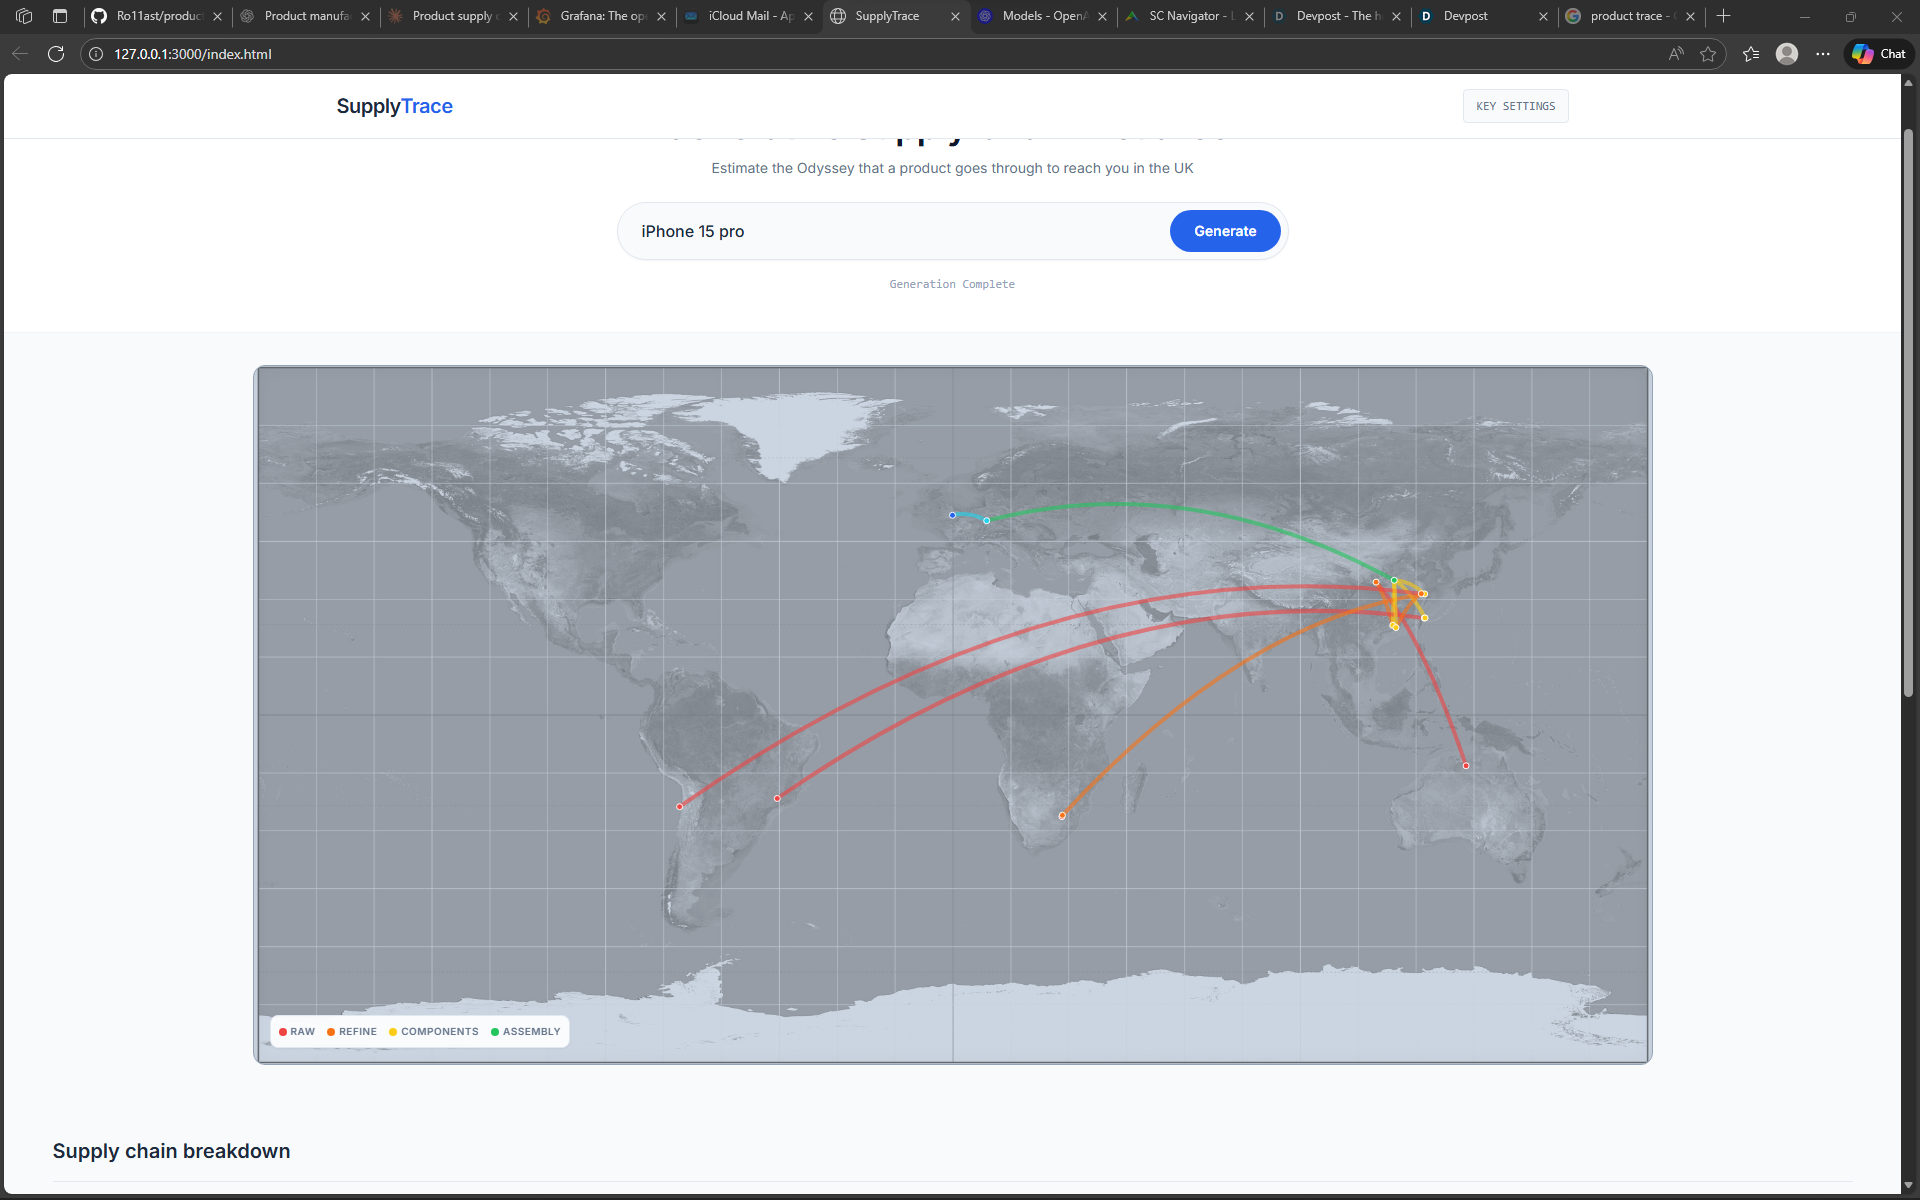
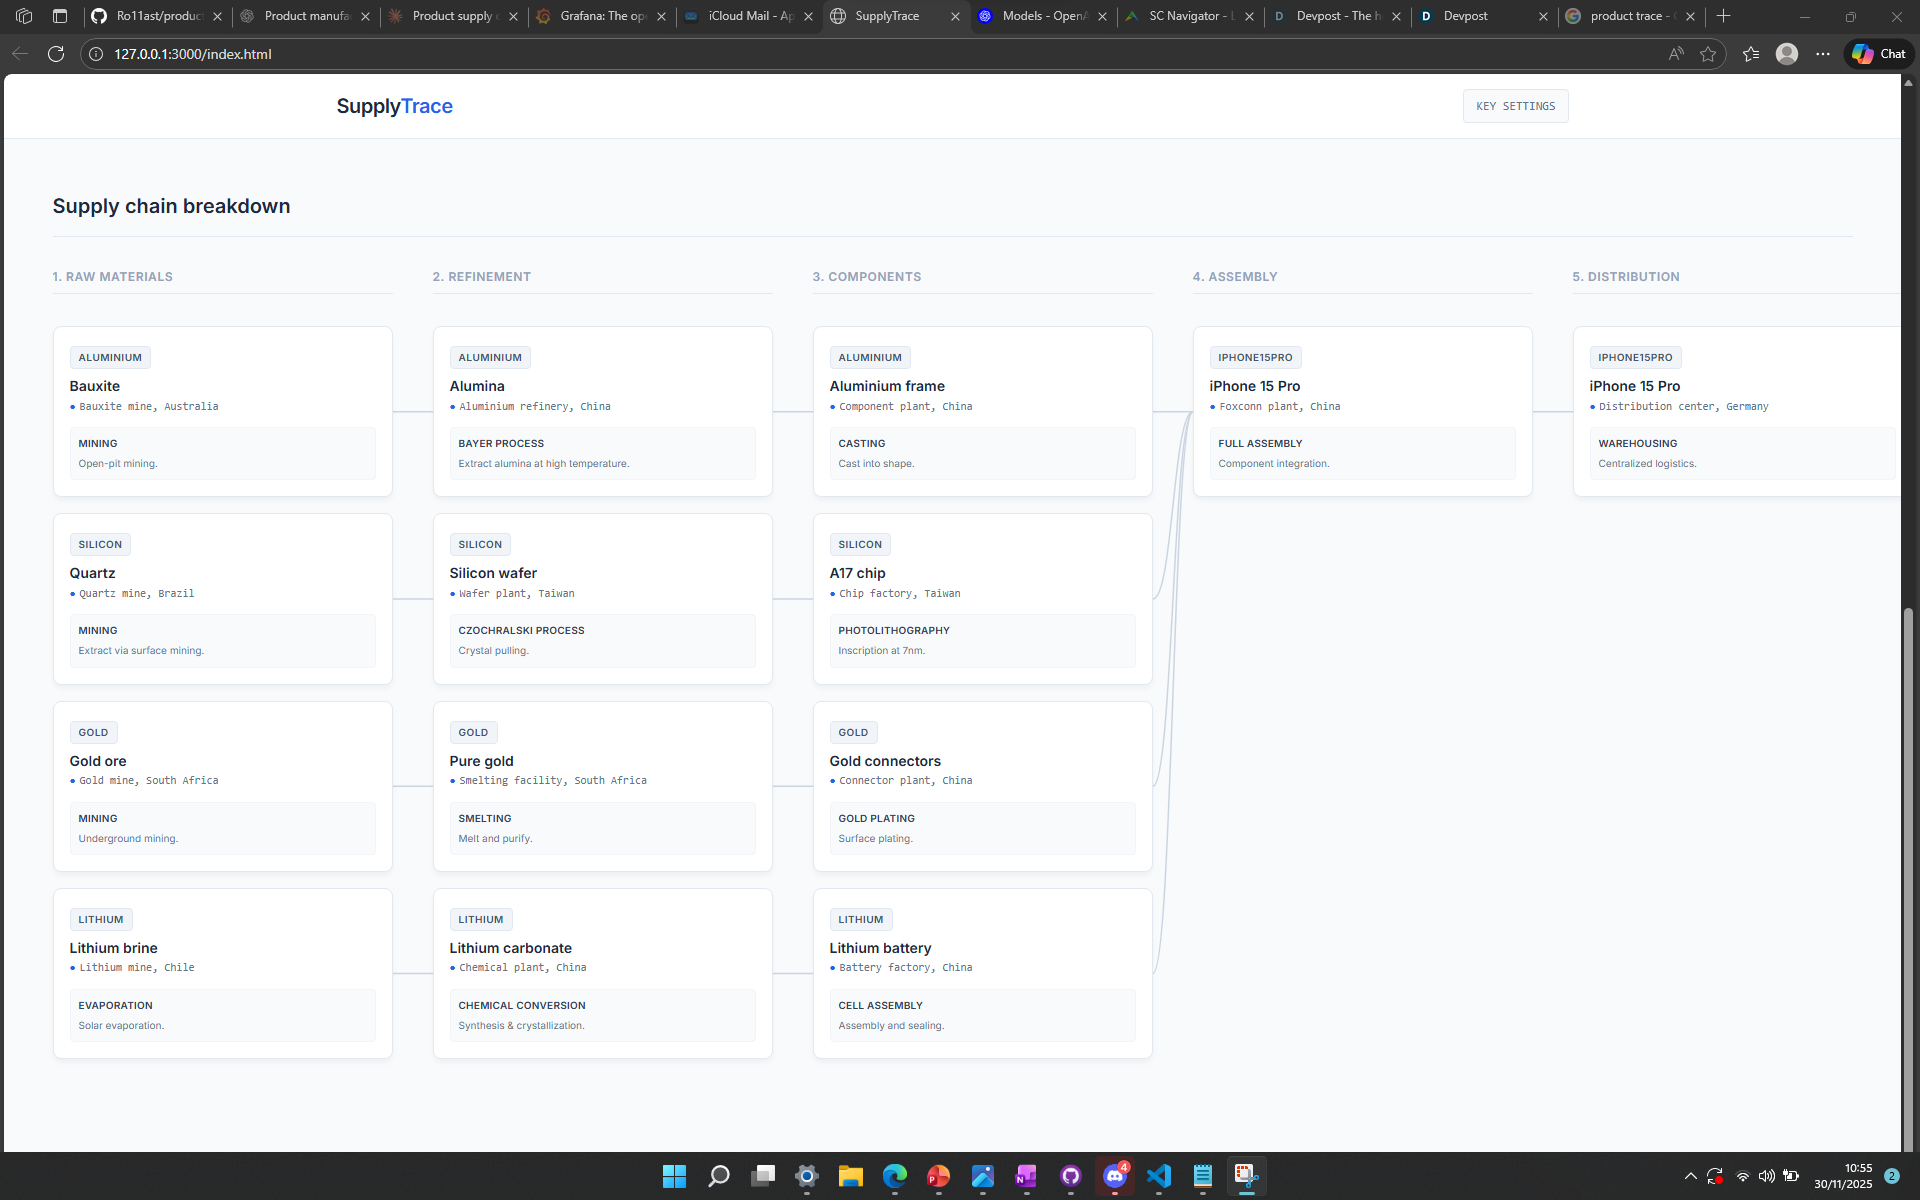
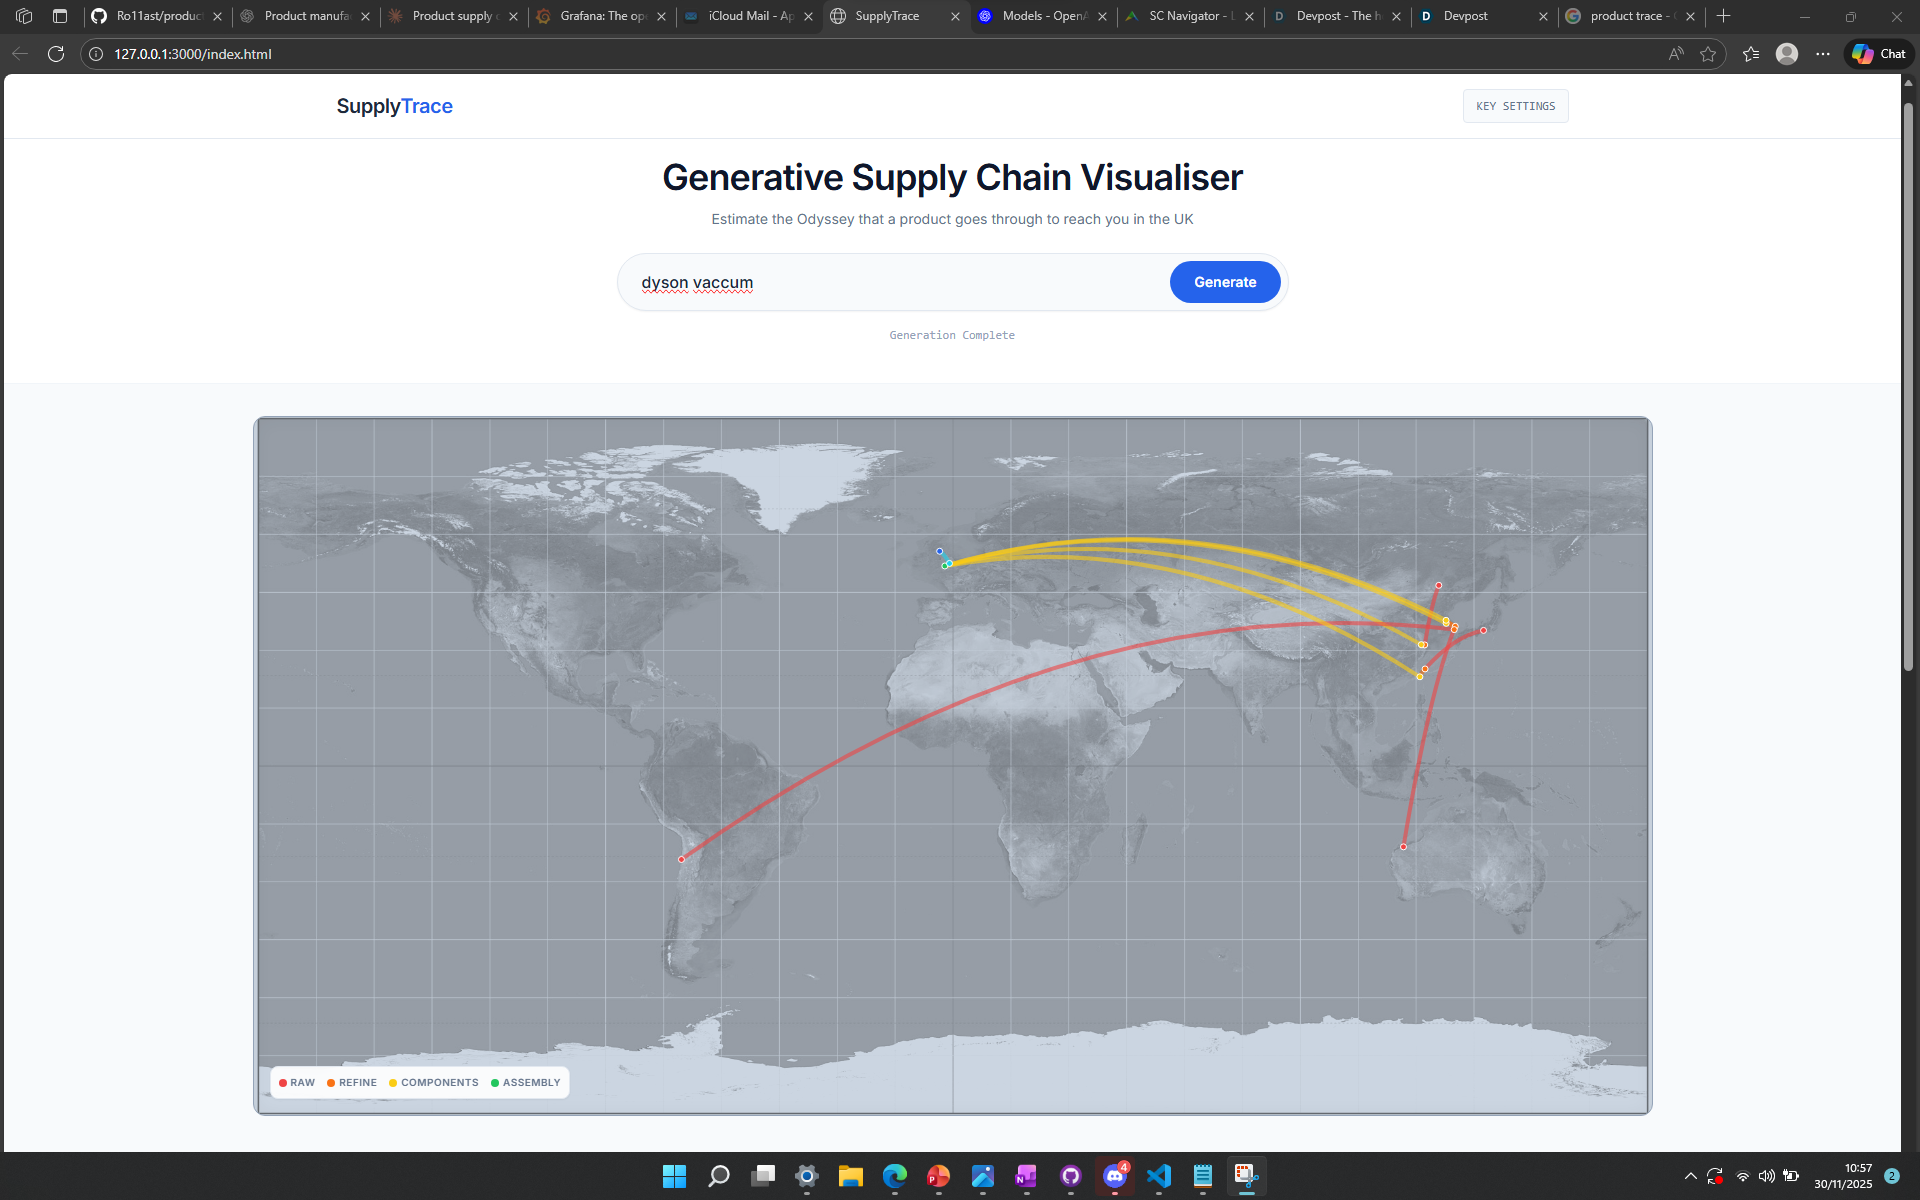
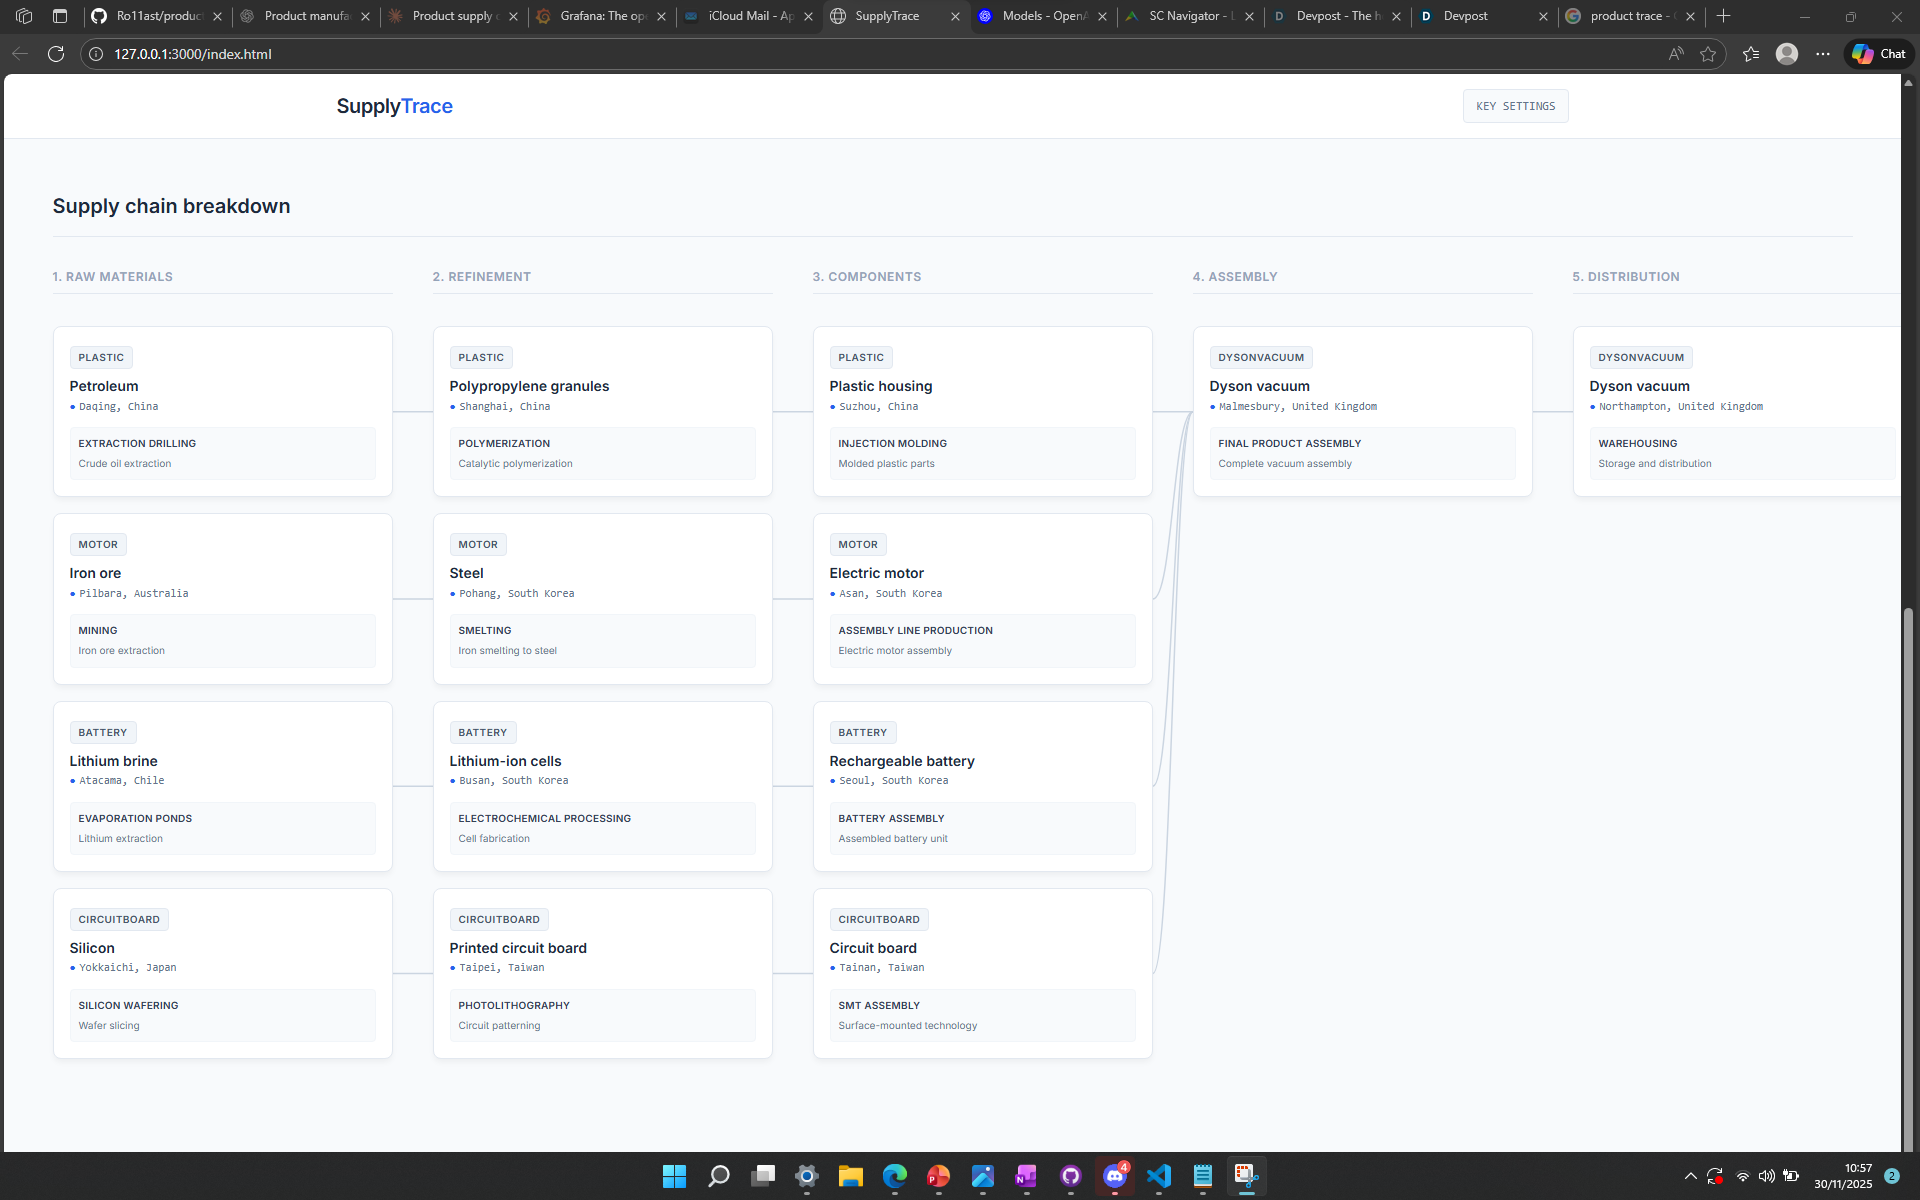
SupplyTrace is a web application that generates interactive supply chain visualisations. Users input a product, and the application deconstructs it into its raw materials, refinement processes, and components, geographically linking each to its most likely industrial hub. The results are presented on an interactive global map, highlighting the intricate network that connects resources, factories, and consumers. An accompanying flow diagram provides an alternative view of the supply chain, further enhancing understanding.
How we built it
The core of SupplyTrace lies in leveraging the power of OpenAI's GPT models. We developed specific prompts to dynamically generate data related to raw materials, locations, and components. This information is then visualised using the HTML Canvas API. To accurately represent the curvature of the Earth, we implemented custom plotting logic, drawing points and lines to create a geographically accurate representation of the product's journey.
Challenges we ran into
- Taming the AI Output: Ensuring the raw data from GPT could be reliably formatted for visualisation required careful prompt engineering and data parsing techniques.
- Canvas Interaction on a Curved Surface: Detecting mouse hover events accurately over curved lines on the Canvas presented a unique challenge.
- Geographic Accuracy: Correctly plotting locations on the map required careful consideration of map projections and coordinate transformations.
Accomplishments that we're proud of
The transformation of linear AI output into a linked, interactive graph.
What we learned
This project reinforced the importance of precise prompt engineering for generating consistent and reliable AI outputs.
What's next for Supply Trace
Future iterations of SupplyTrace will integrate a dashboard to provide comprehensive data analysis. This will include metrics such as total travel distance, carbon footprint calculations, and total time taken for completion, enabling users to gain deeper insights into the environmental and economic impact of supply chains.
Built With
- css
- html
- javascript
- openai


Log in or sign up for Devpost to join the conversation.