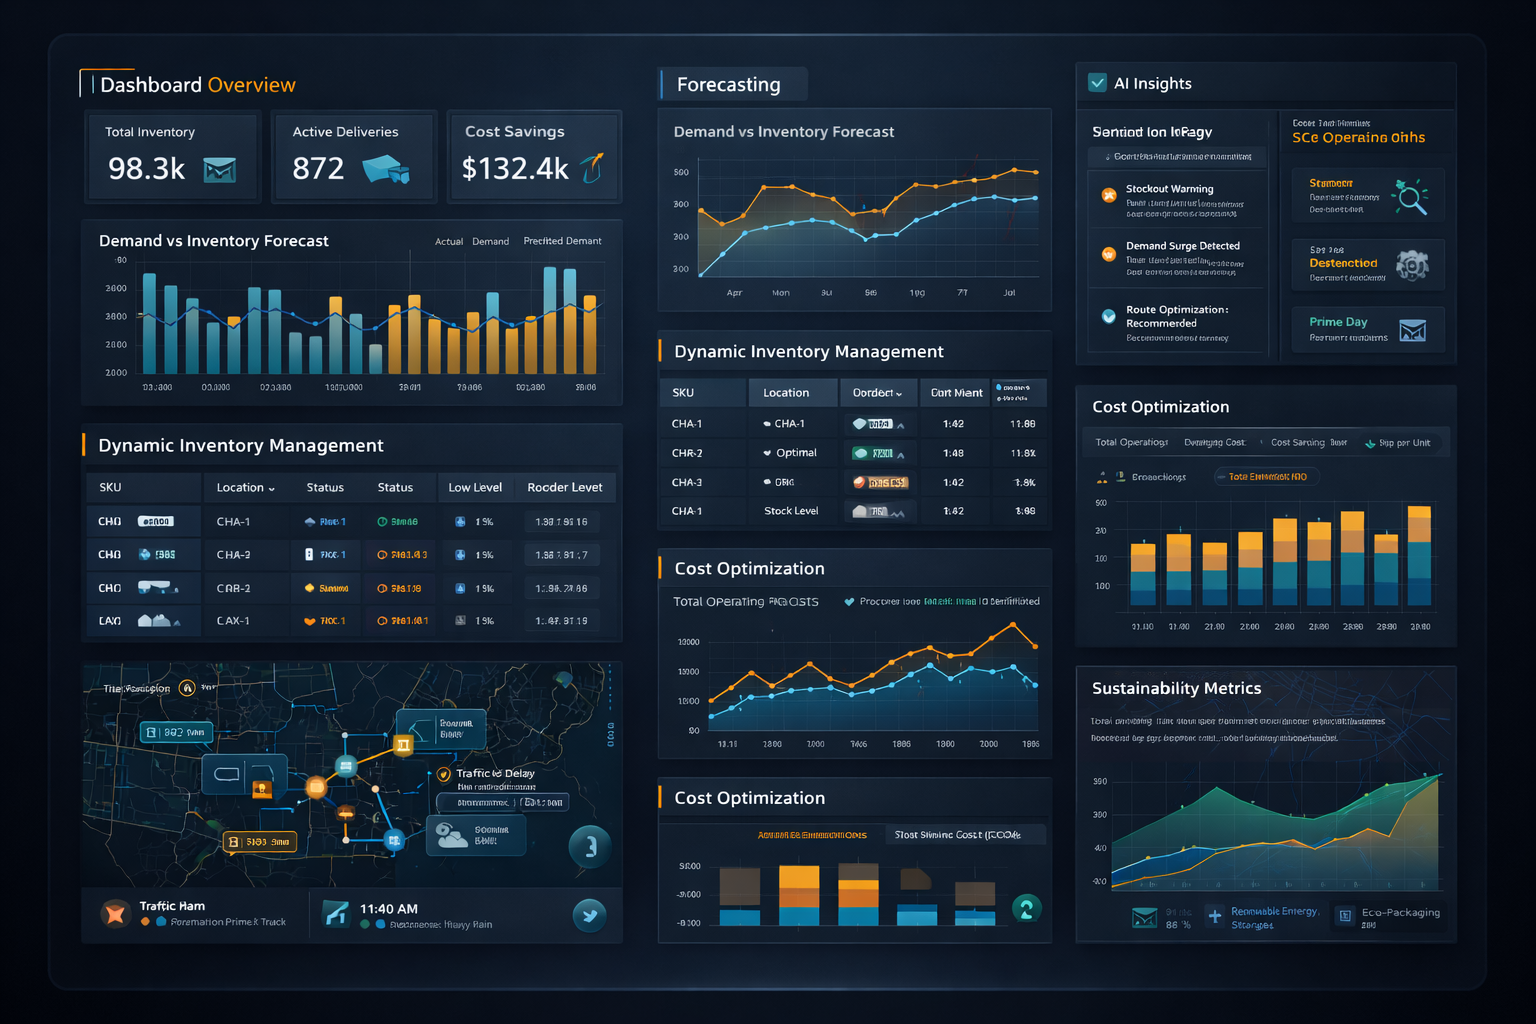
What it doesDashboard Overview: A centralized view featuring key performance indicators (Total Inventory, Active Deliveries, Cost Savings) and a "Demand vs Inventory Forecast" chart. It also includes an "AI Insights" section simulating Amazon Nova AI's real-time alerts for stockouts, demand surges, and route optimizations.
Forecasting: A dedicated view for predictive analytics, featuring a line chart that compares actual sales against AI-predicted forecasts, along with key drivers affecting demand (e.g., Prime Day, Weather Patterns). Dynamic Inventory Management: A data grid displaying real-time stock levels across the fulfillment network, including SKU details, locations, stock status (Optimal, Low Stock, Critical), and reorder points. Route Optimization: A live tracking view for active deliveries, showing estimated times of arrival (ETAs), vehicle types, and real-time alerts for delays or traffic incidents. Cost Optimization: A financial breakdown showing total operating costs, identified savings, and shipping costs per unit, visualized with a stacked bar chart for procurement, shipping, and storage costs over time. Sustainability Metrics: A dashboard tracking progress towards The Climate Pledge, featuring metrics on carbon footprint, renewable energy usage, and eco-packaging, along with an area chart tracking CO2e emissions against target goals. The application is built using React, Tailwind CSS for styling (incorporating an Amazon-inspired color palette), Recharts for data visualization, and Lucide React for iconography. flag
Built With
- 2.3%
- 97.1%
- css
- html
- typescript

Log in or sign up for Devpost to join the conversation.