Inspiration
- Sanctions, tariffs, and geopolitical shocks hit small/medium firms hardest because they lack supply-chain visibility.
- Companies cannot quickly understand who depends on which country or facility until disruption already happens.
- We wanted a tool that makes global trade risk understandable and actionable.
What it does
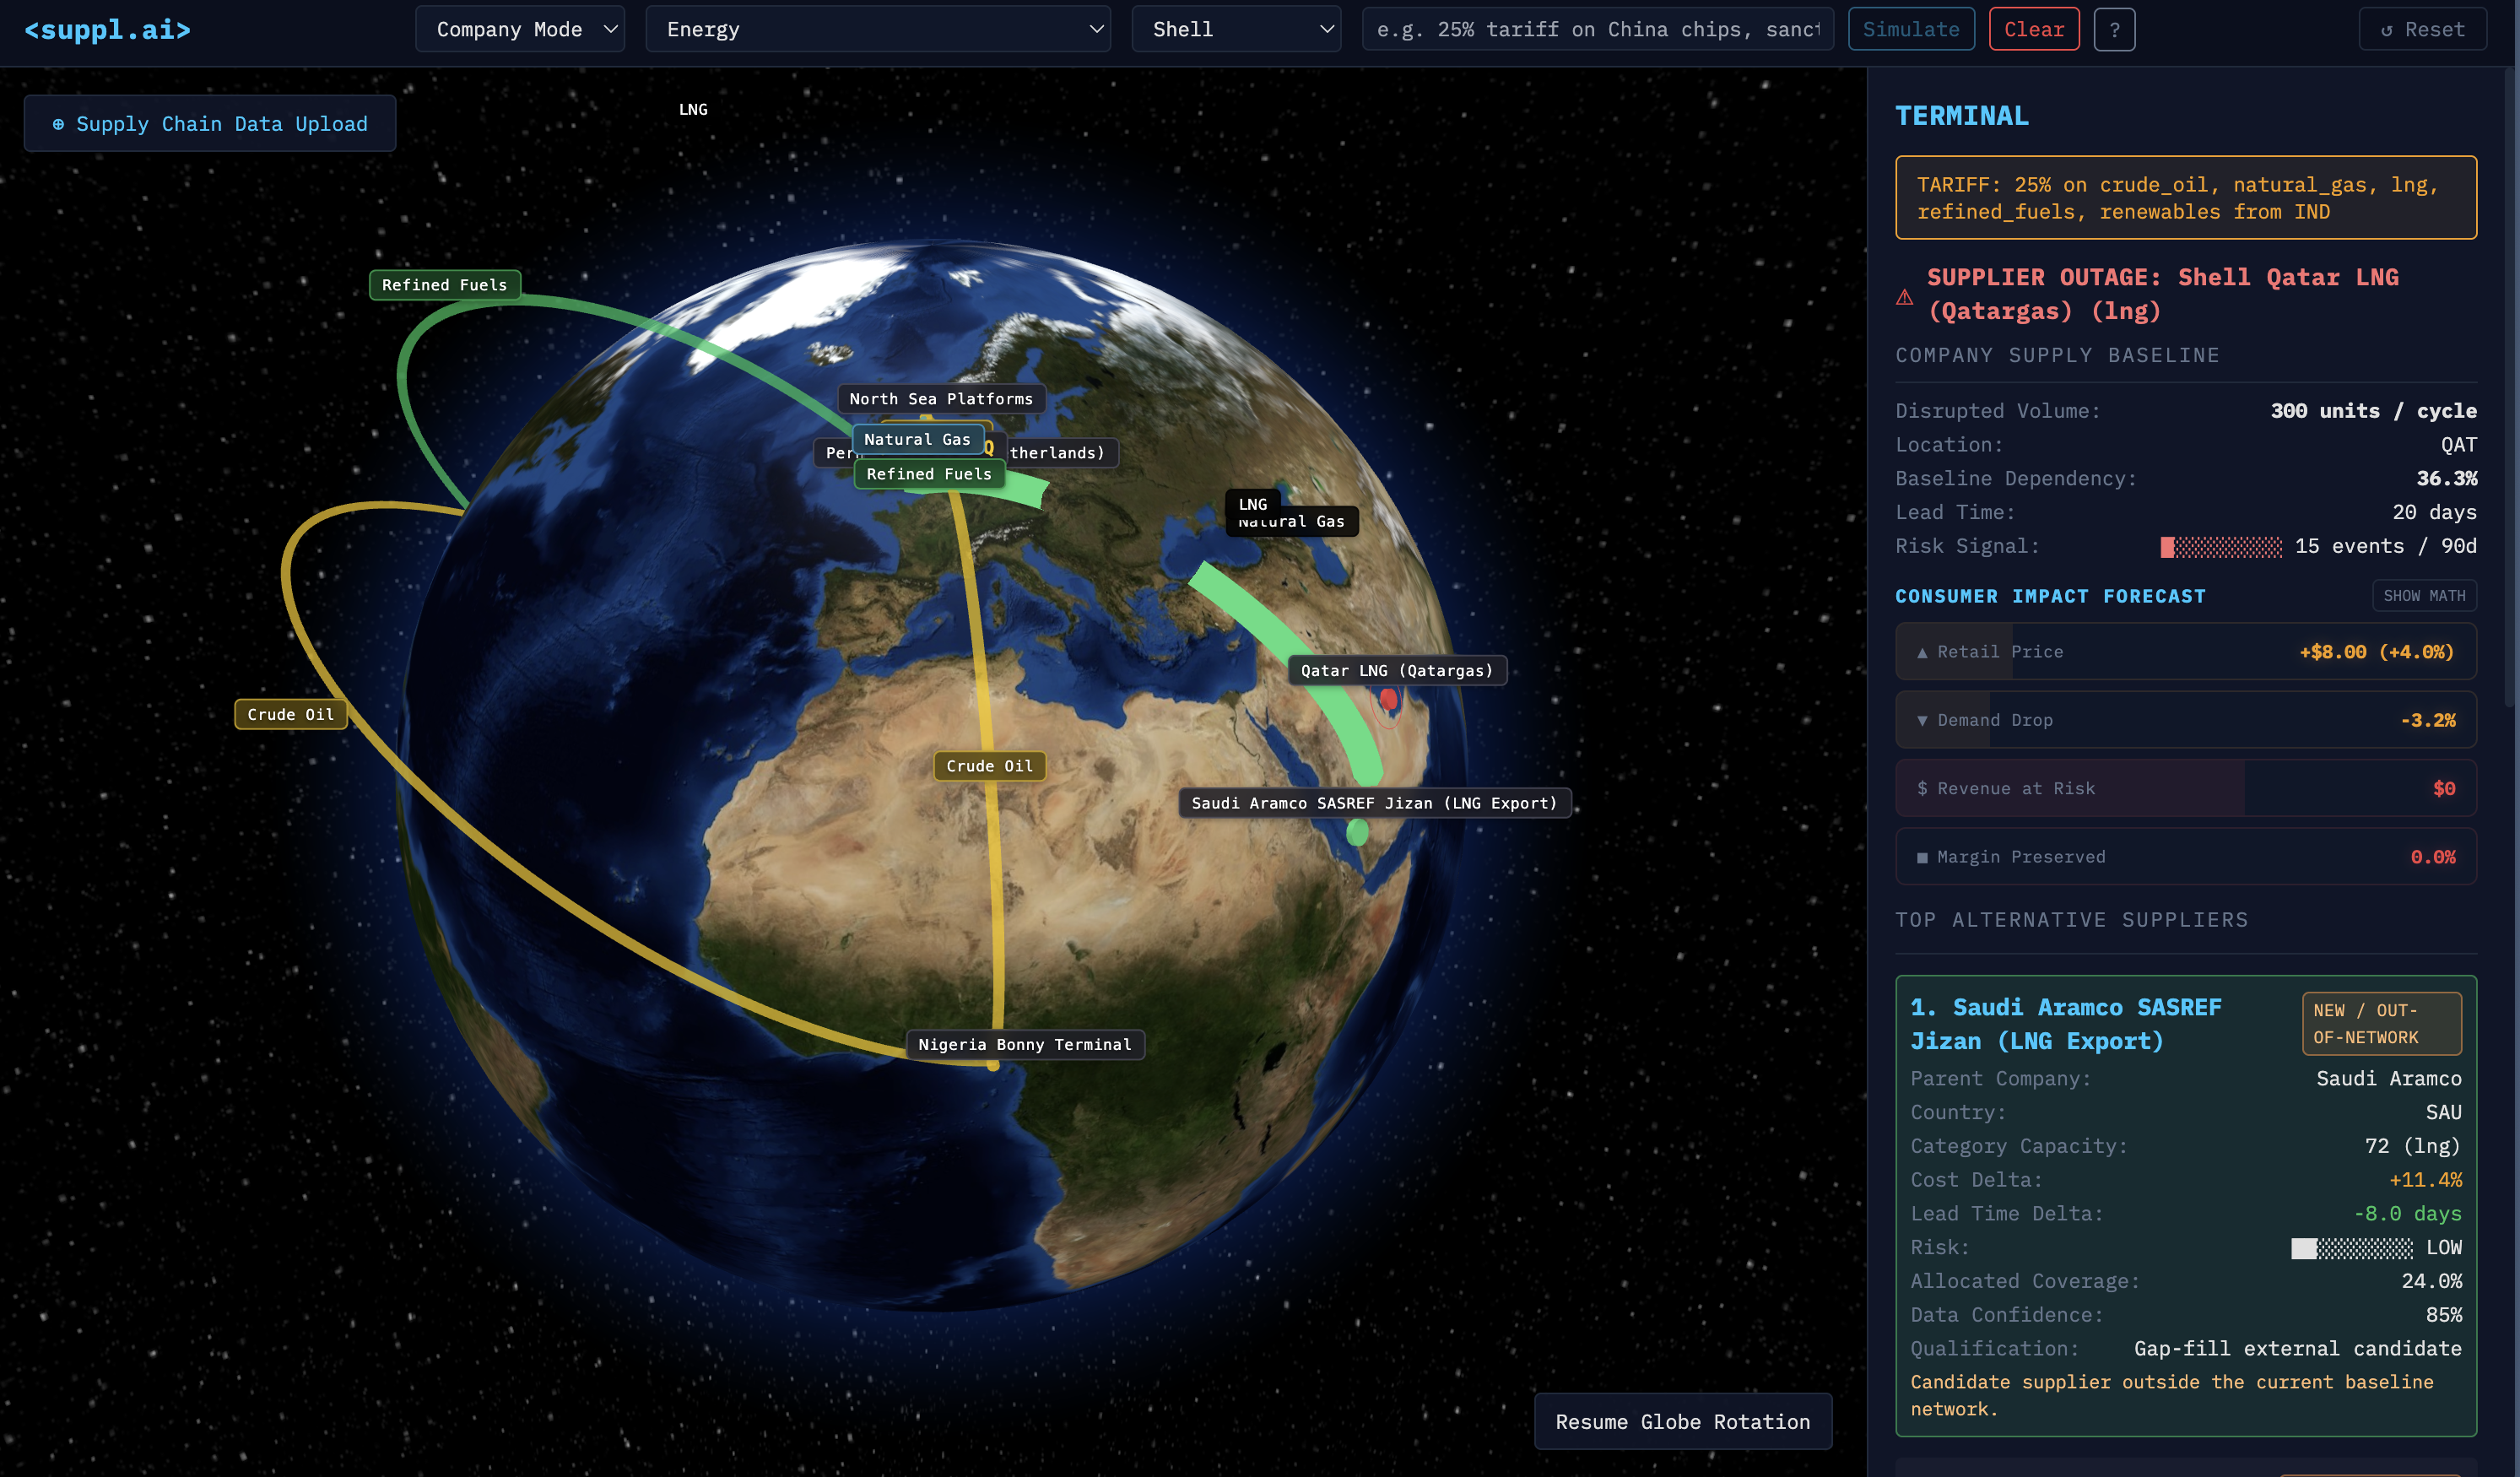
- Builds an interactive digital twin of a company’s supply chain.
- Simulates tariffs, sanctions, and supplier outages.
- Recommends alternative sourcing routes and estimates consumer impact (cost/speed/risk).
Tech Stack
Frontend: React 18 + Vite + Tailwind CSS Visualization: Globe.gl / Three.js (interactive 3D supply chain mapping) AI/NLP: Google Gemini 2.5 Flash-Lite (natural language macro event parsing) Database: MongoDB (persistent storage for supply chain networks) Data Pipeline: Python (graph construction, validation, supplier catalog ingestion)
## How It Works — Data Architecture
Suppl.ai uses a tiered data resolution strategy:
In-Network (Local Graph) — Each anchor company has a pre-built supply chain graph with nodes (suppliers, facilities) and edges (volume, cost, lead time) stored in MongoDB. When a user queries a disruption, we first resolve alternatives from this local catalog — known suppliers, known costs, known risk scores.
Cross-Network Discovery — When a node is disrupted and no suitable in-network alternative exists, we query MongoDB across other company supply graphs to discover suppliers that serve the same category but aren't in the anchor company's current network. This is our "discovered suppliers" layer.
Live Enrichment (API Fallback) — When structured data isn't available:
- Gemini API parses free-text macro events (e.g., "US imposes 25% tariff on Chinese semiconductors") into structured disruption parameters (affected countries, categories, severity) in real time. A regex-based parser serves as offline fallback.
- GDELT-sourced risk scores and real-world tariff rate data supplement the graph with live geopolitical context.
Supplier Graph (Country-Level) — A global trade network with export volumes, tariff rates, and risk indices provides the backbone for country-mode analysis when company-specific data isn't loaded.
## Custom Data Pipeline
Suppl.ai includes a Python-based ingestion pipeline that allows any company to be uploaded and analyzed:
Graph Construction (
build_company_graph.py) — Raw supplier data (from SEC filings, public disclosures, or user uploads) is parsed into a standardized graph format. Each node is enriched with geographic coordinates, capacity indices, lead times, unit costs, and category labels.Validation (
validate_company_graph.py) — Graphs are validated for structural integrity — ensuring all edges reference existing nodes, required attributes are present, and cost/volume figures fall within plausible ranges.Supplier Catalog Ingestion (
load_discovered_supplier_catalog.py) — A curated catalog of external suppliers is loaded and indexed by category and region, forming the pool of out-of-network alternatives available during disruption analysis.MongoDB Persistence — Validated graphs are stored in MongoDB as document collections, enabling fast retrieval by company, category, or region — and allowing cross-network queries during supplier discovery.
## Matching Algorithm
When a disruption is triggered, Suppl.ai's recommendation engine scores alternative suppliers using a multi-factor matching algorithm:
- Category match — Only suppliers producing in the same category as the disrupted node are considered
- Effective cost index — Combines unit cost with applicable tariff rates for the destination market
- Lead time proximity — Prioritizes suppliers with shorter delivery windows
- Capacity headroom — Filters out suppliers already at capacity across the network
- Geopolitical risk score — Penalizes suppliers in regions with elevated instability (GDELT-derived)
Matches are ranked by a weighted composite score and surfaced as interactive recommendations on the globe, where users can click to select an alternative and see the rerouted supply arc and updated consumer impact in real time.
## APIs & Data Sources
| Layer | Source | Purpose | |-------|--------|---------| | AI/NLP | Google Gemini 2.5 Flash-Lite | Parse natural language disruption events into structured params | | Trade Data | UN Comtrade / WITS | Export volumes, trade relationships | | Risk Scoring | GDELT Project | Geopolitical instability indices per country | | Tariff Data | WTO / USTR published rates | Category-level tariff rates by country pair | | Supply Chains | SEC filings, public disclosures | Supplier-buyer relationships for 20+ companies | | Database | MongoDB | Persistent storage and cross-network querying of supply chain graphs |
Accomplishments that we're proud of
- End-to-end pipeline: raw data → supply-chain graph → live simulation → recommendations.
- Real-time visualization of global sourcing routes on a 3D globe.
- Users can upload their own company data and immediately run geopolitical scenarios.
What we learned
- Most companies don’t know their second- and third-tier suppliers.
- Visualizing risk is far more understandable than spreadsheets.
- Even simple optimization models provide meaningful decision guidance.
What's next for suppl.ai
- Automated ingestion of public supplier disclosures and shipping data.
- More accurate pricing/lead-time prediction using historical events.
- Collaboration tools so companies can plan contingency strategies proactively.

Log in or sign up for Devpost to join the conversation.