-
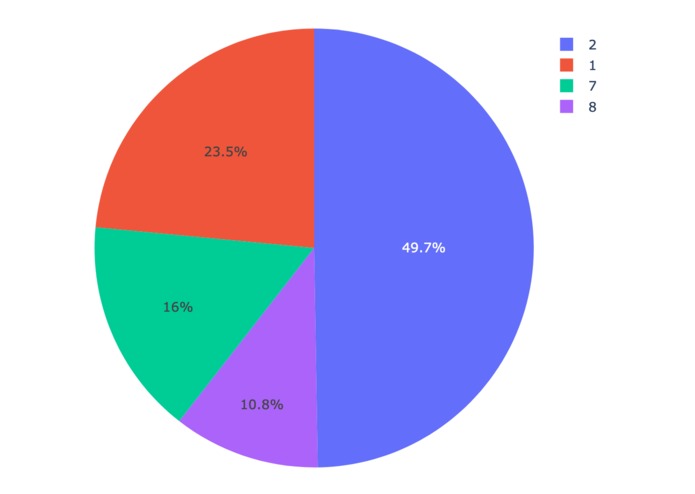
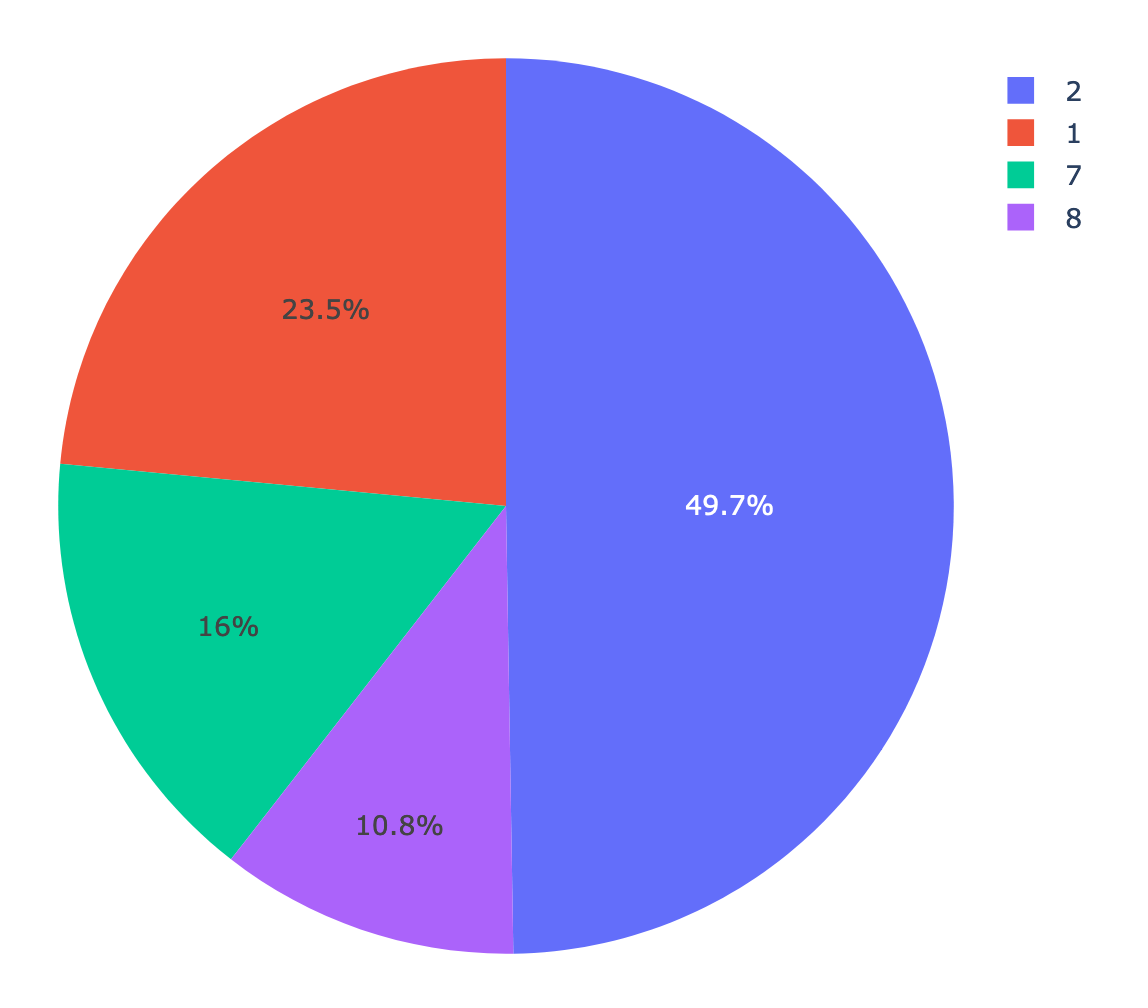
Pie chart of expenditure data by category
-
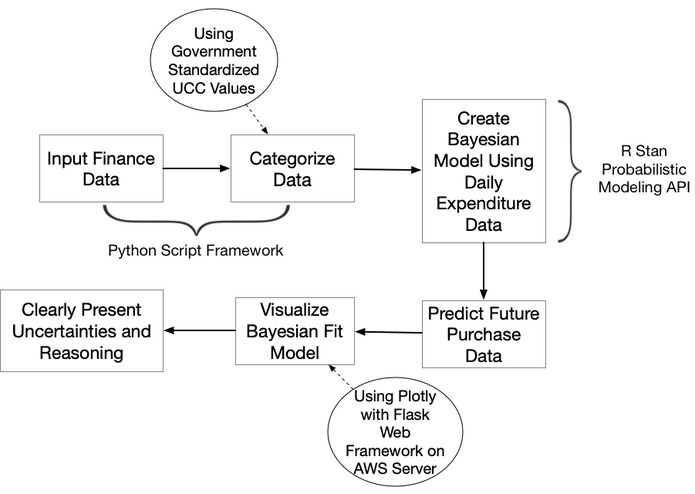
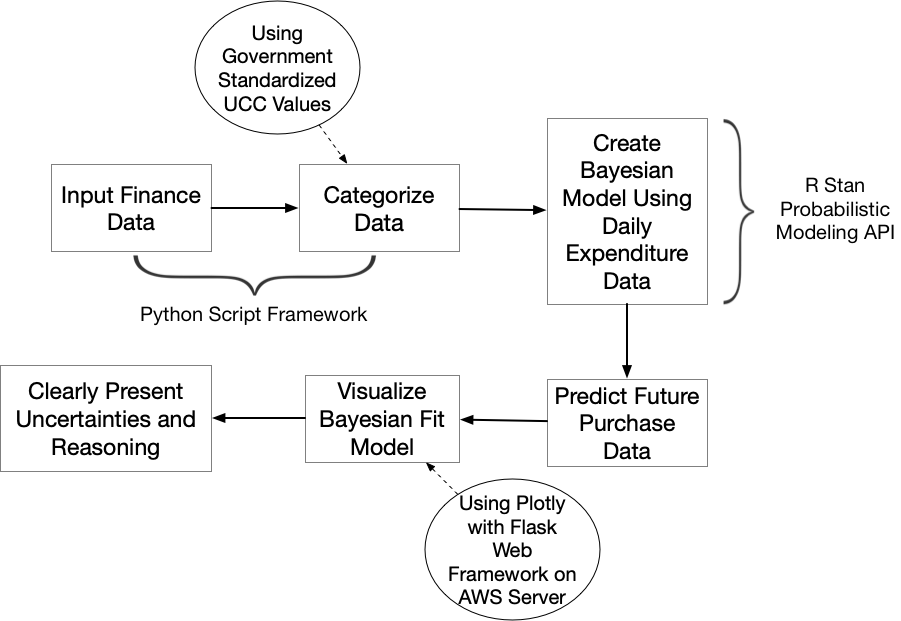
Flow chart of our system
Inspiration
While there are many projects which attempt to predict and manage budgets, few really have transparency into the models in use. We set out to emphasize model understandability in an expenditure prediction setting.
What it does
We have a webpage running what were supposed to be interactive plotly graphs. Unfortunately we did not quite have enough time to implement all the functionality or even make all of the intended graphs.
How we built it
We used flask, plotly, python, javascript, r, and stan to build this project.
Challenges we ran into
We had little experience with web development or web visualizations. Implementing anything in this arena took almost all of our time.
Accomplishments that we're proud of
We managed to implement three models of varying complexities and accuracies. They are all closely related to linear regression, however in a Bayesian setting, so we were able to implement probability distributions which would not be accessible in a frequentist context. We implemented a simple regression model, a hierarchical regression model, and a mixture model between hierarchical regression and a constant 0 distribution. We also worked through a large list of different spending categories and manually classified them down in to 8 larger categories.
What we learned
We learned a significant amount about flask and data manipulation. We used data from the consumer expenditure survey from 2008-2011 to train and predict on. While it is a fairly clean data set, we still had to put in significant effort to wrangle it to appropriate forms.
What's next for Suporb
We still have features in our original plan which are unimplemented. Hopefully we can work through those and get a great demo!

Log in or sign up for Devpost to join the conversation.