-

Logo
-
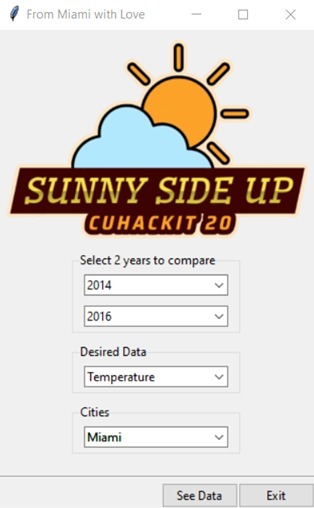
GUI1
-
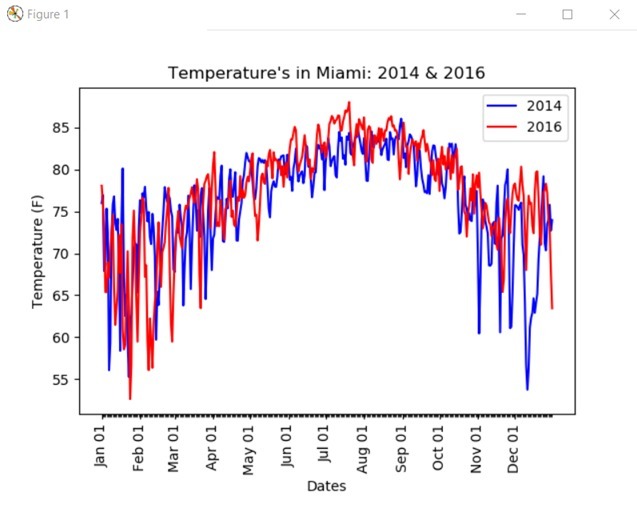
Graph1


Inspiration
What it does
Takes in past weather data for different cities and plots 2 different years-worth of data for comparison
How we built it
We used python as our base language, pandas and numpy to parse/analyze data, and matplotlib for plotting the data.
Challenges we ran into
Creating a GUI for ease of access for users, how to graph a large set of data
Accomplishments that we're proud of
We were able to not only successfully graph the data chosen by the user but also create a working GUI for the user.
What we learned
We learned how to work with large datasets and how to create GUIs.
What's next for Sunny Side Up
More data :D


Log in or sign up for Devpost to join the conversation.