-
-
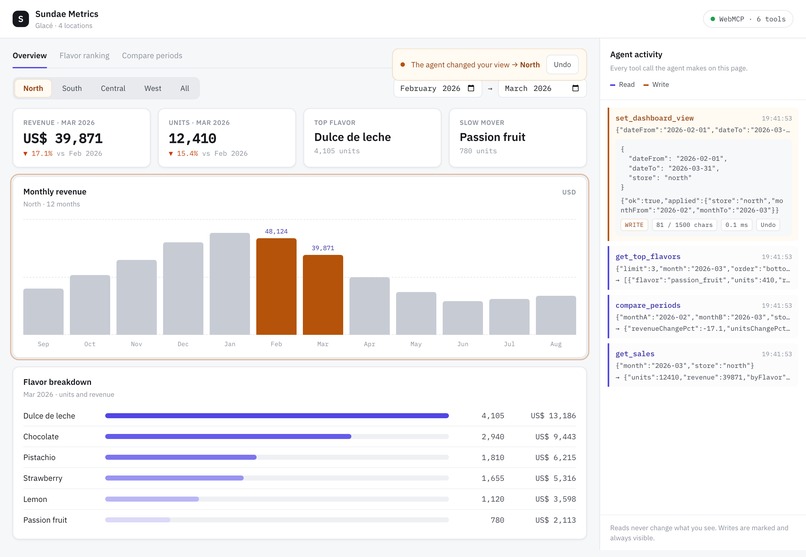
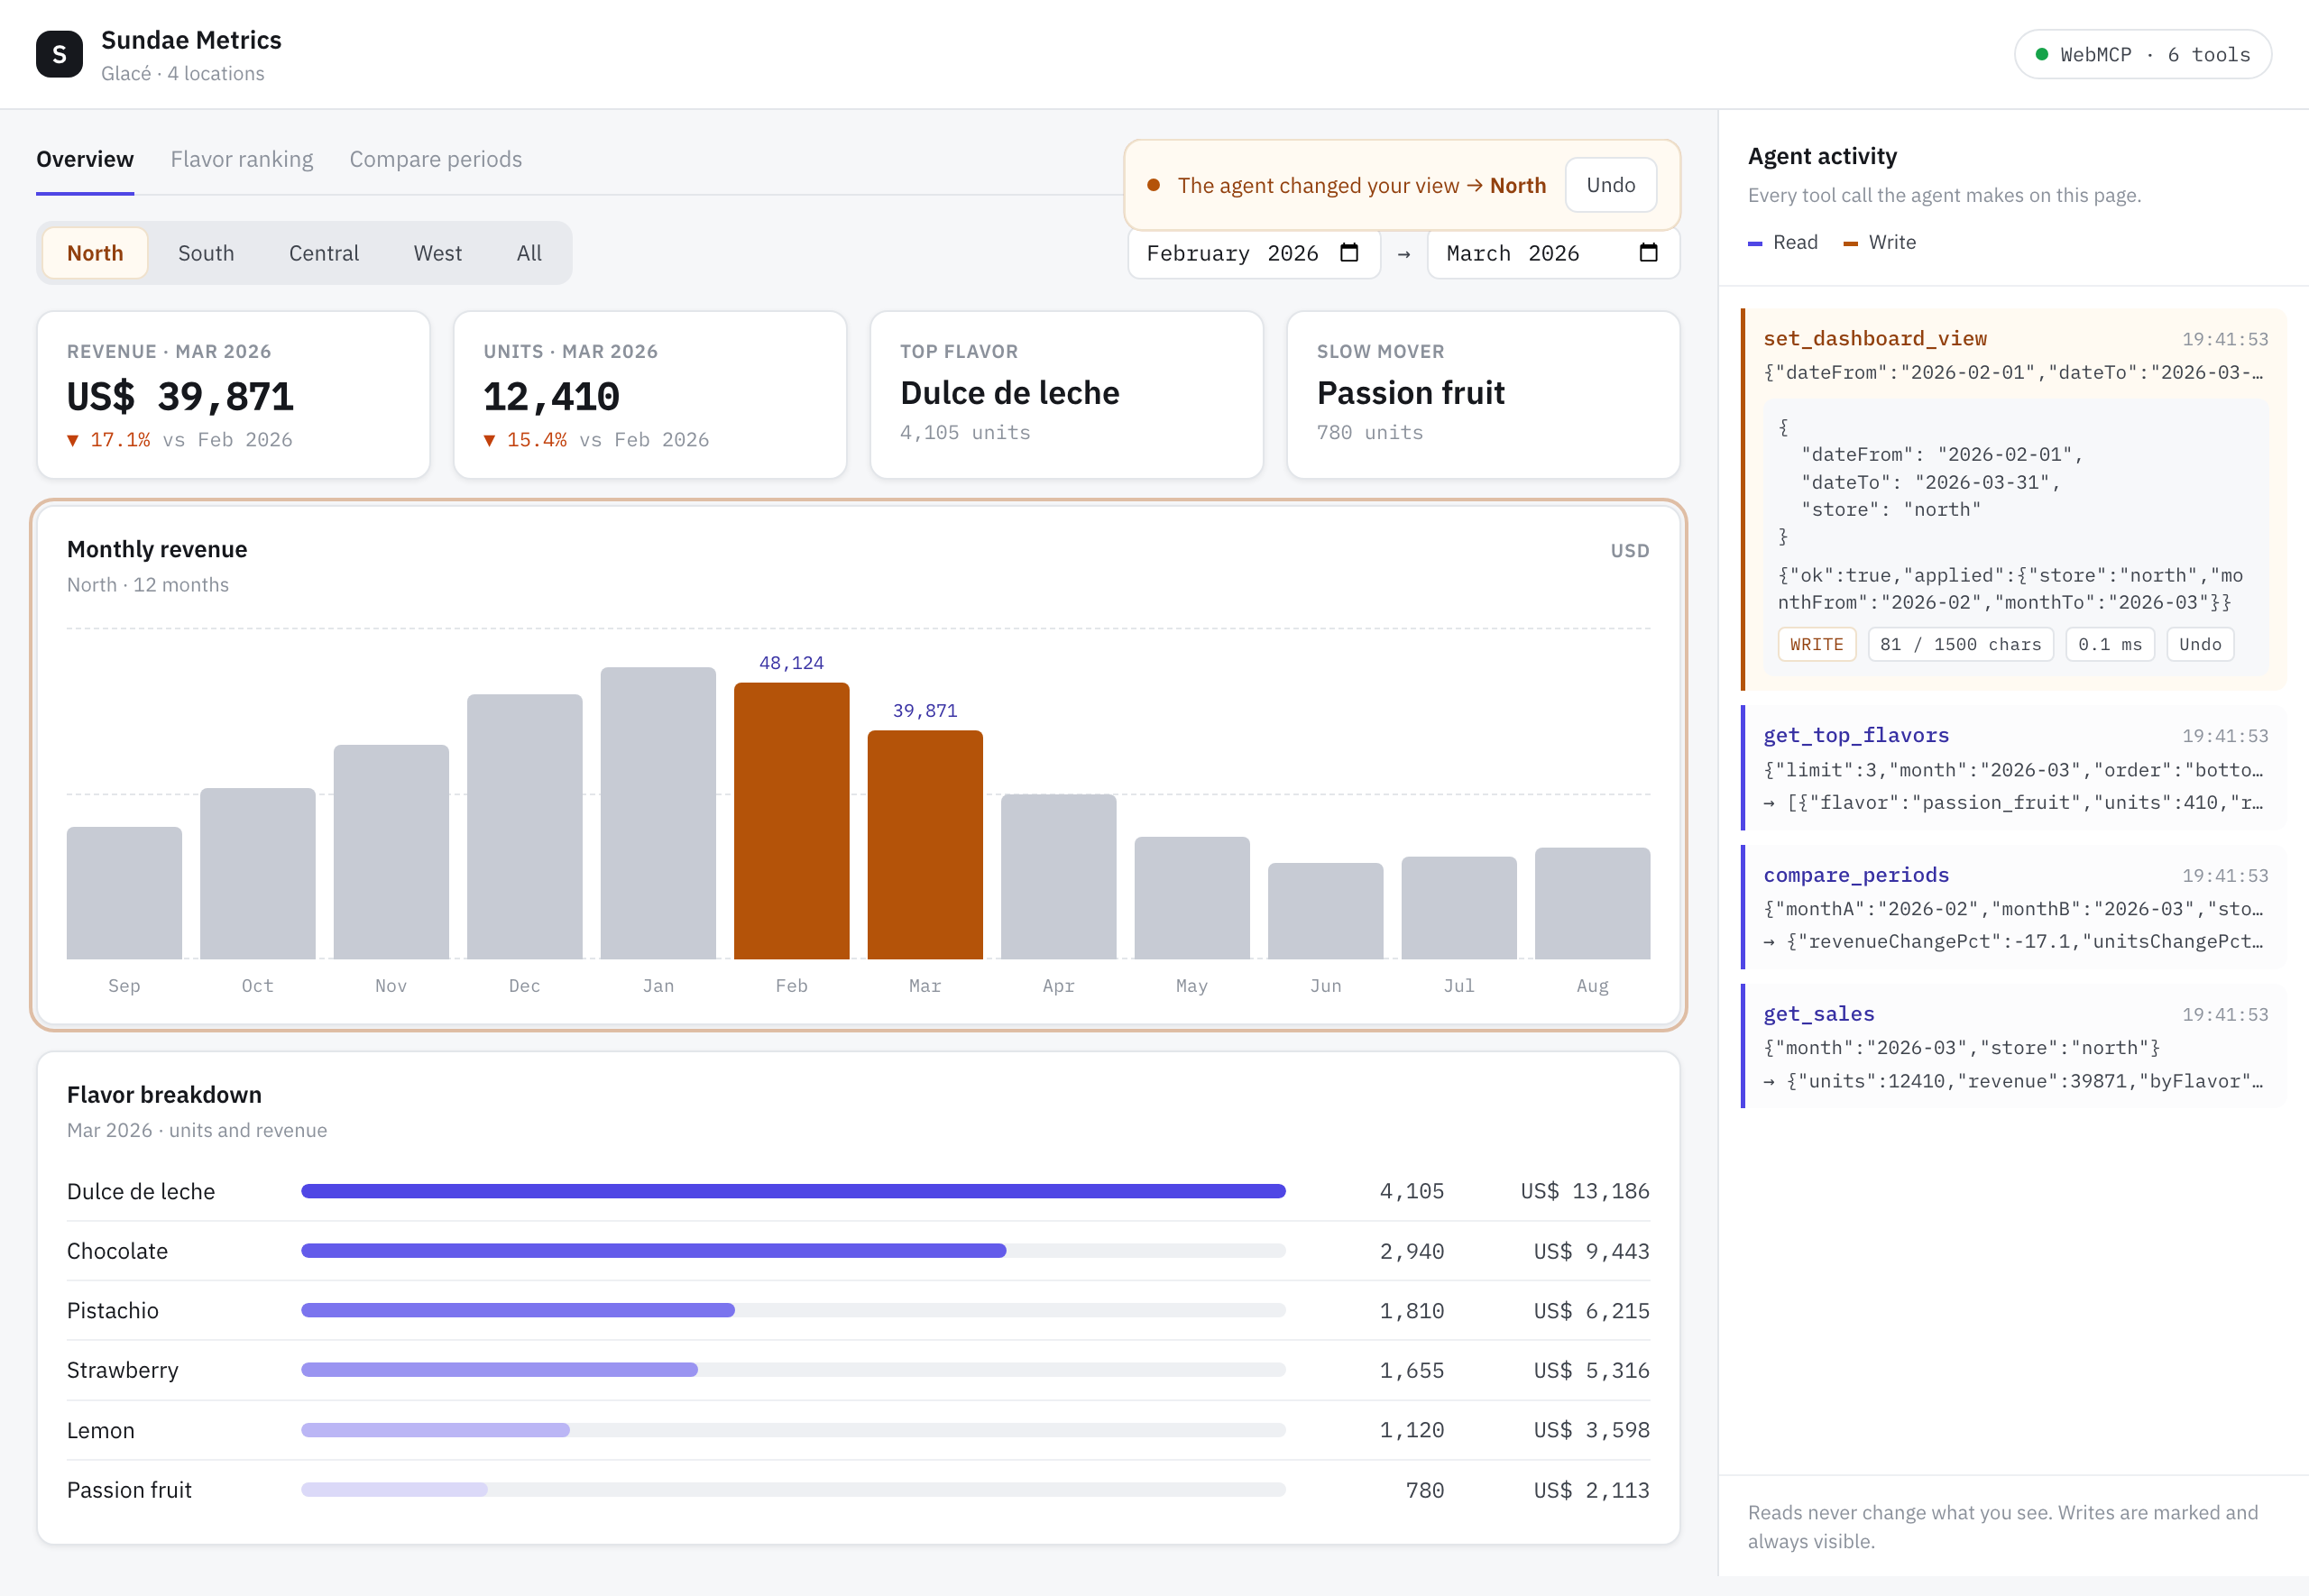
An agent just changed the dashboard: the amber WRITE entry in the Agent activity rail, with an Undo on it.
Inspiration
Ice cream chains are the smallest business that genuinely needs analytics: four shops, six flavors, wildly seasonal, and no data analyst. The products already sold to them - HioPOS, Sipos, GETPOS, Vendty - all ship the same dashboard, and every question that dashboard cannot answer ends the same way: an Excel export.
An assistant looking at that screen is in a worse position than the owner. Ask it "how much did North's sales change between February and March?" and, without WebMCP, it has to drive the whole interface: find the store selector in the DOM, synthesize a click, wait for a re-render with no signal that it finished, set the month range through a native picker, read the values back and do the arithmetic itself.
It gets there - and I measured that rather than assuming it, which is what the section below is about. What it cannot do is get there cheaply. An interface built for eyes makes an agent pay in clicks, re-renders and round trips for something the page already knows exactly.
What it does
Sundae Metrics is a sales dashboard for Glace, a fictional chain of 4 artisanal ice cream shops: 12 months x 4 locations x 6 flavors. It is a normal dashboard - KPI cards, a 12-month bar chart, a flavor breakdown, a compare-periods view.
The product is the layer underneath. The page registers 6 tools with document.modelContext.registerTool():
| Tool | What it does | readOnlyHint |
|---|---|---|
list_stores |
Lists the locations on this dashboard | true |
get_sales |
Exact units and revenue for one location in one month | true |
compare_periods |
Percentage change between two months | true |
get_top_flavors |
Flavor ranking - best sellers or slow movers | true |
get_summary |
Revenue across every location over a date range | true |
set_dashboard_view |
Changes what the user is looking at | false |
The February-to-March question becomes one call:
await compare_periods({ store: "north", monthA: "2026-02", monthB: "2026-03" });
// {"revenueChangePct":-17.1,"unitsChangePct":-15.4}
And the dataset carries a case the chart actively hides. In January 2026 the North location's pistachio sales collapse from 2,099 units to 554 - down 74%, from the 3rd best seller to the 6th - a supply shortage. But January is also North's highest-revenue month of the year: the other five flavors each rise about 24% and absorb the gap, so the tallest bar on the chart is the one hiding the problem. Nothing on screen shows it. get_top_flavors({store: "north", month: "2026-01", limit: 3, order: "bottom"}) shows it immediately.
set_dashboard_view runs the other way. Ask for the South location and the screen changes in front of you: the agent acts on the same interface the human is looking at, not on a copy of the data somewhere else.
The measurement
The demo video is not a mock-up. Both halves were filmed in the ChatGPT desktop app's built-in browser - same model, same question, same page, changing only ?webmcp=off:
| Without the tools | With the tools | |
|---|---|---|
| Time | 4 min 38 s | 36 s |
| Work | navigated the UI month by month, then asked permission to download the page's data file | 5 tool calls |
| Answer | pistachio 2,099 -> 554 (-74%) | same, "fell from third-best seller to last" |
Both are right, and that is the honest claim. Without the tools the agent still gets there - the chart prints its values as text, so it reads them. What it cannot do is get there cheaply. It also tried to escape the screen entirely: three minutes in, it asked to download the dashboard's JavaScript data file rather than keep reading the interface. That request was denied on camera, because bypassing the rendered page is precisely what a real app with a backend would not allow.
How I built it
Vite + React + TypeScript, client-side only, no backend. Plain CSS with custom properties, no Tailwind. The chart is twelve divs with percentage heights, no charting library. Two dev dependencies beyond the template: vitest and webmcp-types.
src/lib/queries.ts is the only place in the codebase that computes anything. The dashboard and the tools consume the same pure functions, so a number on the chart and a number returned by a tool cannot drift apart. 39,871 is what get_sales returns, what is printed on the March bar, and what the KPI card shows - one function, three consumers. 56 tests cover that layer, the state and the tool definitions.
State is a module-level store exposed through useSyncExternalStore - mutable from outside React, which is exactly what set_dashboard_view needs.
The dataset is generated by a seed script with no randomness at all: running it twice produces a byte-identical JSON, and the test file is the only place in the repo where the expected figures are written by hand. If the seed drifts, the tests fail.
Accomplishments I'm proud of
order: "bottom" is not decoration. The KPI those POS products actually sell to ice cream shops is "best sellers and slow movers", because owners use the second half to decide what to drop from the menu. It costs one parameter, not a seventh tool.
No tool carries untrustedContentHint, and that is a decision, not an omission. Every value comes from a committed seed file, so no tool output can carry third-party text an agent might read as instructions. The hint exists for tools that return content someone else wrote; claiming it here would be noise.
The Agent activity rail is the security answer, not chrome. How much a site should have to reveal about what an agent did on it is still open in the standard - prompt injection (webmcp#11) and hints for consequential actions (webmcp#176) are both unresolved. This dashboard's response is to make every call visible as it happens: tool name, input, output, elapsed time, output size against Chrome's 1,500-character ceiling, and an Undo on the one call that changed something. Indigo means the agent read; amber means the agent wrote. Nothing an agent does here is invisible.
Challenges I ran into
Chrome drops a malformed tool without raising anything. Exceed the name limit (30 chars), the tool description limit (500), a parameter description (150) or the output ceiling (1,500) and the tool is simply not registered - no error, no warning. annotations placed as a second argument instead of inside the tool object is ignored the same silent way. The fix was to compare getTools() against the six expected names after registering and log the difference, and to route every execute through one helper that truncates output to 1,500 characters.
The question you ask changes whether the agent finds the anomaly. Asked "look at the flavor breakdown and tell me if anything looks off", the tool-driven agent fetched January only and concluded the anomaly was passion fruit - the cheapest flavor per unit. It failed that way twice in a row. With one month of flavor data, 554 units is not remarkable; the agent without tools got it right precisely because navigating the UI forced it through December as well. Asking for the comparison explicitly fixes it without naming pistachio. That is a WebMCP design lesson, not a demo detail: a tool that answers one month invites a one-month answer. The wording that shipped, identical in both halves of the video: "For the North store, what happened to sales in January 2026? Compare the flavor breakdown against December and tell me if anything looks off."
Agents are not deterministic. Across five runs of the same question the figures never moved - 15,826 units, $50,800, pistachio 554 against 2,099 - but the conclusion was worded differently every time. The narration was written to whatever the agent actually said, rather than re-asking until a nicer sentence came out.
What I learned
That the interesting half of WebMCP is not exposing data - it is deciding what a tool is allowed to be. Six tools with one write among them, each one answering a question an owner would actually ask, beats twenty tools that mirror the internal data model. And the write tool is where the standard gets genuinely new: it is the first time an agent and a person can be looking at the same screen, and the agent can change it.
What's next for Sundae Metrics
Hourly granularity, channel mix (counter / dine-in / delivery), and a real backend behind the query layer - the tool contracts would not change, which is the point. The interesting open question is the trust model: the activity rail is one answer, but the standard has not settled on one yet.
Built With
- chatgpt
- chrome
- css
- javascript
- react
- typescript
- vercel
- vite
- webmcp

Log in or sign up for Devpost to join the conversation.