-
-
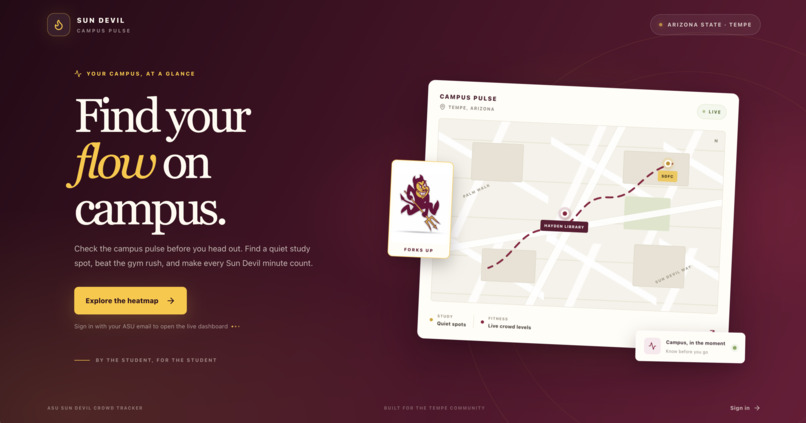
Landing Page
-
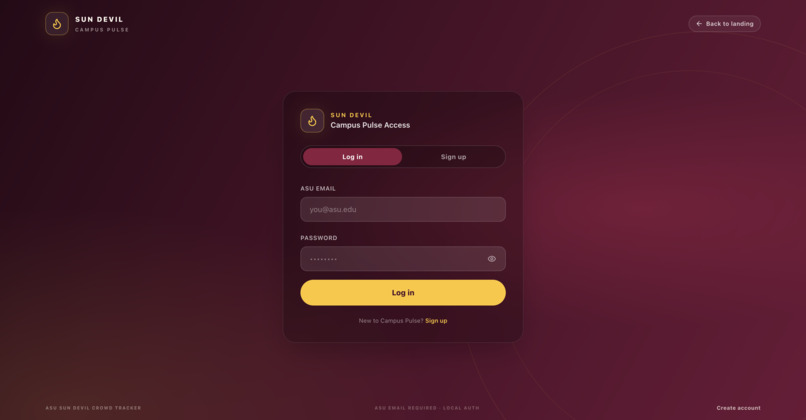
Login and Sign-Up
-
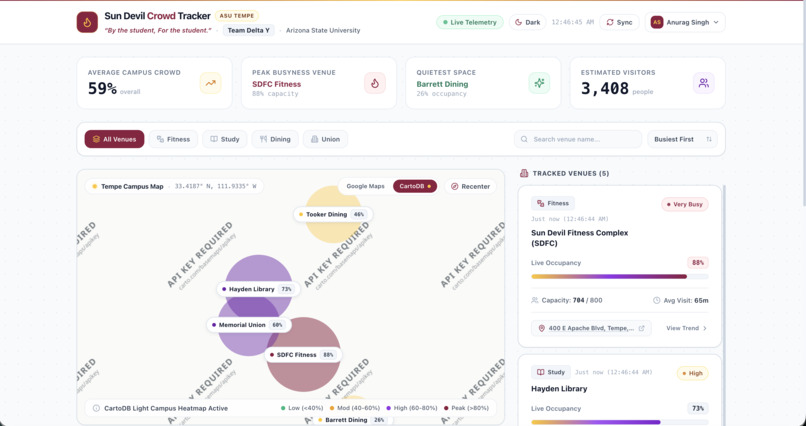
Complete Dash-Board
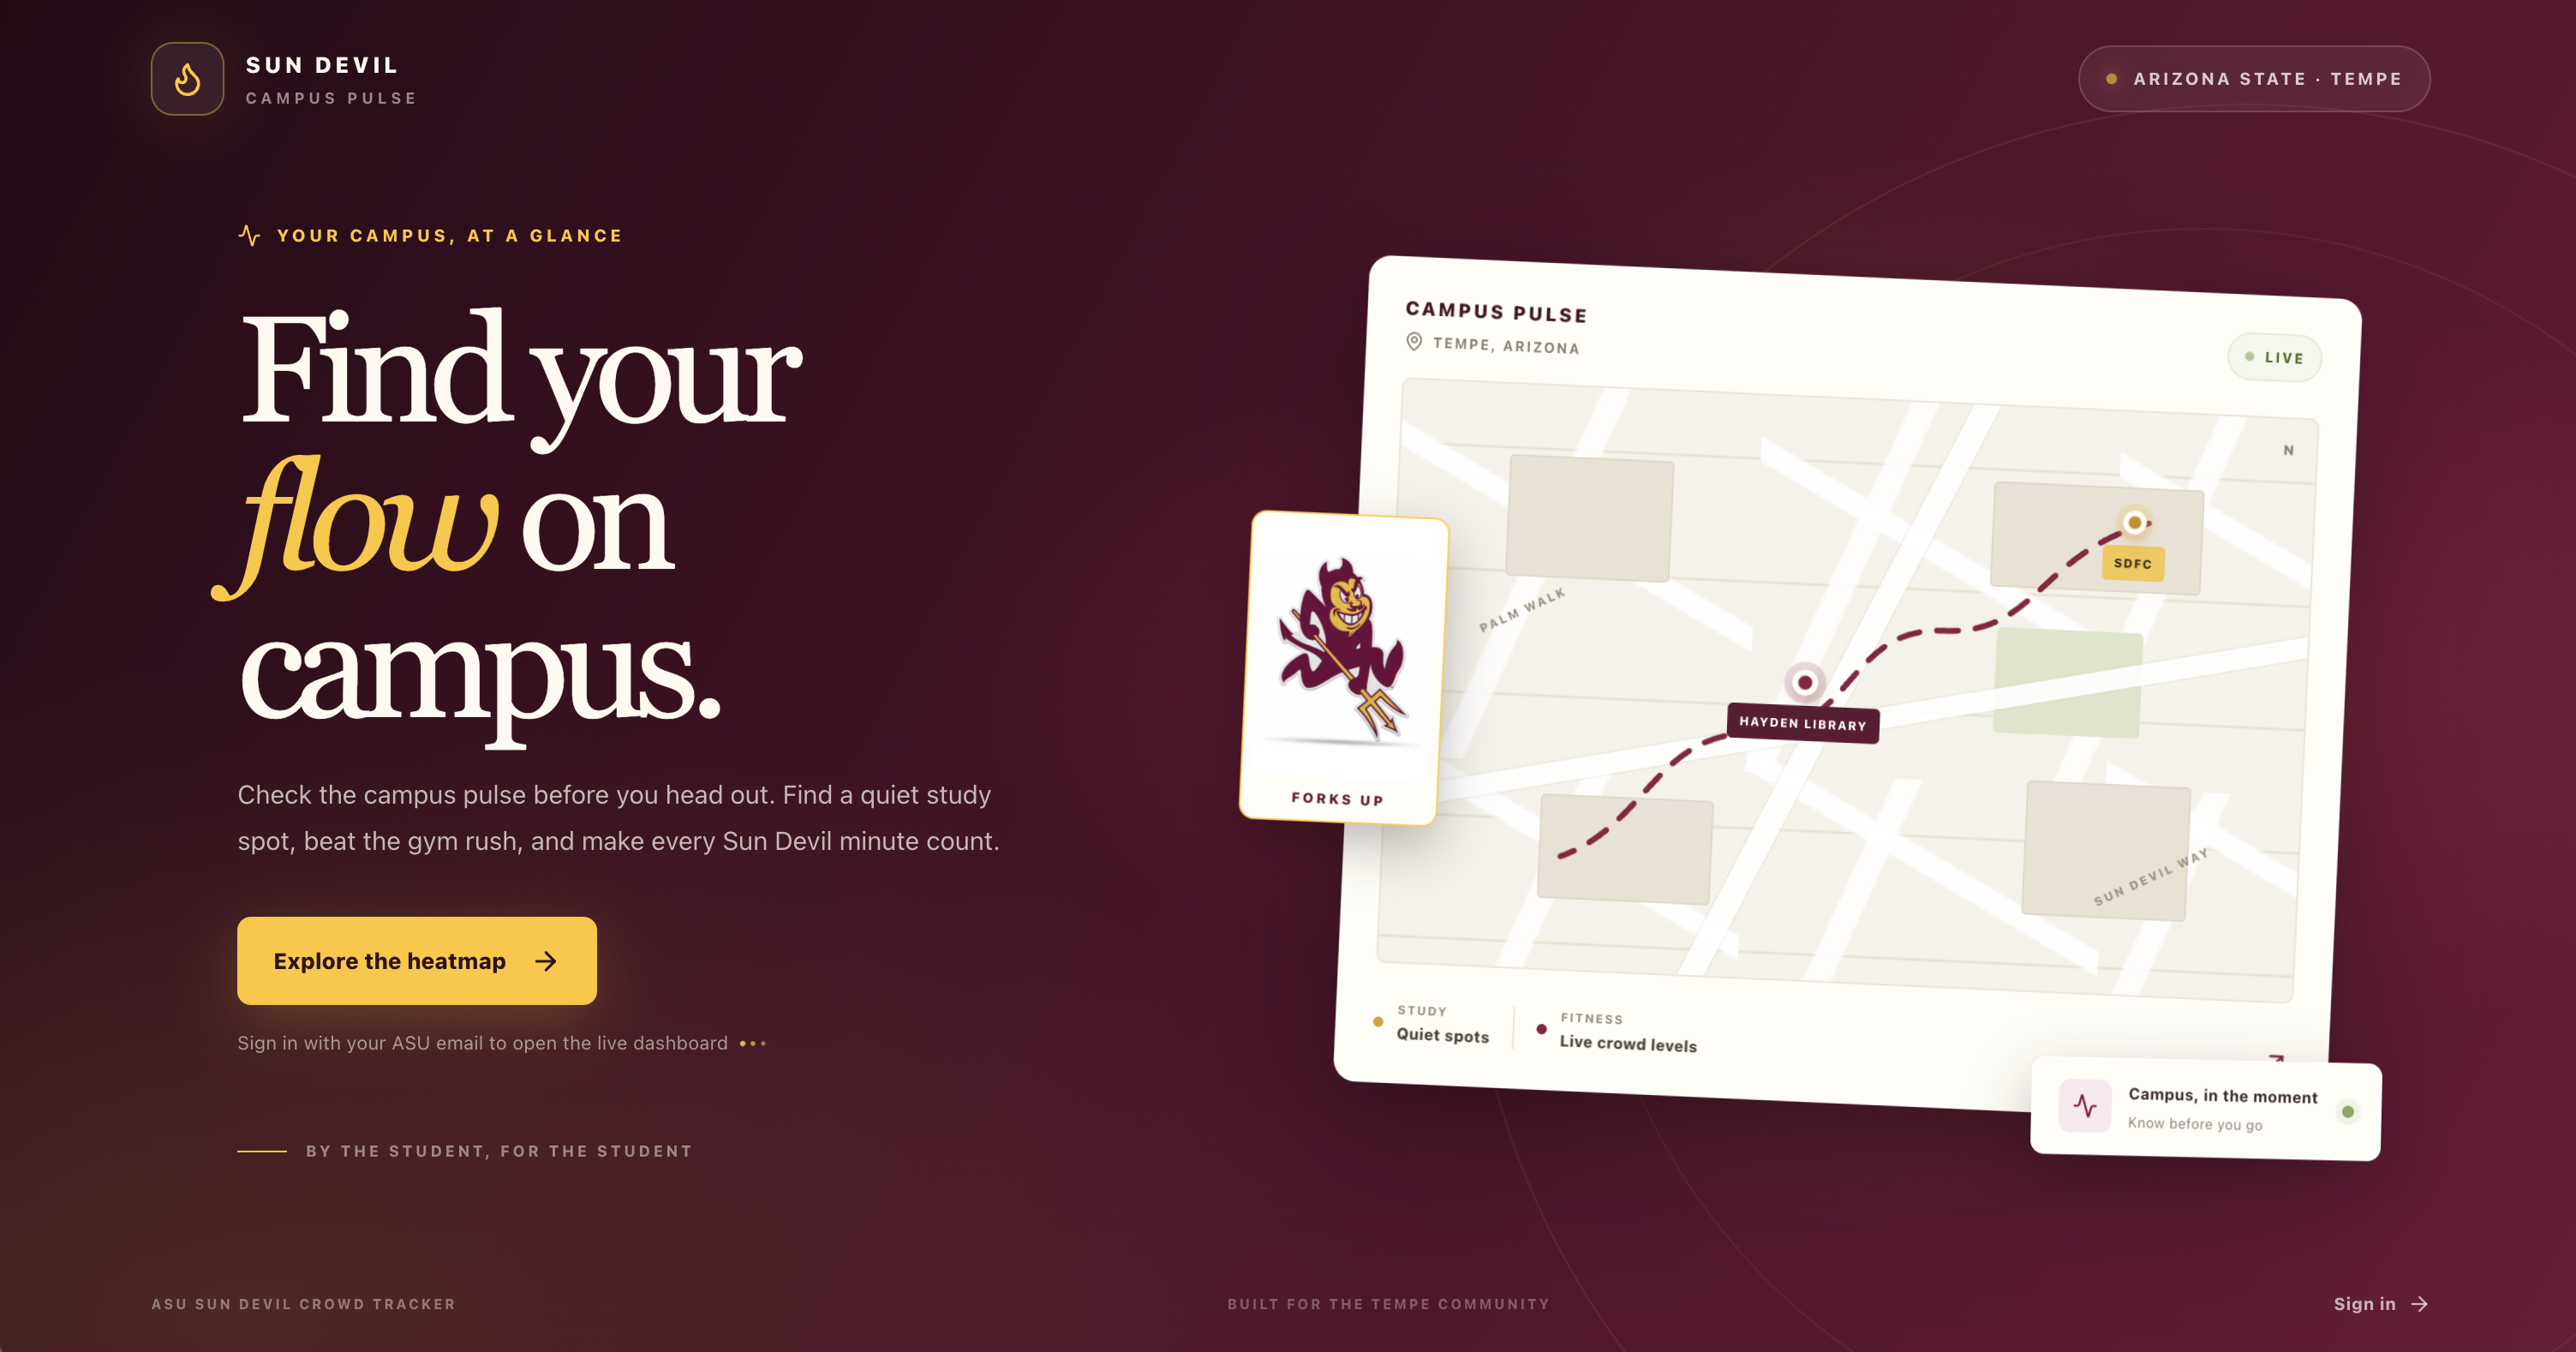
Inspiration
What it does
How we built it# ASU Sun Devil Crowd Tracker
By the student, for the student.
"Why guess when you can check before you go?"
Inspiration
As ASU students, we often experience overcrowded gyms, libraries, and dining halls without knowing how busy they are before visiting. Students waste valuable time searching for available study spaces, waiting in dining lines, or arriving at fitness centers during peak hours.
We wanted to solve this everyday problem by building a centralized platform where students can check campus activity before heading out.
What It Does
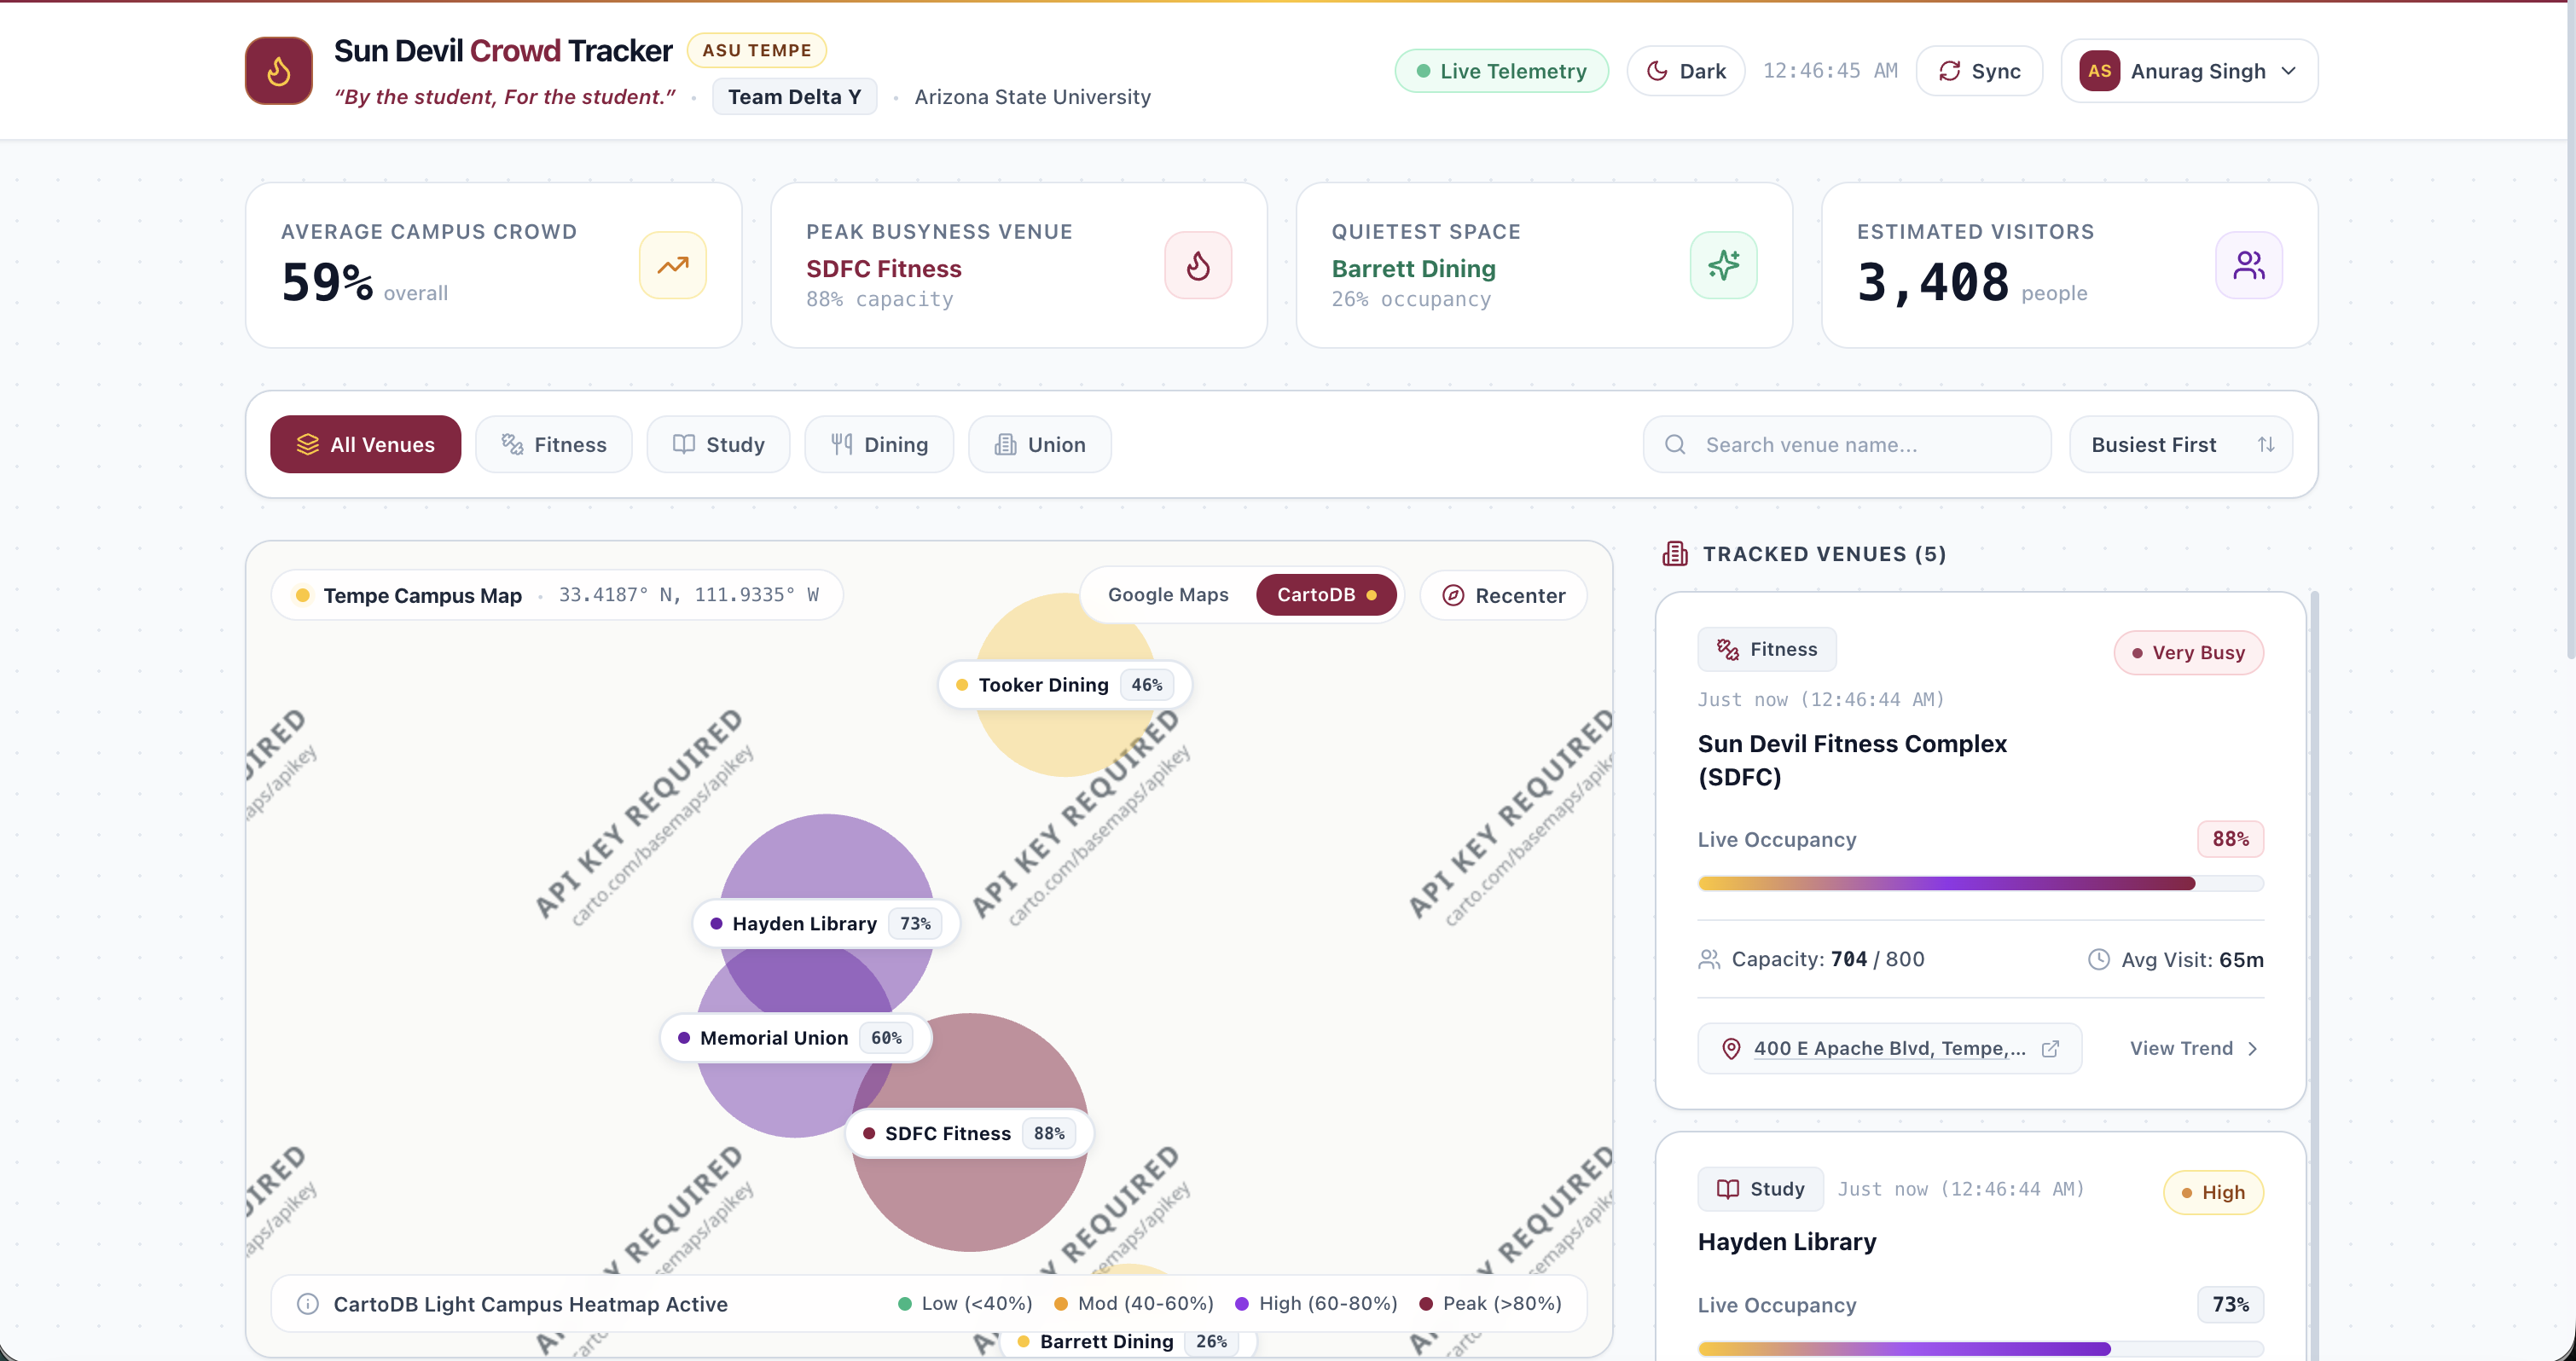
ASU Sun Devil Crowd Tracker is an interactive campus crowd intelligence platform designed to help students make smarter decisions about where and when to visit locations across Arizona State University's Tempe campus. Powered by the LivePopularTimes API, our platform transforms public venue popularity signals into interactive heatmaps and meaningful crowd insights.
Key Features
- Interactive Campus Heatmap: Visualize estimated crowd activity across ASU Tempe.
- Live Crowd Insights: View estimated occupancy percentages and crowd levels, from ==Low== to ==Very Busy==.
- Campus Analytics Dashboard: Track average crowd levels, busiest venues, quietest locations, and estimated visitor activity.
- Smart Venue Filters: Search and filter locations by
Fitness,Study,Dining, andUnion. - Venue Information: Explore capacity estimates, dwell time, and directions.
- Hourly Popularity Trends & Campus Flow: Understand busy and quiet periods throughout the day to avoid peak hours.
- Automatic Refresh: Updates crowd information approximately every $12\text{ seconds}$ with
Live,Cached, andMock-Datastatus indicators. - ASU Student Access & Profiles: Dedicated sign-up and login experience using
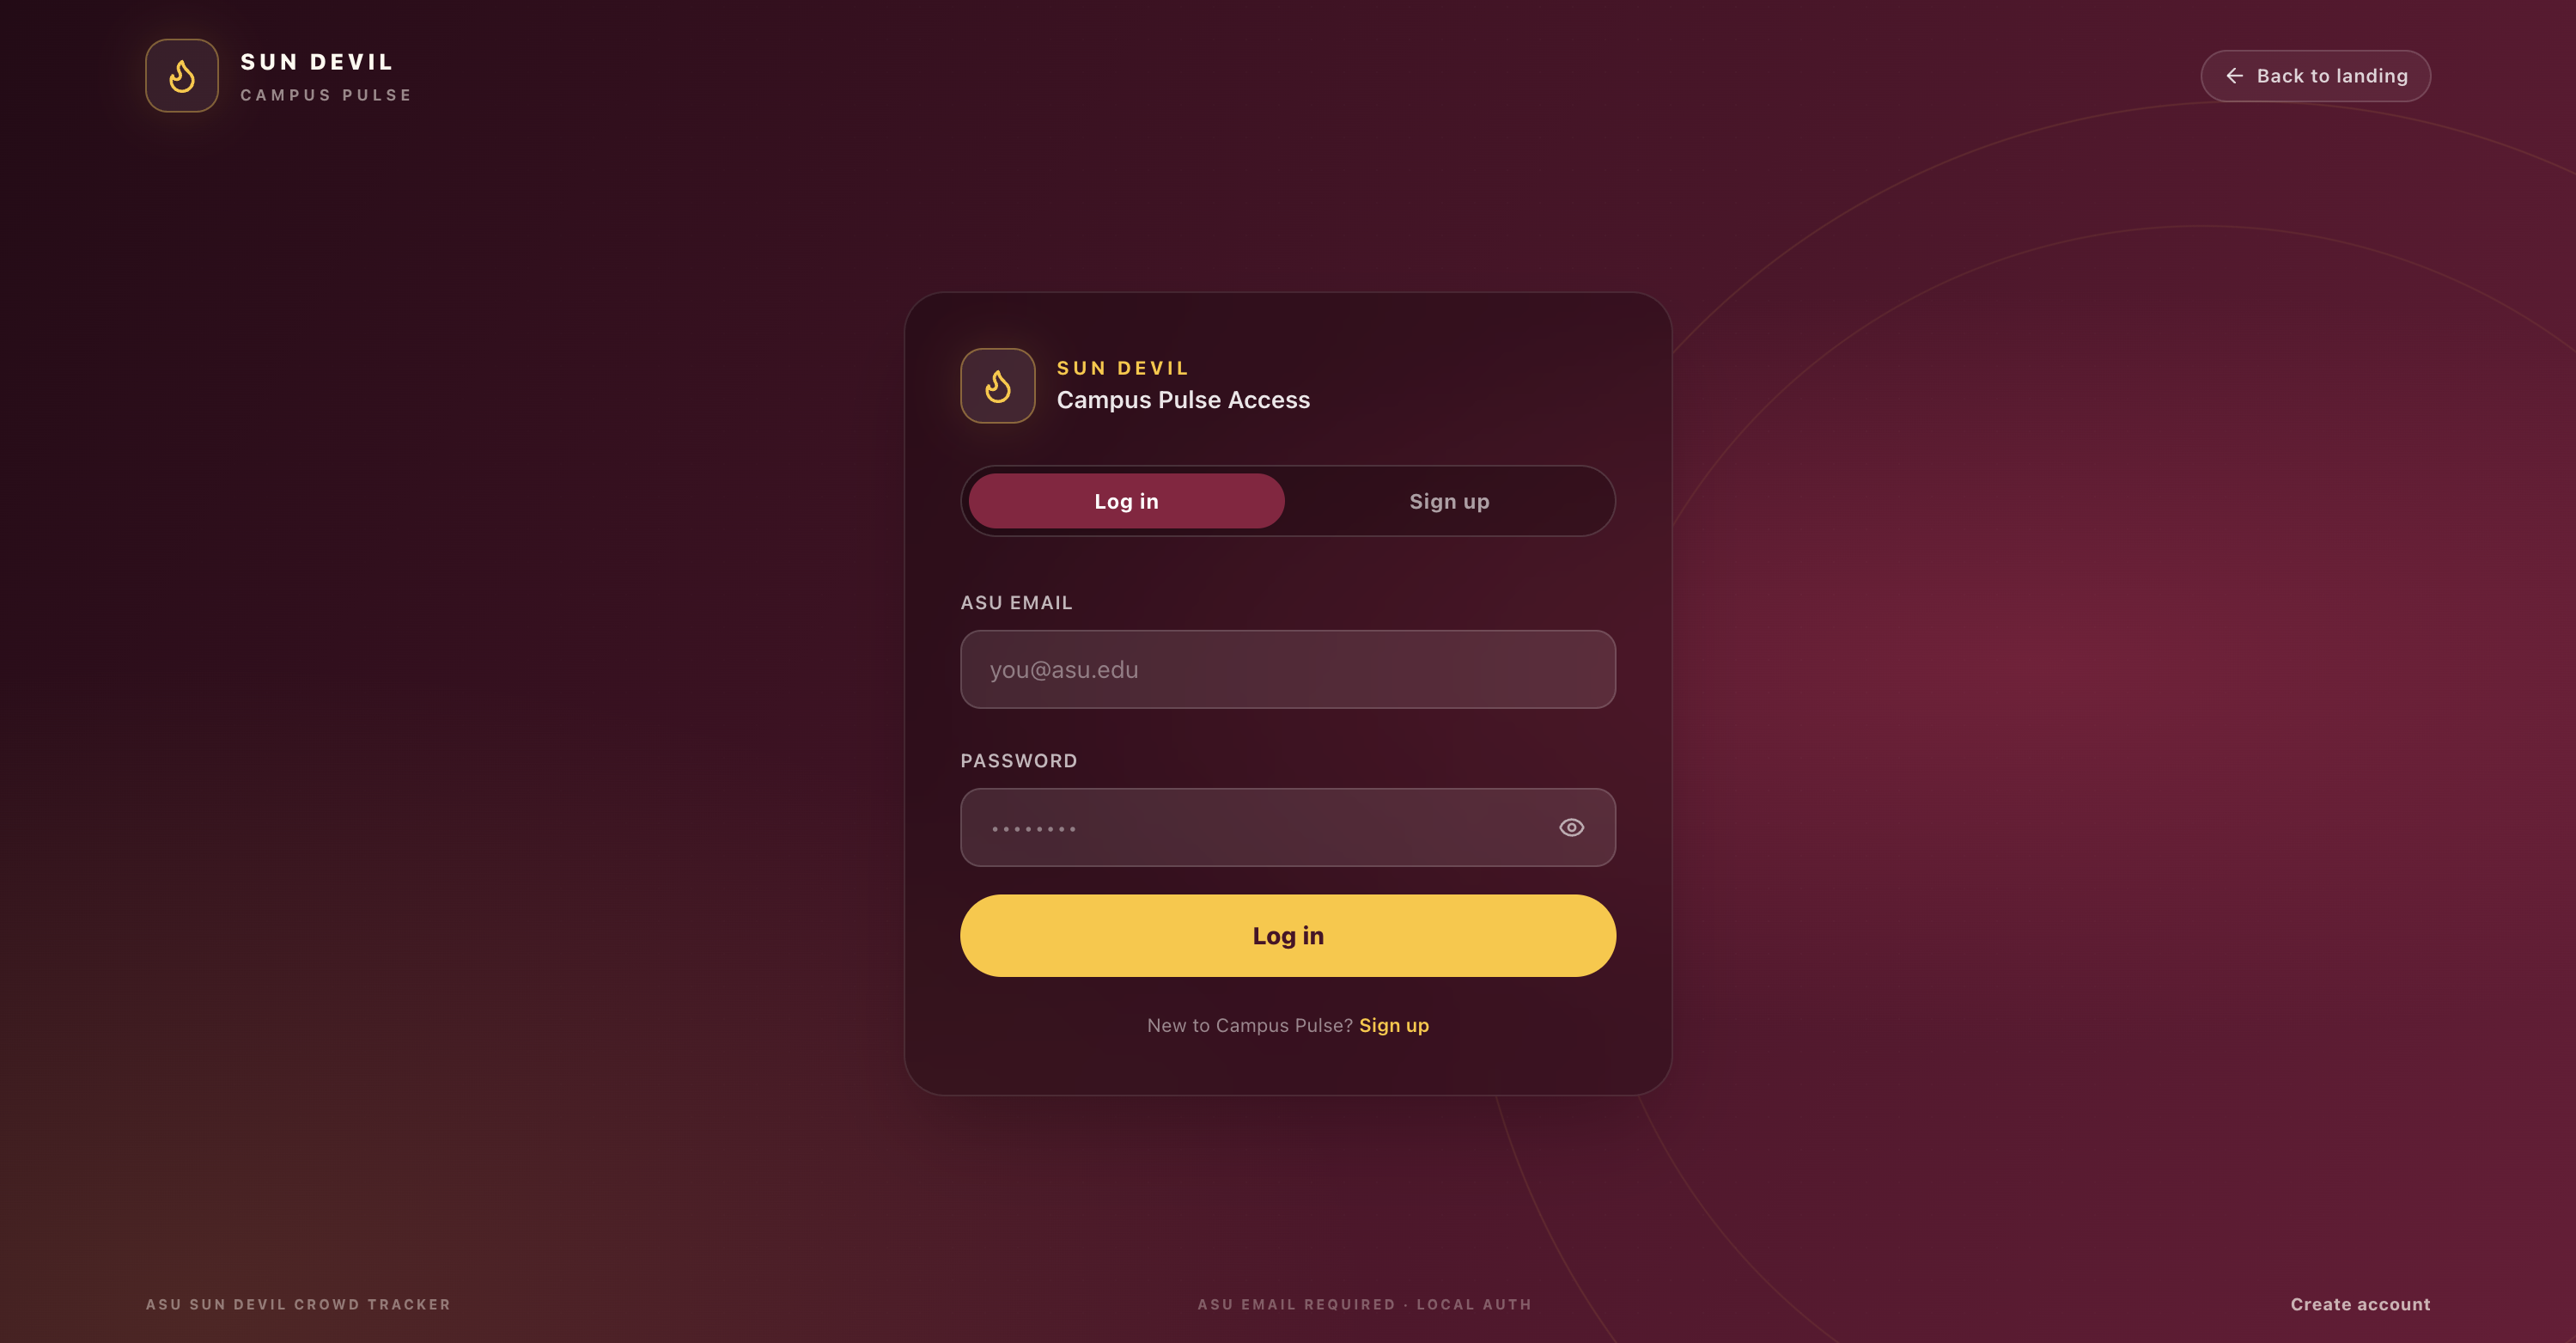
@asu.eduemail addresses, profile management, password updates, and a personalized light/dark theme toggle.
Tracked Campus Locations
| Location | Category | Focus |
|---|---|---|
| Sun Devil Fitness Complex (SDFC) | Fitness | Gym & recreation occupancy |
| Hayden Library | Study | Study space availability |
| Memorial Union (MU) | Union | Student hub & dining traffic |
| Tooker Dining | Dining | Dining hall wait times |
| Barrett Dining | Dining | Dining hall wait times |
How We Built It
We developed a full-stack web application combining modern web technologies, data integration, and visualization tools.
Technology Stack
- Frontend: Next.js 14, React, Tailwind CSS
- Data Visualization: Recharts and interactive heatmaps
- Mapping: Google Maps and Leaflet/CartoDB
- Data Integration: LivePopularTimes API
- Backend: Python FastAPI
- Database & Caching: SQLite and Redis (optional)
The frontend communicates with our backend via the /api/crowd-data endpoint to retrieve and display popularity signals. To estimate relative occupancy percentages ($O_{\text{est}}$) from popularity signals ($P_{\text{signal}}$) against estimated venue capacity ($C_{\max}$), our system normalizes incoming data:
$$ O_{\text{est}} = \left( \frac{P_{\text{signal}}}{100} \right) \times 100\% \quad \text{and} \quad V_{\text{est}} \approx \frac{O_{\text{est}}}{100} \times C_{\max} $$
We also implemented automatic $12\text{s}$ polling, caching support, and mock-data fallbacks to maintain dashboard functionality whenever external APIs are temporarily unavailable.
Student Access & Privacy
We believe campus technology should be accessible to students without compromising their personal privacy. Our platform includes:
- ASU email-based student registration using
@asu.edu - Secure login and account management
- Personal profile and password management
Our future goal is to strengthen student access while maintaining responsible data practices and protecting personal information.
Challenges We Faced & What We Learned
- Data Translation: Integrating raw external popularity signals and translating them into intuitive, actionable metrics for students.
- System Reliability: Handling API rate limits, missing data, and automatic refresh intervals without breaking the user experience—solved by implementing Redis/local caching and mock-data fallback states.
- Full-Stack Architecture: Gained hands-on experience connecting a Next.js 14 frontend with a Python FastAPI backend, interactive mapping libraries, and real-time data visualizations.
What's Next
Our long-term vision is to expand ASU Sun Devil Crowd Tracker across the entire Tempe campus. With approval and collaboration from Arizona State University, we plan to introduce:
- LiDAR Sensor Integration: Installing anonymous LiDAR-based people-counting sensors at entrances and exits to track real-time foot traffic.
- High-Precision Occupancy Tracking: Calculating exact net occupancy ($N(t)$) at any time $t$ by tracking cumulative entries ($E_{\text{in}}$) and exits ($E_{\text{out}}$): $$N(t) = \sum_{i=1}^{t} \left( E_{\text{in}}(i) - E_{\text{out}}(i) \right)$$
- Campus-Wide Expansion: Extending coverage to additional libraries, fitness centers, dining halls, and high-traffic campus spaces.
- Hybrid Real-Time Data: Combining LiDAR sensor streams with
LivePopularTimessignals for maximum reliability. - Predictive Crowd Analytics: Using historical and real-time trends to forecast peak hours and recommend optimal visiting windows.
- Privacy-First Architecture: Our LiDAR system will strictly count anonymous foot traffic without capturing facial images, identifying individuals, or tracking personal movements. > Our Philosophy: Count the crowd, never identify the person.
Team
Developed by Team Delta Y at Arizona State University – Tempe, Arizona:
- Anurag Singh
- Atharva Date
- Parth Thombre
- Lovinder Singh
Disclaimer: Current crowd levels are estimates based on public popularity signals and are not official ASU occupancy measurements. Future LiDAR integration is a proposed enhancement subject to university approval. This is an independent student project and is not affiliated with or officially endorsed by Arizona State University.
Challenges we ran into
Accomplishments that we're proud of
What we learned
What's next for Sun Devils Pulse - Heat Map
Built With
- api-integration
- cartodb
- crowd-monitoring
- data-analytics
- data-visualization
- fastapi
- full-stack-development
- geospatial-analytics
- google-maps
- interactive-heatmaps
- javascript
- leaflet.js
- livepopulartimes-api
- next.js
- predictive-analytics
- python
- react
- real-time-data
- recharts
- redis
- rest-api
- smart
- sqlite
- tailwind-css
- web-development

