

Description
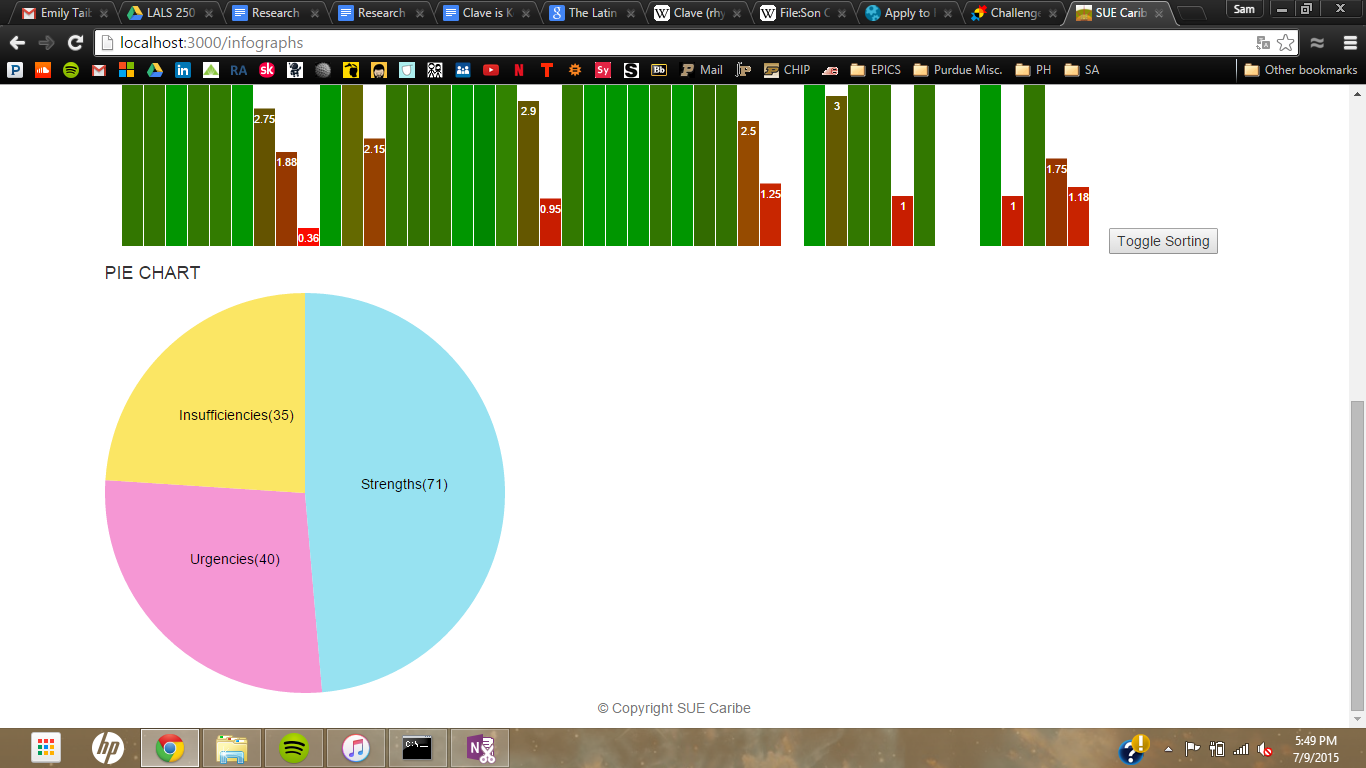
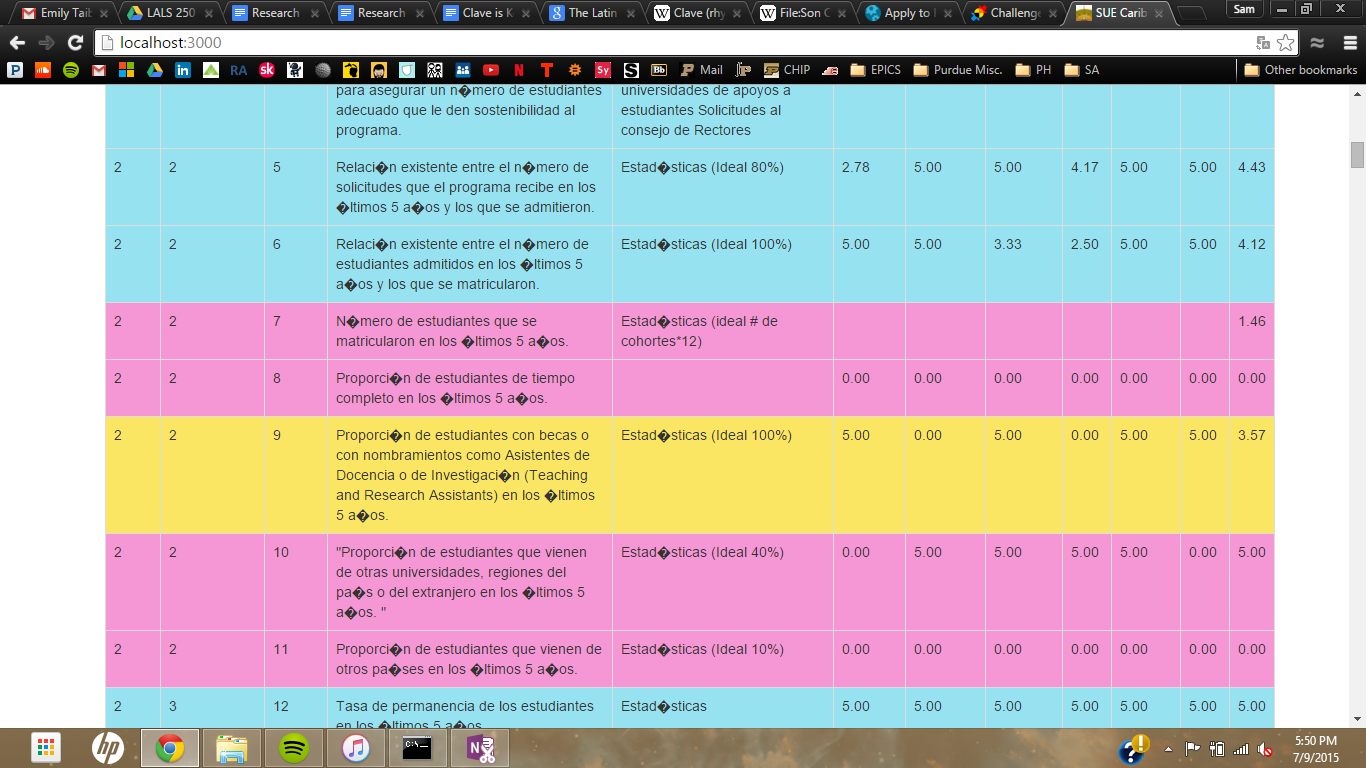
This is a site I created for an internship in the summer of 2015. It takes data from an excel file that wasn't displayed in a very appealing way, and displays both the raw data and several graphs on the website in a more intuitive way - plus there is interactivity with filters.
How it works
Made using Meteor, plus the D3.js library.
Challenges I ran into
Before this project, I was new to almost every aspect of web development. So pretty much everything was a challenge, but I learned a ton. The final project is also a little hacky, since I at times had to rely on tutorials, but when possible I go back and make things more efficient.
Accomplishments that I'm proud of
I'm proud of the site in general, and of the fact that aside from using a boilerplate and following a few tutorials this website is made from scratch. I also particularly like the filters and the bar graph interactivity.
What I learned
I learned html, JavaScript, MiniMongo, Meteor, a bit of D3, and a bit of CSS/LESS.
What's next for SUE Caribe Report Site
Right now the online version is rather slow, so much so that often the data doesn't load, and I have some ideas about how to restructure to solve that.
Built With
- blaze
- d3.js
- html
- javascript
- meteor.js
- minimongo
- spacebars


Log in or sign up for Devpost to join the conversation.