-
-
map
-
main
-
FAQ
Inspiration
Franchise expansion is one of the most capital-intensive decisions a business owner can make — yet most site selection still relies on gut feel and Google Maps. We wanted to build the tool we wish existed: a data-driven command centre that tells you exactly how crowded a suburb is for your concept, before you sign a lease.
What it does
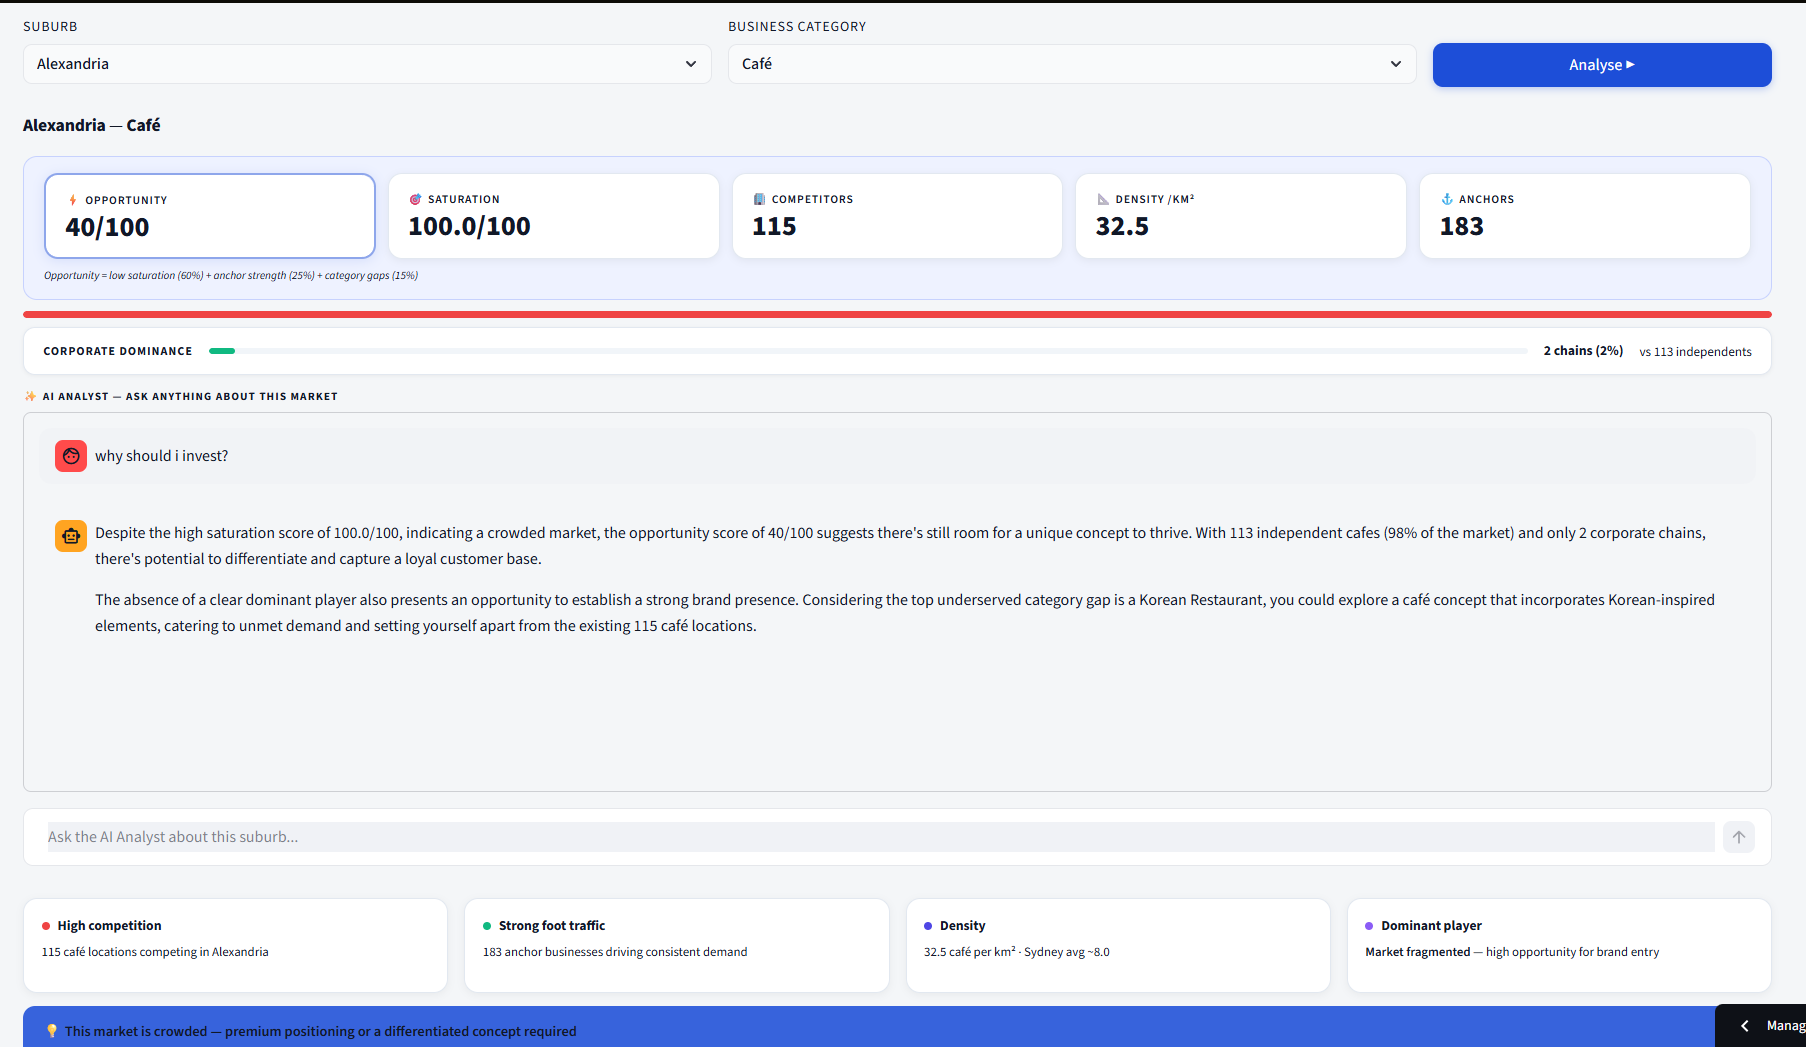
SuburbIQ is a B2B franchise site intelligence platform built on 311,266 Sydney POIs from Foursquare Open Source Places. You select a suburb and business category, and SuburbIQ instantly returns:
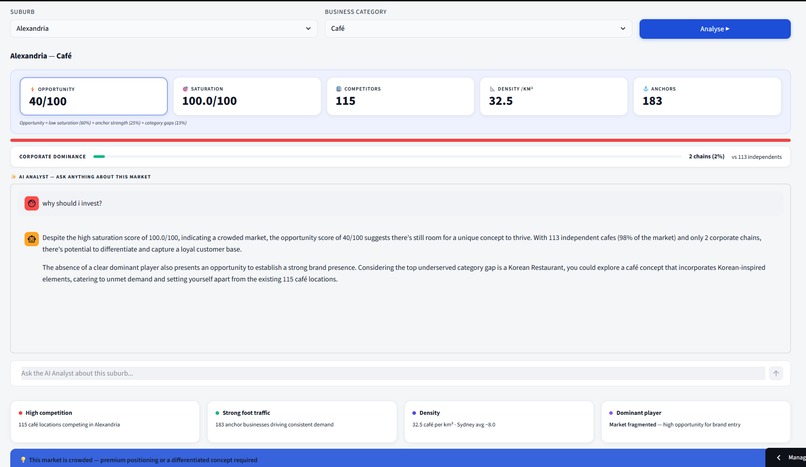
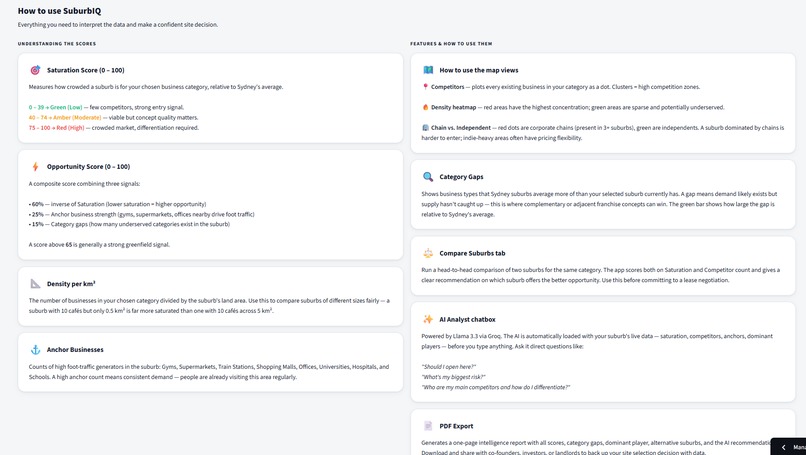
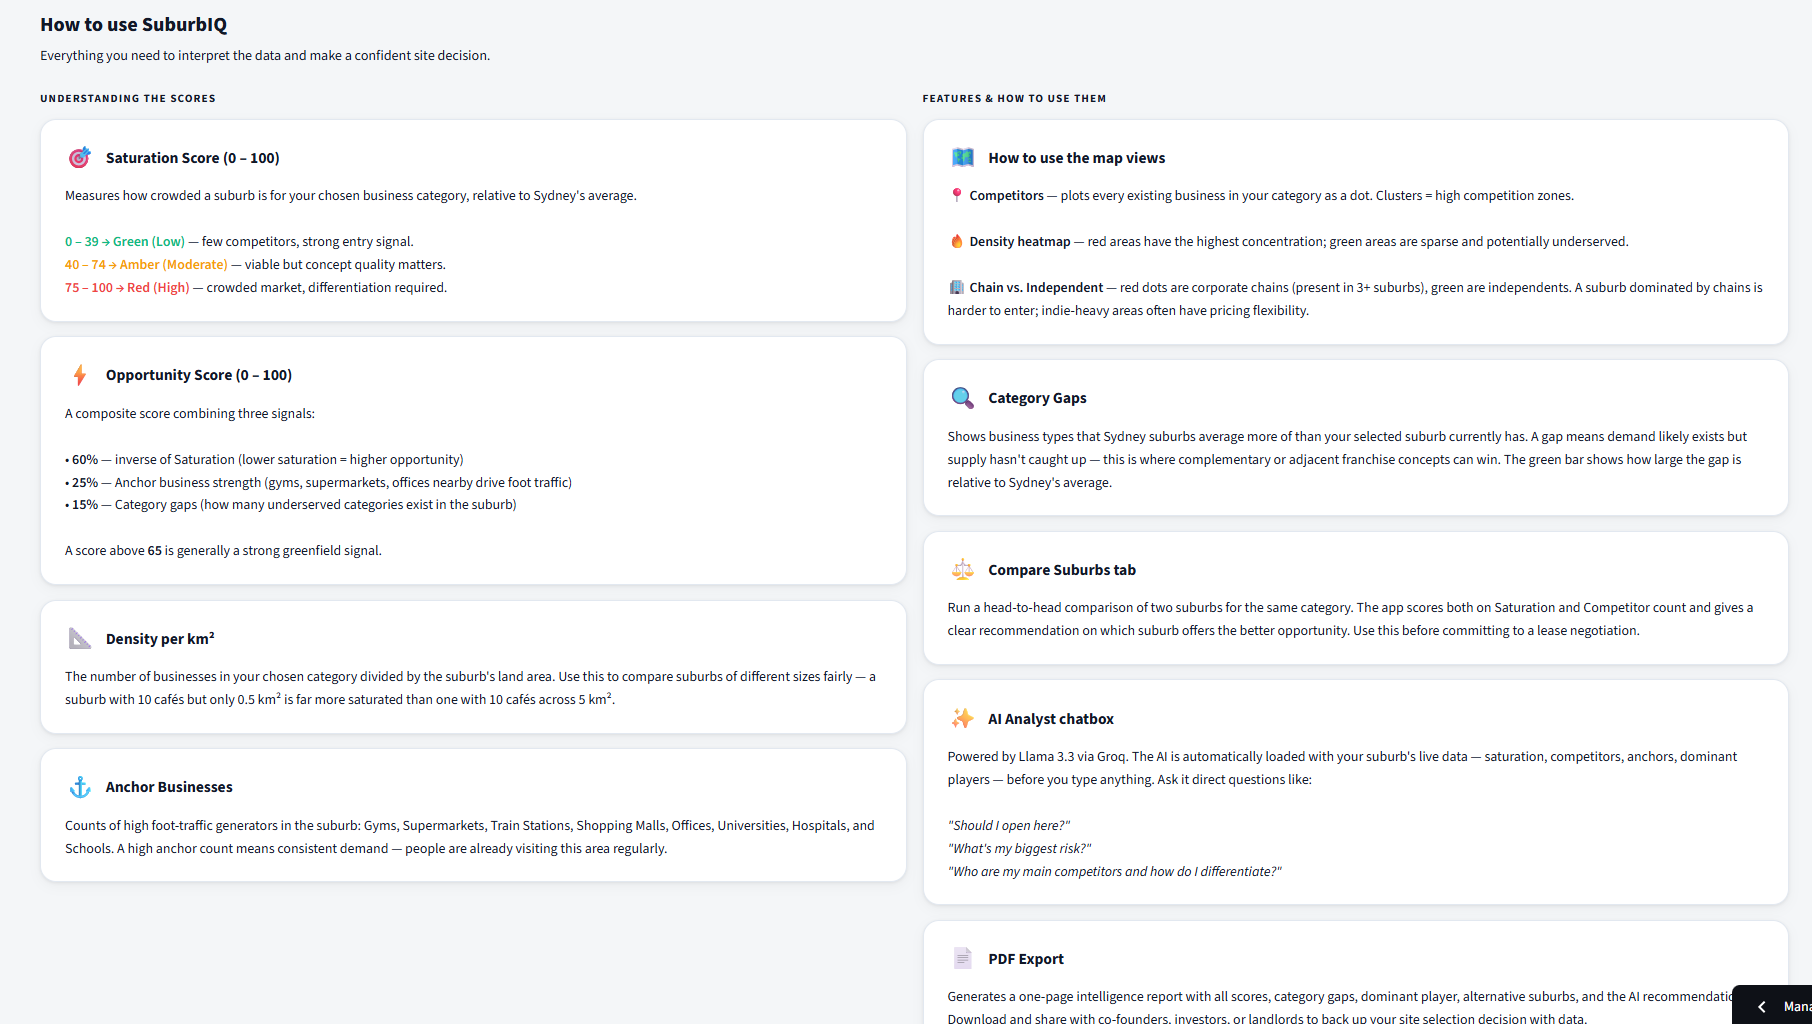
- Opportunity & Saturation scores — composite signals combining competitor density, anchor foot traffic, and category gaps
- Chain vs. Independent breakdown — identifies whether corporate chains dominate or if the market is fragmented
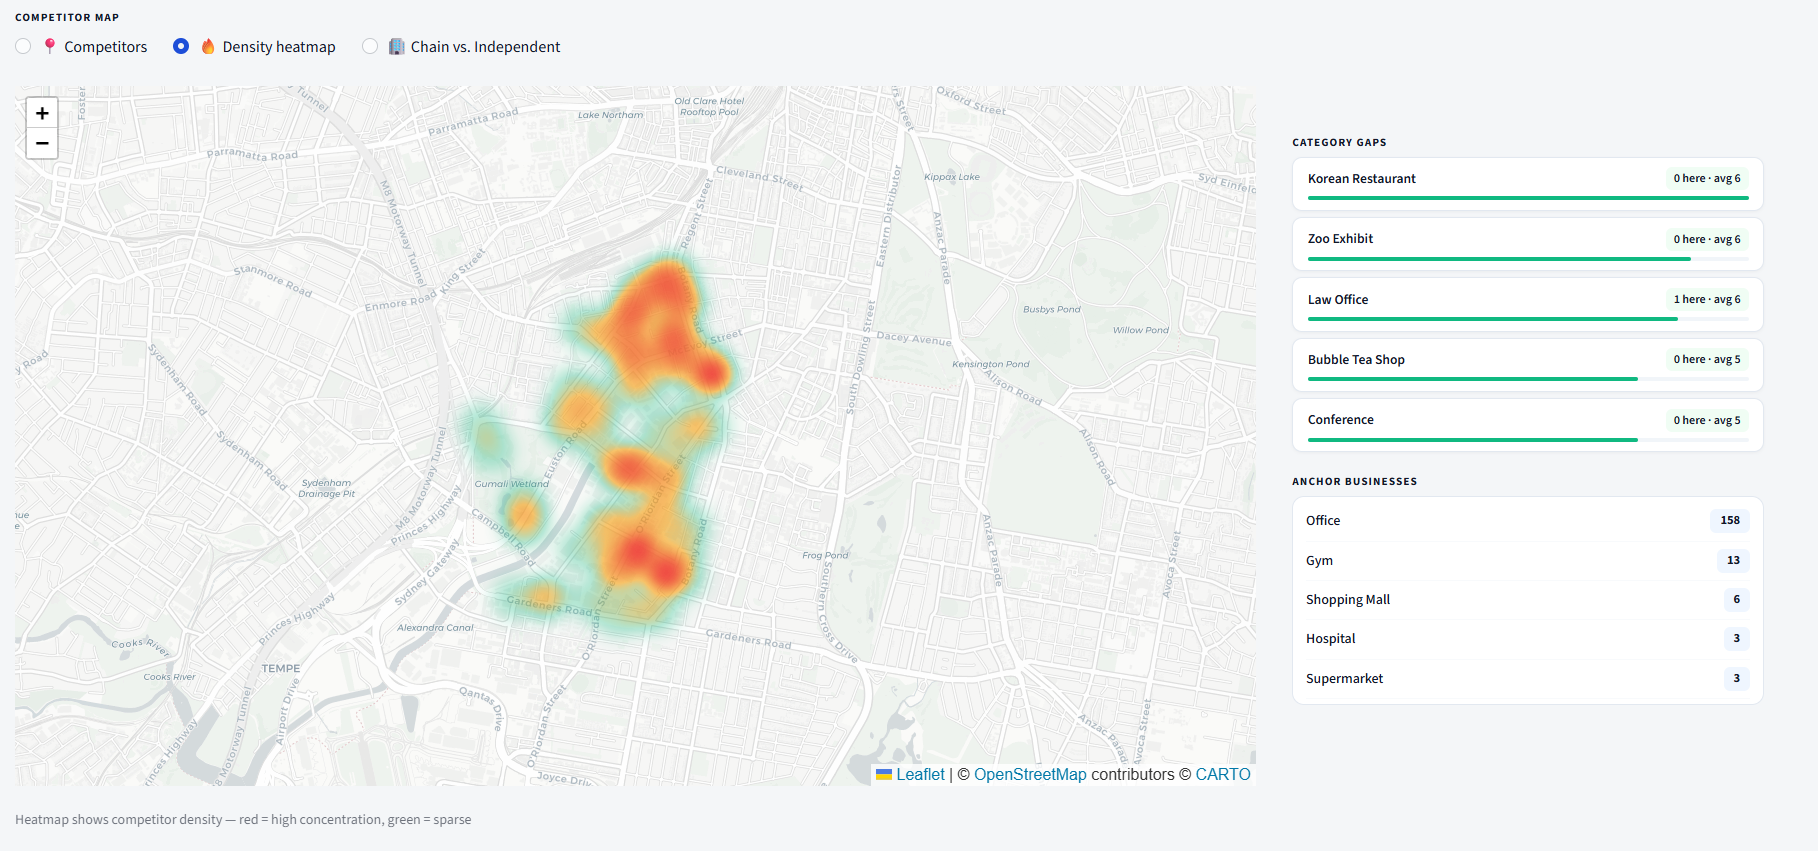
- Category gap analysis — surfaces underserved business types where demand exceeds local supply
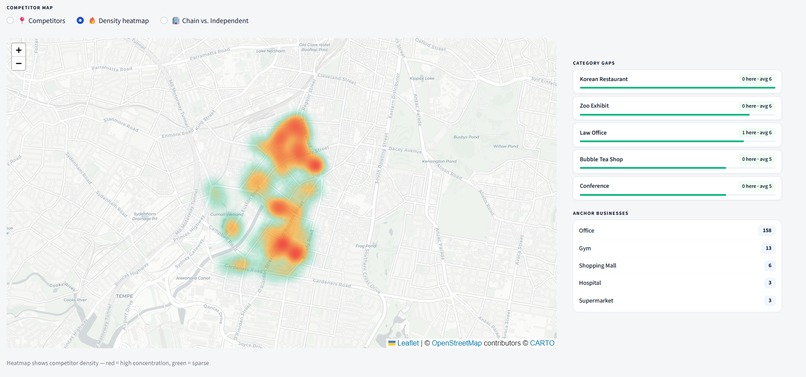
- Interactive competitor maps — dot map, density heatmap, and chain/indie overlay
- AI Analyst chatbox — powered by Llama 3.3 via Groq, pre-loaded with live suburb data so you can ask "Should I open here?" and get a data-grounded answer
- Head-to-head suburb comparison — scores two locations side by side for the same category
- One-click PDF report — exportable intelligence brief for investors and landlords
How we built it
The data pipeline starts with raw Foursquare parquet files filtered to Greater Sydney, then spatially joined to ABS Statistical Area Level boundaries to assign each POI to a suburb. We computed saturation scores by normalising competitor density against a Sydney-wide average per category, then stored the results in SQLite for fast querying. The frontend is Streamlit with a custom CSS design system (Inter font, white cards on a light-gray canvas). The AI layer uses Groq's streaming API with a dynamically constructed system prompt that injects live suburb metrics before every conversation.
Challenges we faced
The biggest challenge was keeping the UI responsive with a 311k-row dataset. We solved this with @st.cache_data on every query, SQLite indexes on suburb + category, and pre-aggregated suburb_stats so the map never has to scan the full POI table. A second challenge was the AI context — generic prompts produced generic advice. The fix was injecting the exact saturation score, competitor count, chain percentage, and top gap into the system message so every AI response is grounded in the specific suburb's numbers. It was my first hackathon ever so I had a really enjoyable learning experience and testing the app ( UI fixing, adding manual, removing dead ends for selections that didn't display data, everything else updated in the readme.md in github )
What we learned
Streamlit's rerun model requires careful state management — especially for streaming AI responses. Storing only serialisable text history in st.session_state and rebuilding the API client fresh on every call was the key to avoiding dead-connection bugs across reruns.
What's next
Expanding beyond Sydney to all Australian capitals, adding demographic overlay (ABS Census income + age bands), and a lease comparison feature that estimates break-even foot traffic required per m².

Log in or sign up for Devpost to join the conversation.