
Inspiration
Every year, thousands of entrepreneurs open businesses in the wrong location — not because they lack skill, but because the data to make a good decision simply wasn't available to them. Google Maps shows you what exists today. Real estate agents show you foot traffic. But nobody shows you the graveyard — the suburbs where businesses like yours have repeatedly tried and failed.
We wanted to answer a different question: not where are my competitors, but where have businesses like mine historically survived?
What We Built
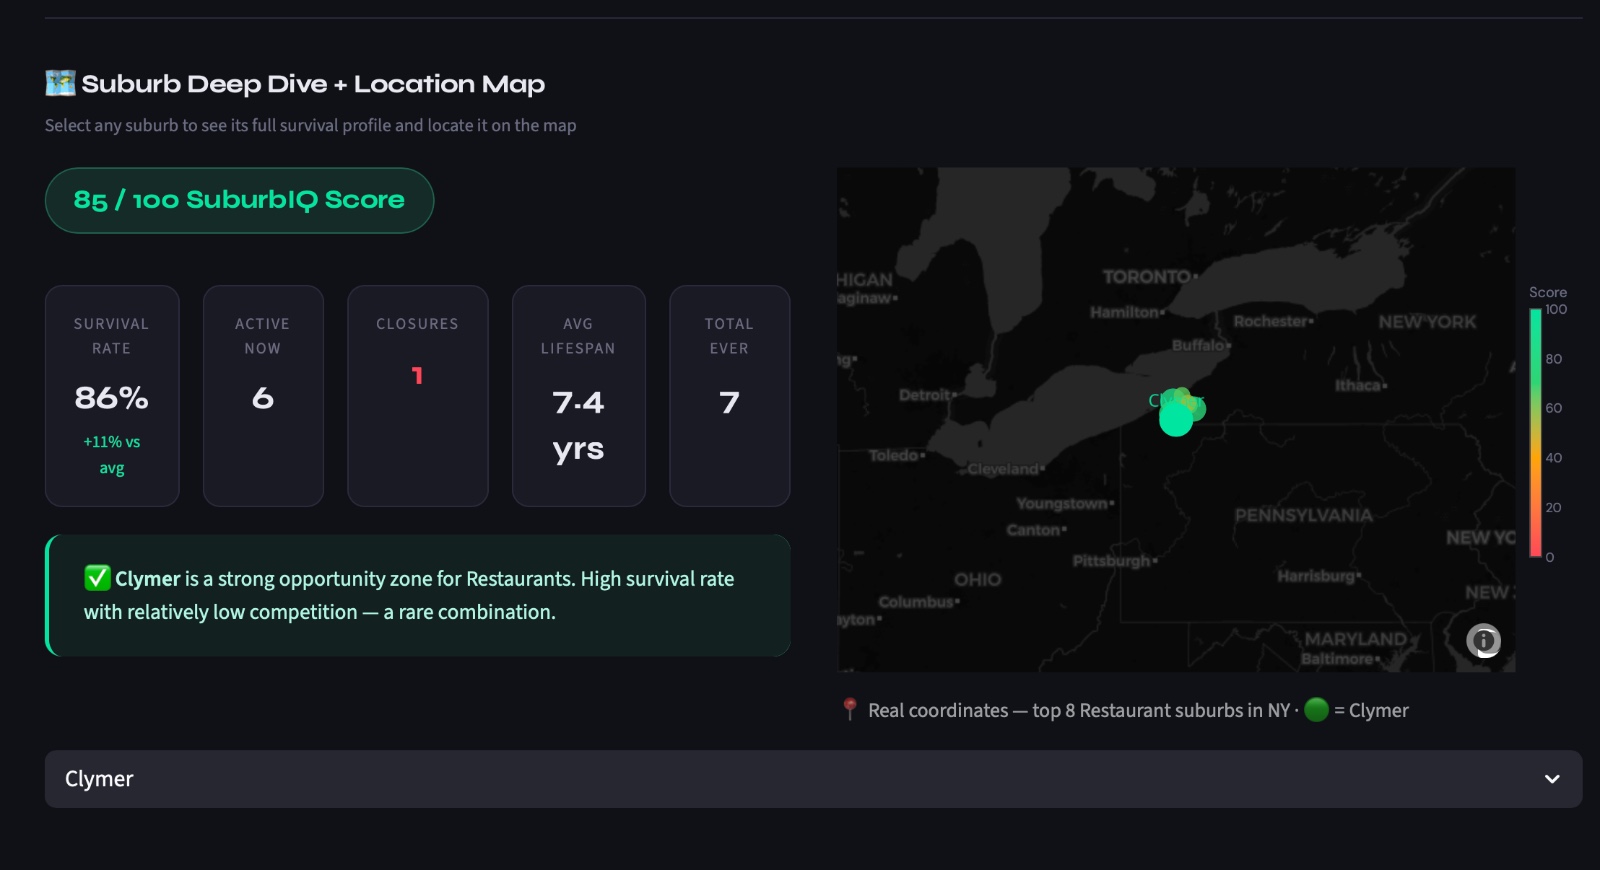
SuburbIQ is a business survival intelligence platform that maps historical survival rates across 144,000 suburb-category pairs spanning the US, Canada, Australia and the UK.
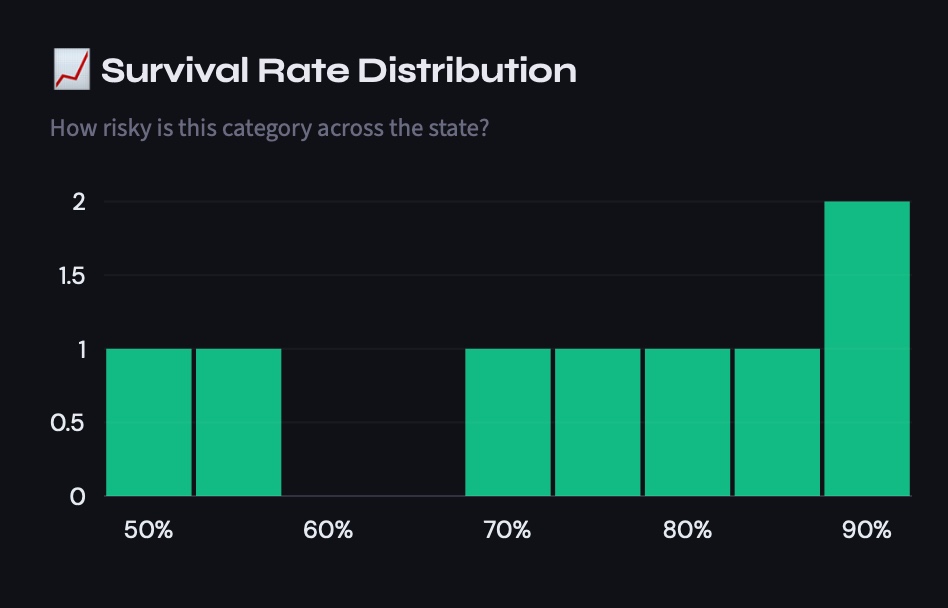
The core insight came from reading the Foursquare Open Source Places schema carefully. Three fields that most teams would scroll past — date_created, date_closed, and unresolved_flags — together tell the complete lifecycle of every business in the dataset. We combined them to compute a survival rate for every suburb and every category:
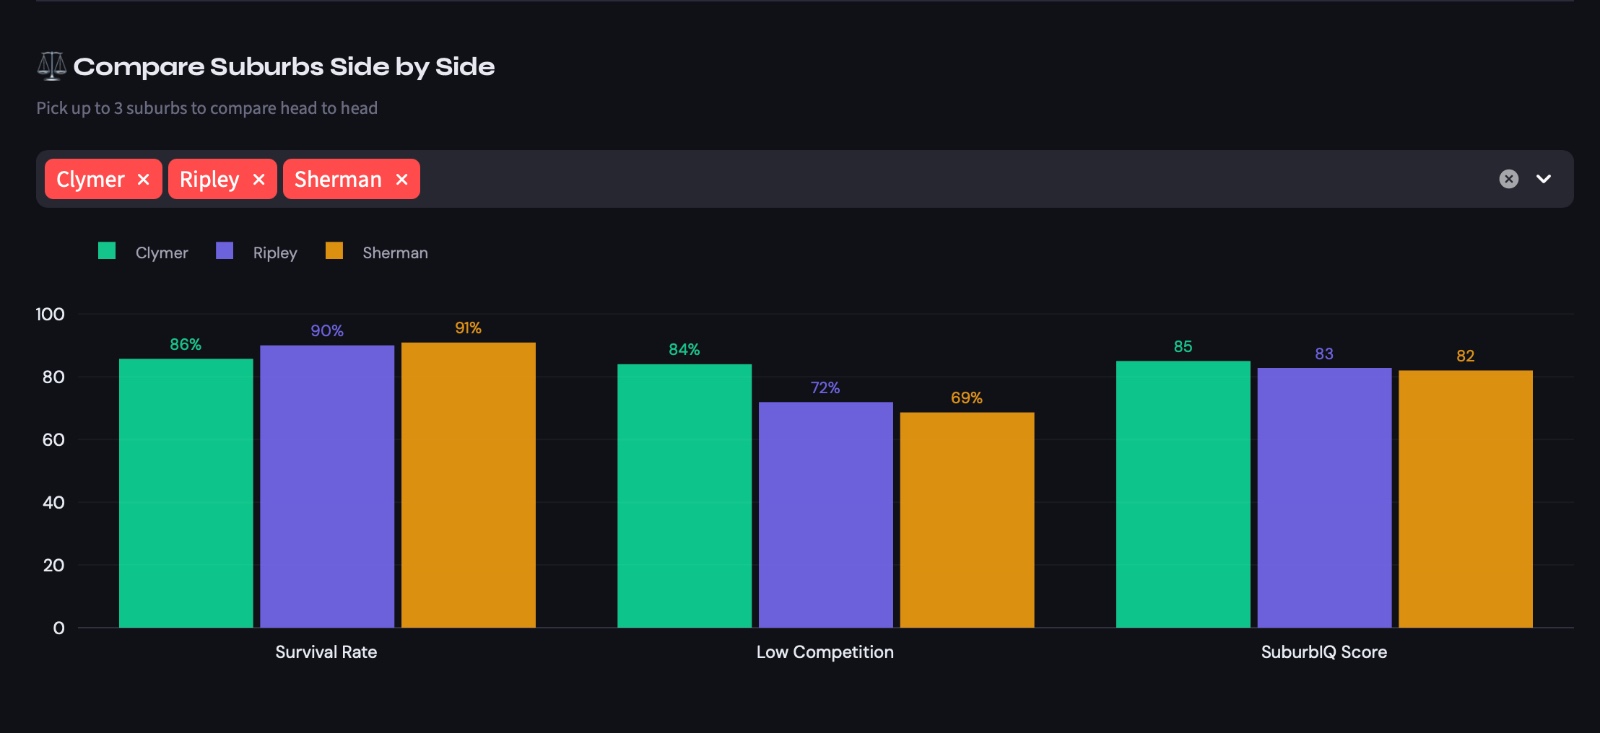
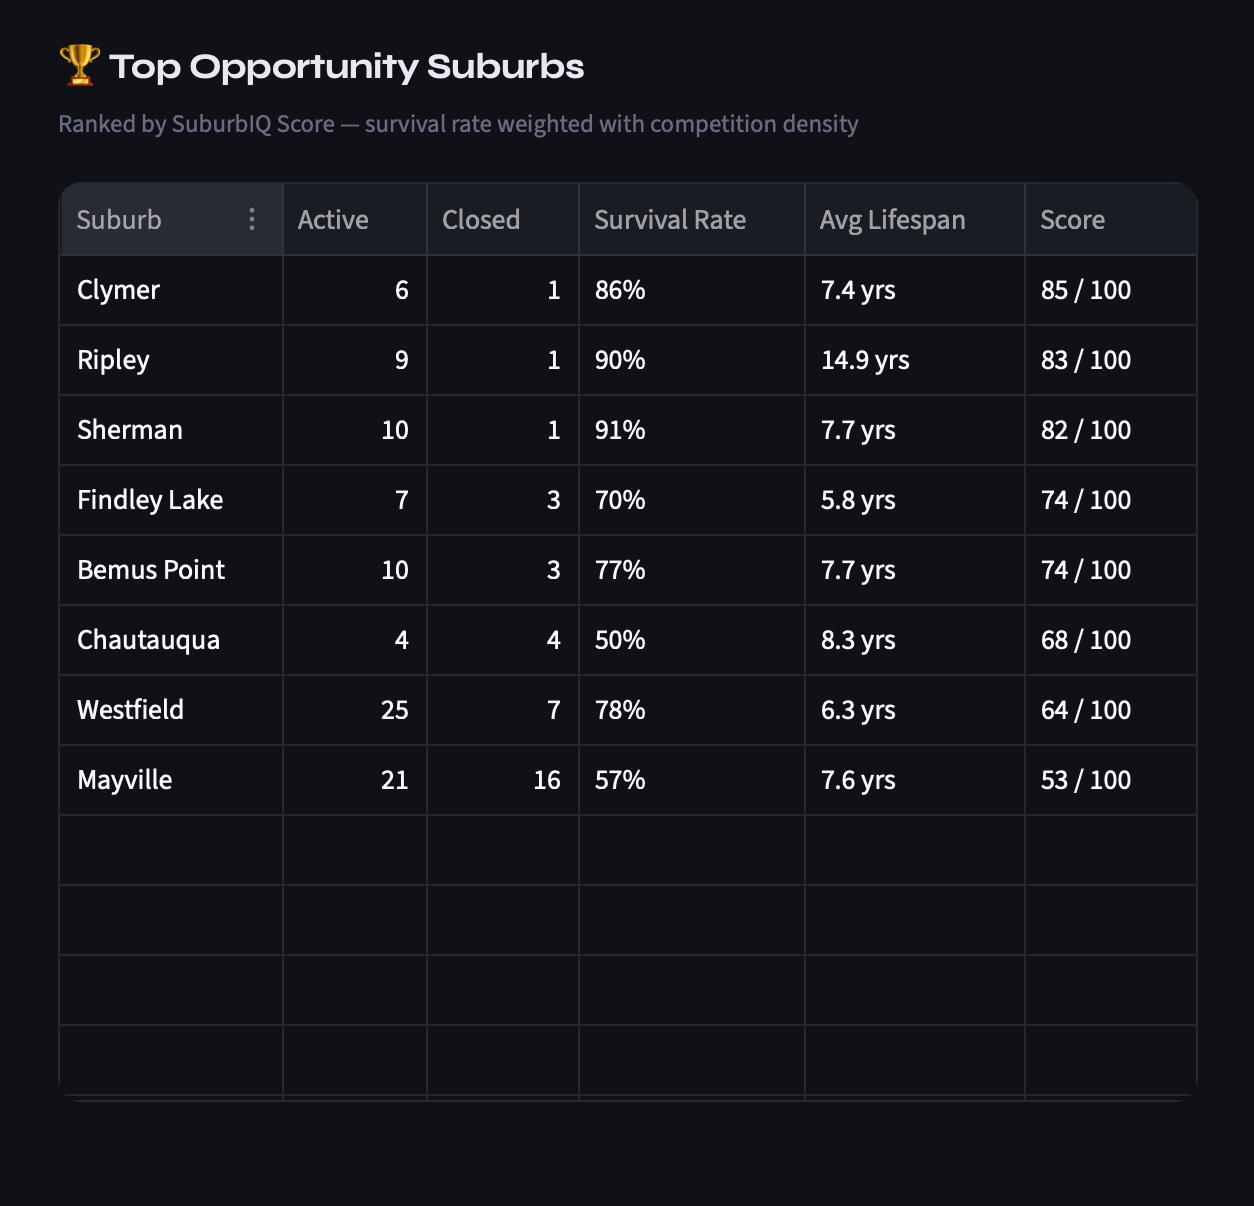
SuburbIQ Score = Survival Rate (60%) + Inverse Competition Density (40%)
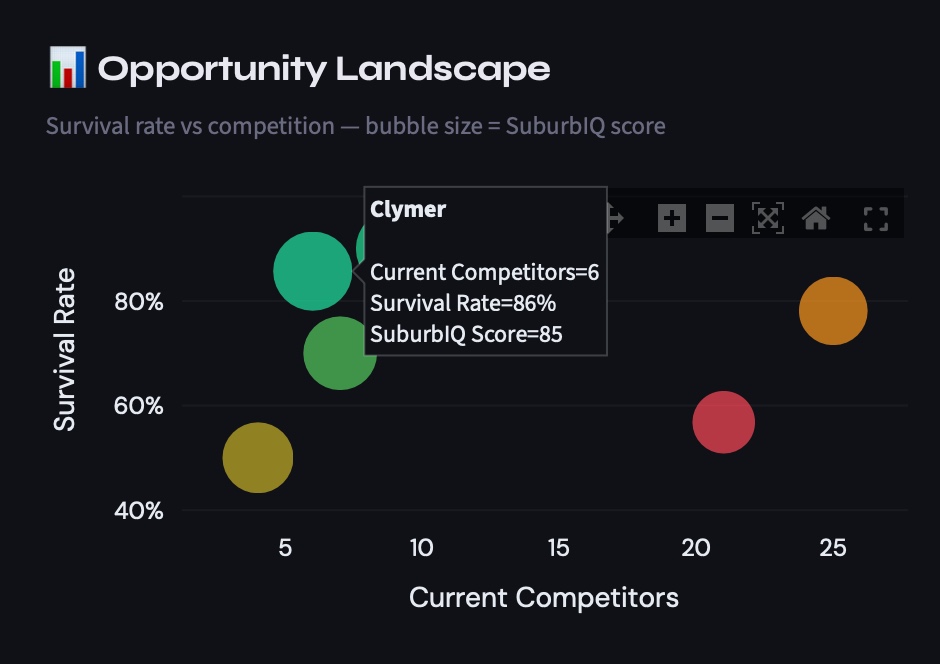
The result is a ranked map of opportunity zones — suburbs where businesses thrive, backed by real historical data.
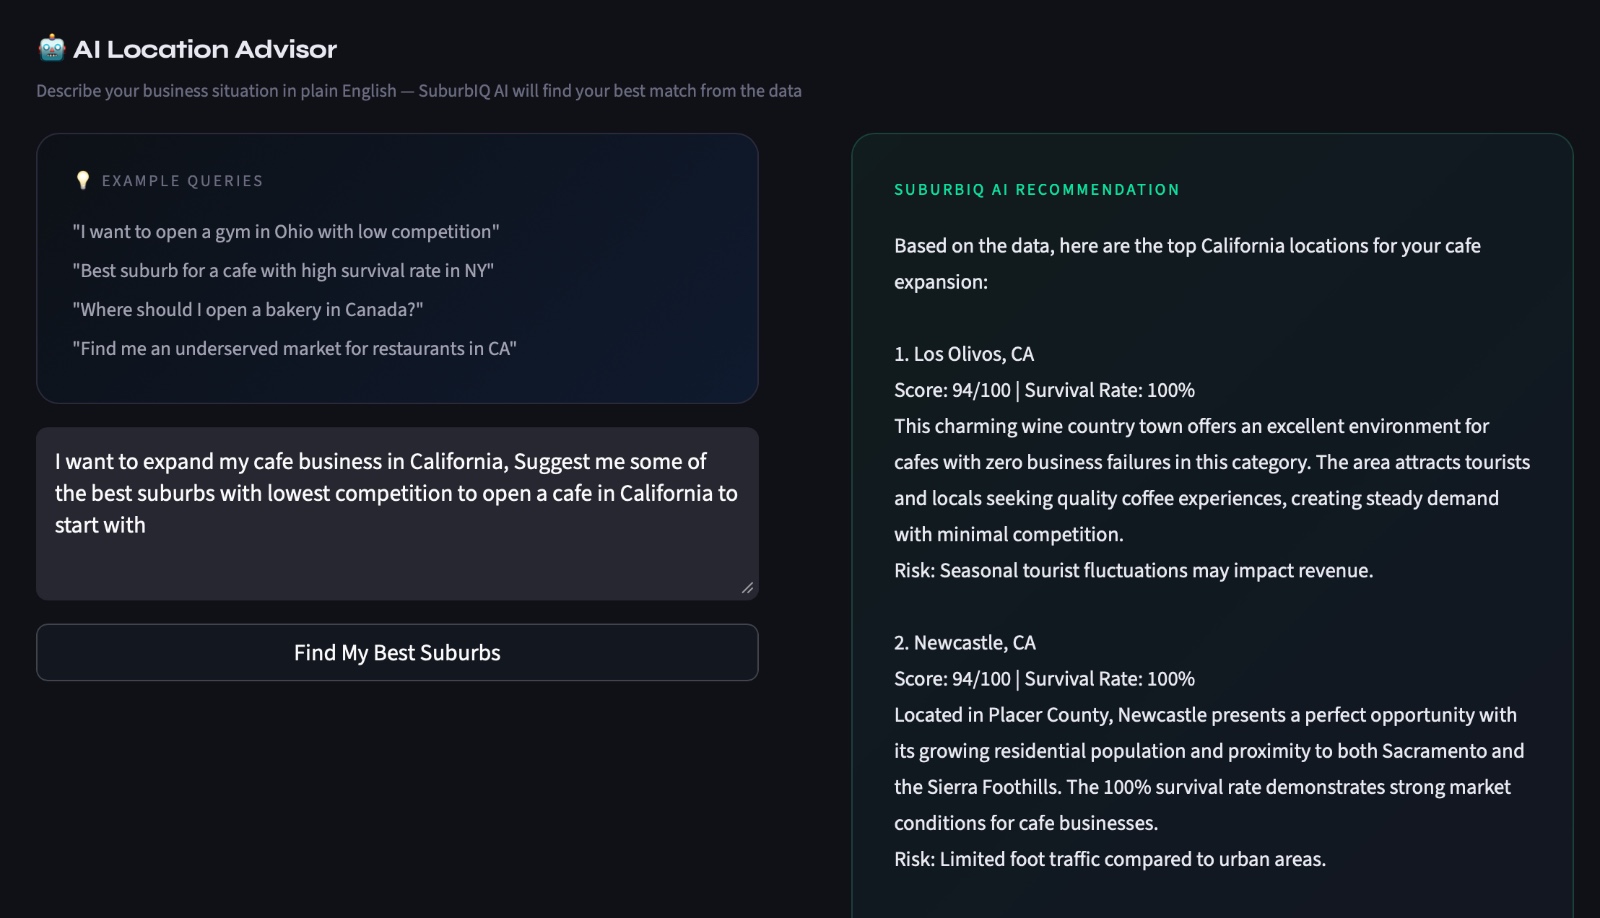
We also built an AI Location Advisor powered by Claude, which lets entrepreneurs describe their situation in plain English and receive specific suburb recommendations with scores, survival rates, and reasoning — all grounded in the actual data.
How We Built It
Data: Foursquare Open Source Places dataset — 6.1M POIs across North America, Australia and the UK, streamed via HuggingFace and filtered using Polars and PyArrow.
Processing: Custom survival rate pipeline aggregating 144,590 suburb-category pairs with weighted scoring.
AI: Claude API (claude-sonnet) with structured POI context injection for location recommendations.
Frontend: Streamlit with custom CSS, Plotly for charts, Mapbox for geographic visualisation.
Deployment: Streamlit Cloud with GitHub.
Challenges
The biggest challenge was the dataset itself. At 193GB and 114M rows globally, we couldn't download it — so we built a streaming pipeline that filters to target countries on the fly, processing only what we needed.
The second challenge was the schema. Australian POIs had null region fields, requiring us to back-fill from admin_region to surface state-level data for VIC, NSW, QLD and others.
The third was making the AI advisor actually useful rather than just impressive. We had to carefully engineer the prompt to pass structured POI context so Claude reasoned over real data rather than hallucinating recommendations.
What We Learned
The most valuable insight was that the most powerful features often come from reading the documentation carefully. date_created, date_closed, and unresolved_flags are three columns that ship with every Foursquare record — but combining them into a survival rate metric produced something no existing free tool offers.
We also learned that a focused product with a clear user beats a sprawling analysis every time. SuburbIQ answers one question exceptionally well: where should I open my business?
What's Next
Our immediate next steps are expanding Australian and New Zealand coverage with additional data files, integrating ABS census demographic overlays for richer opportunity scoring, adding survival trend over time to show whether a suburb is improving or declining, and building an API layer so proptech platforms and franchise networks can consume the data programmatically.
Built With
- claude
- foursquare
- github
- huggingface
- mapbox
- plotly
- polars
- python
- streamlit


Log in or sign up for Devpost to join the conversation.