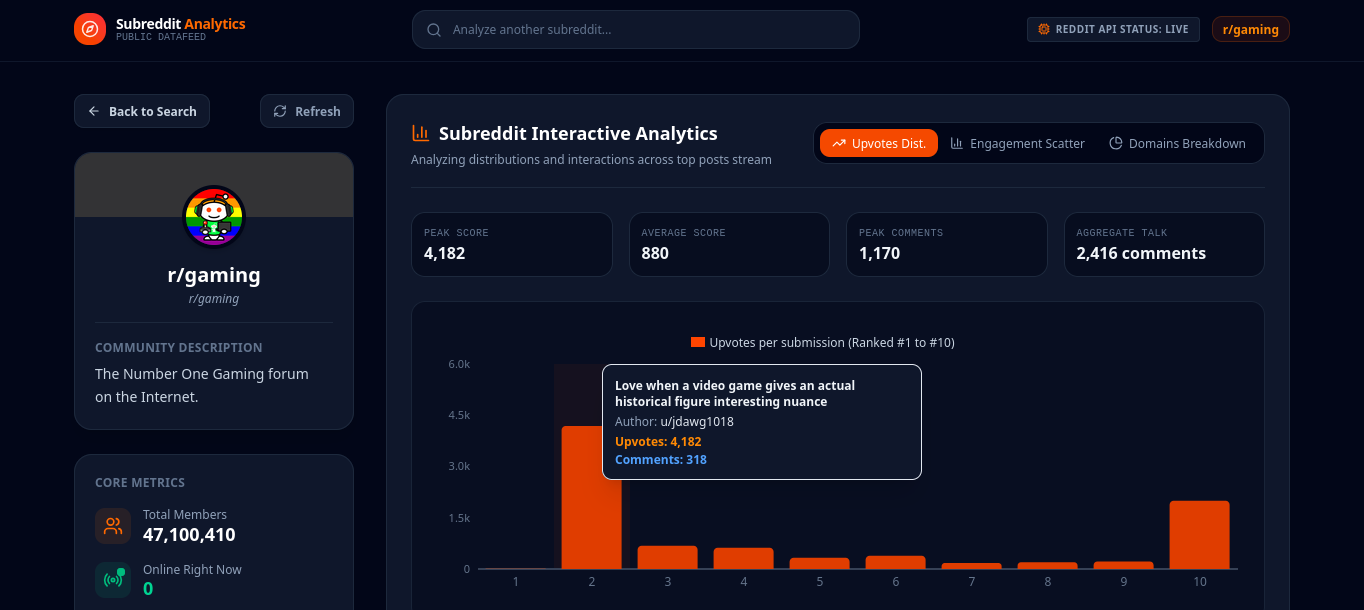
Inspiration Reddit is a treasure chest of data, and most of its analytics are hidden from the casual user. I wanted to build an application that would allow anyone--a moderator, a researcher, or a casual lurker-to paste in a subreddit and see instantly what is happening within the subreddit. Which content types perform best, how engaged the users are, where does the content come from?
I needed this application to work without any authentication or setup--no OAuth, no API keys, just the free public Reddit JSON API.
Technology Used The application is purely frontend--a React/TypeScript single page application that uses Vite to bundle and Tailwind CSS v4 to style.
Data Pipeline The public Reddit API provides unauthenticated JSON endpoints for subreddit metadata and post feeds:
https://www.reddit.com/r/{name}/about.json- subreddit metadata https://www.reddit.com/r/{name}/{feed}.json?limit=10- posts in top/hot/new feeds I wrapped these fetches in a cancelable useEffect and used an isCancelled flag to ensure stale requests didn't overwrite new responses.
Analytics Engine For each subreddit, I generate three charts from the scraped post data:
- Upvotes Distribution- A ranked chart showing which posts scored the highest, to give an idea of the highest engagement stories.
- Engagement Scatter Plot- Plotting upvotes (u) vs. Comments (c) allows one to view content as a percentage: c/u tells a story of controversy vs. Content-heavy posts.
- Domain Breakdown- Aggregating domains from links, this chart immediately shows whether the subreddit has high engagement with text-posts (self.[subreddit]) or links.
The charts are generated using Recharts with custom tooltips and an automatic coloring across plots.
Challenges
- Rate limiting/redirect error cases- The public API redirects misspelled or banned subreddit names to the search results rather than failing a request, forcing me to look at the JSON payload itself (specifically, data.kind and data.data.display_name).
- Cleaning up old requests- Rapid successive lookups would eventually overwrite responses, making older lookups show on newer subreddits. The isCancelled flag pattern made this work nicely without adding another library dependency.
- Responsive Charting- Making the charts responsive was tricky since Recharts uses fixed width components for most charts, so the use of ResponsiveContainer with fixed height wrappers worked out.
Takeaways
- The free public API has surprisingly useful data, even for reading only.
- The scatter plot for engagement metrics proved to be very useful for visually displaying the personality of subreddits.
- Treating error conditions the same way you would treat success conditions when dealing with users made it possible to show something useful when things went wrong.
Built With
- css
- html
- json
- react-native
- tailwind
- typescript
- vite
