-
-
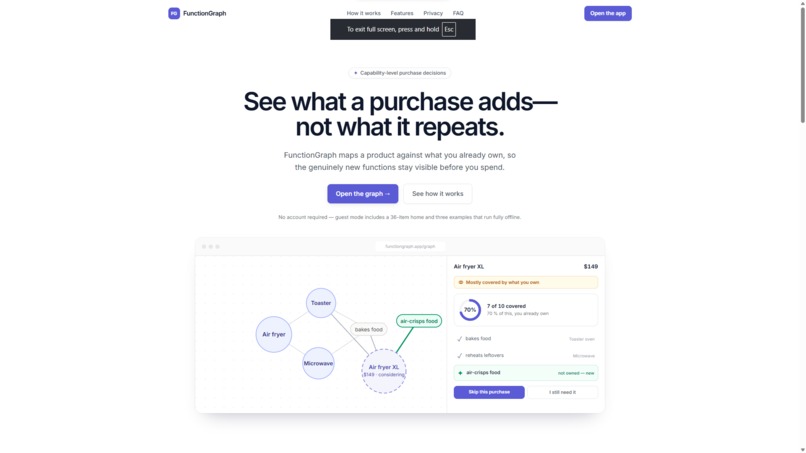
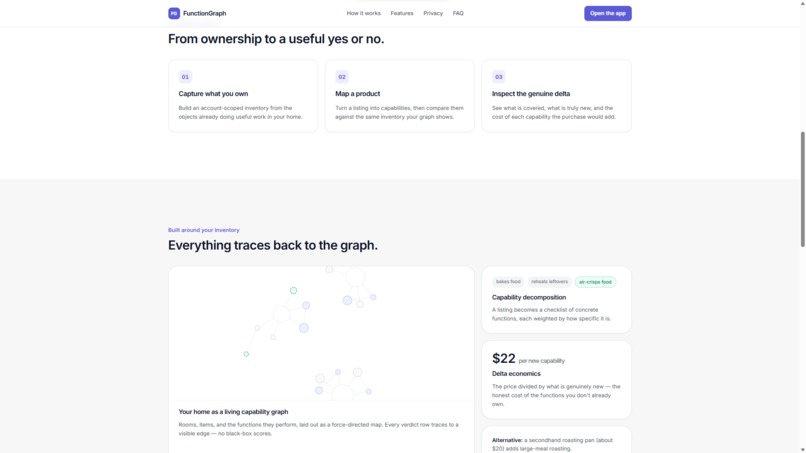
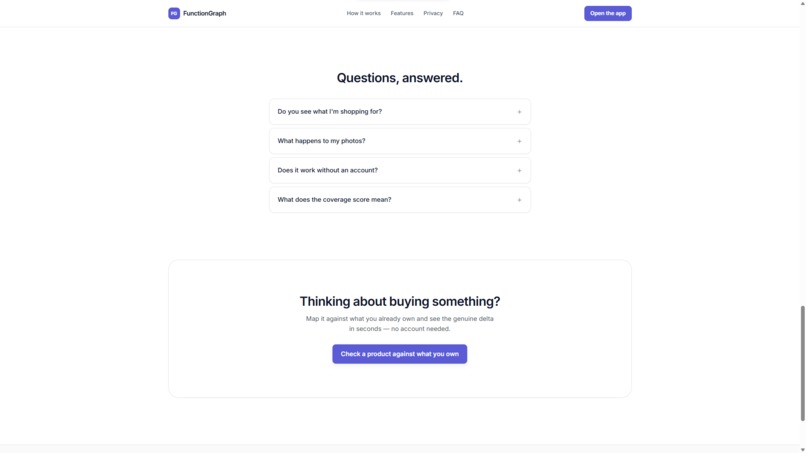
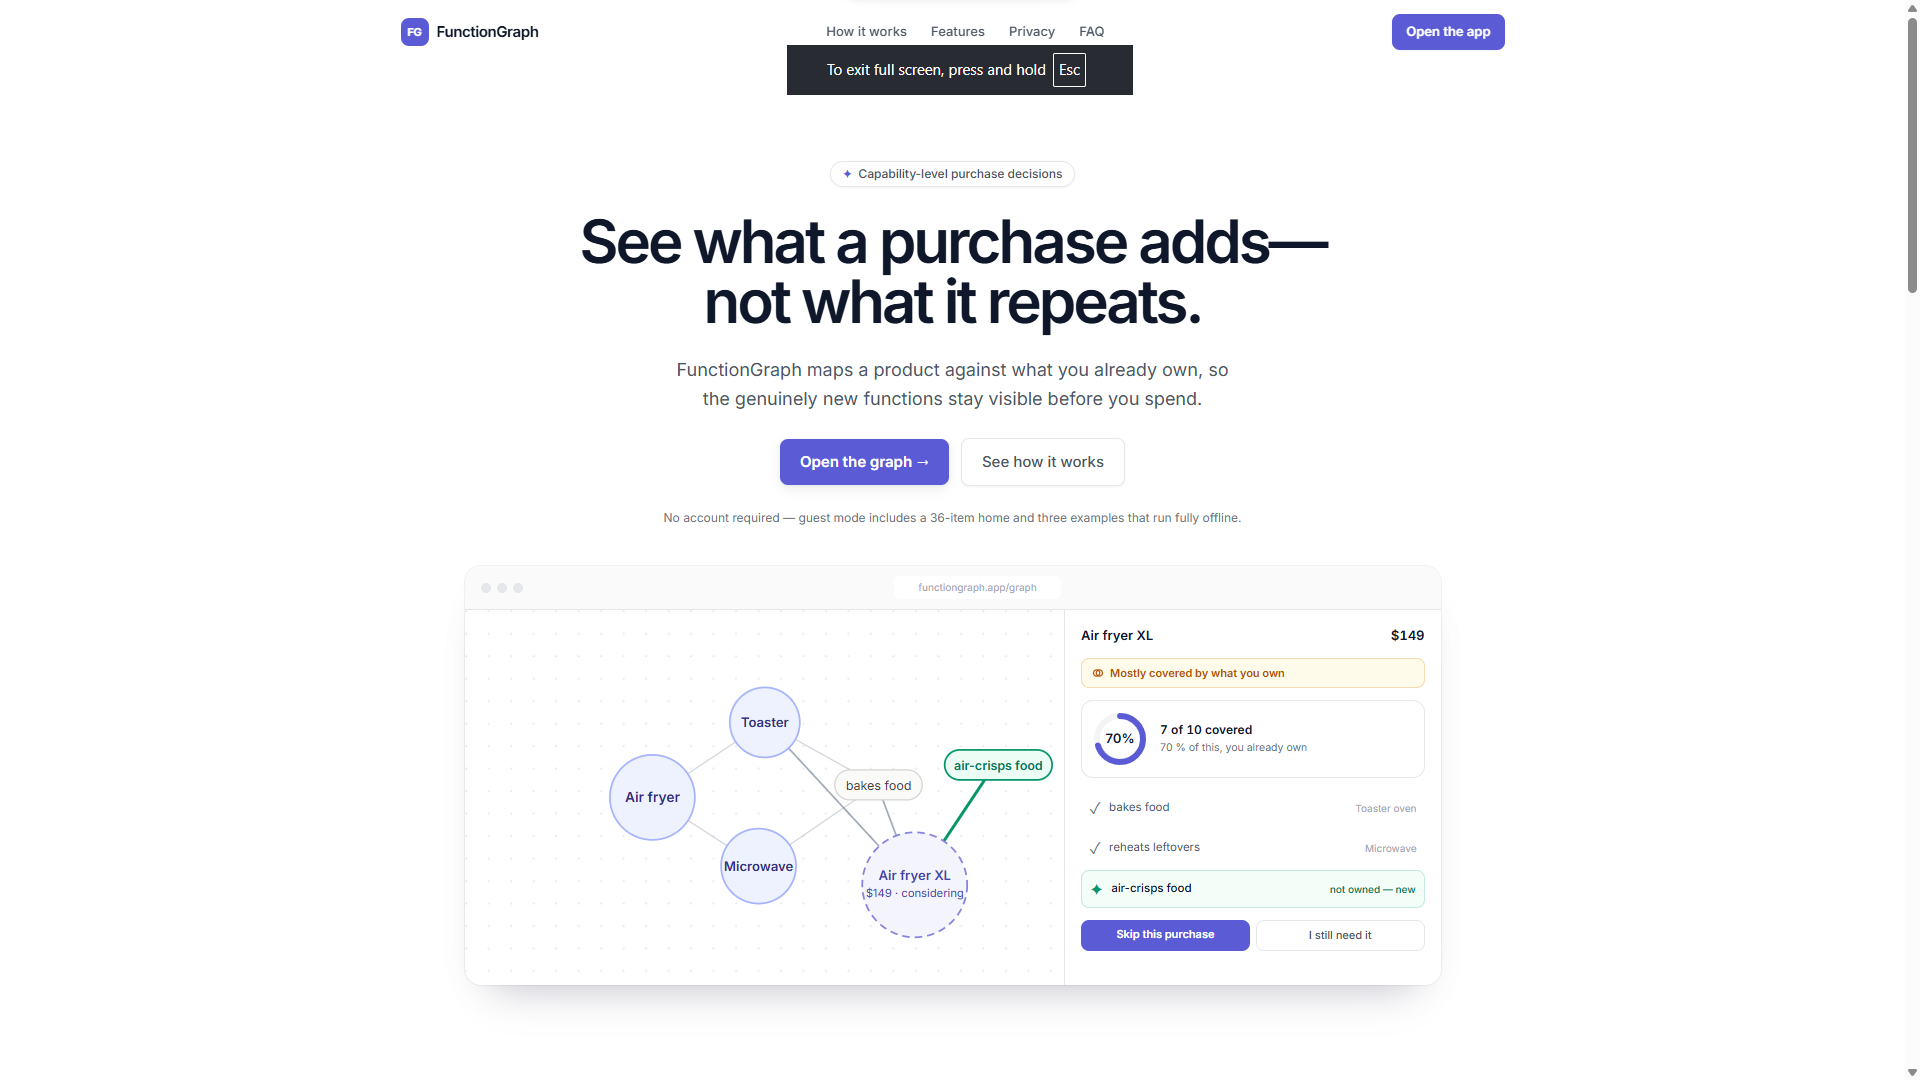
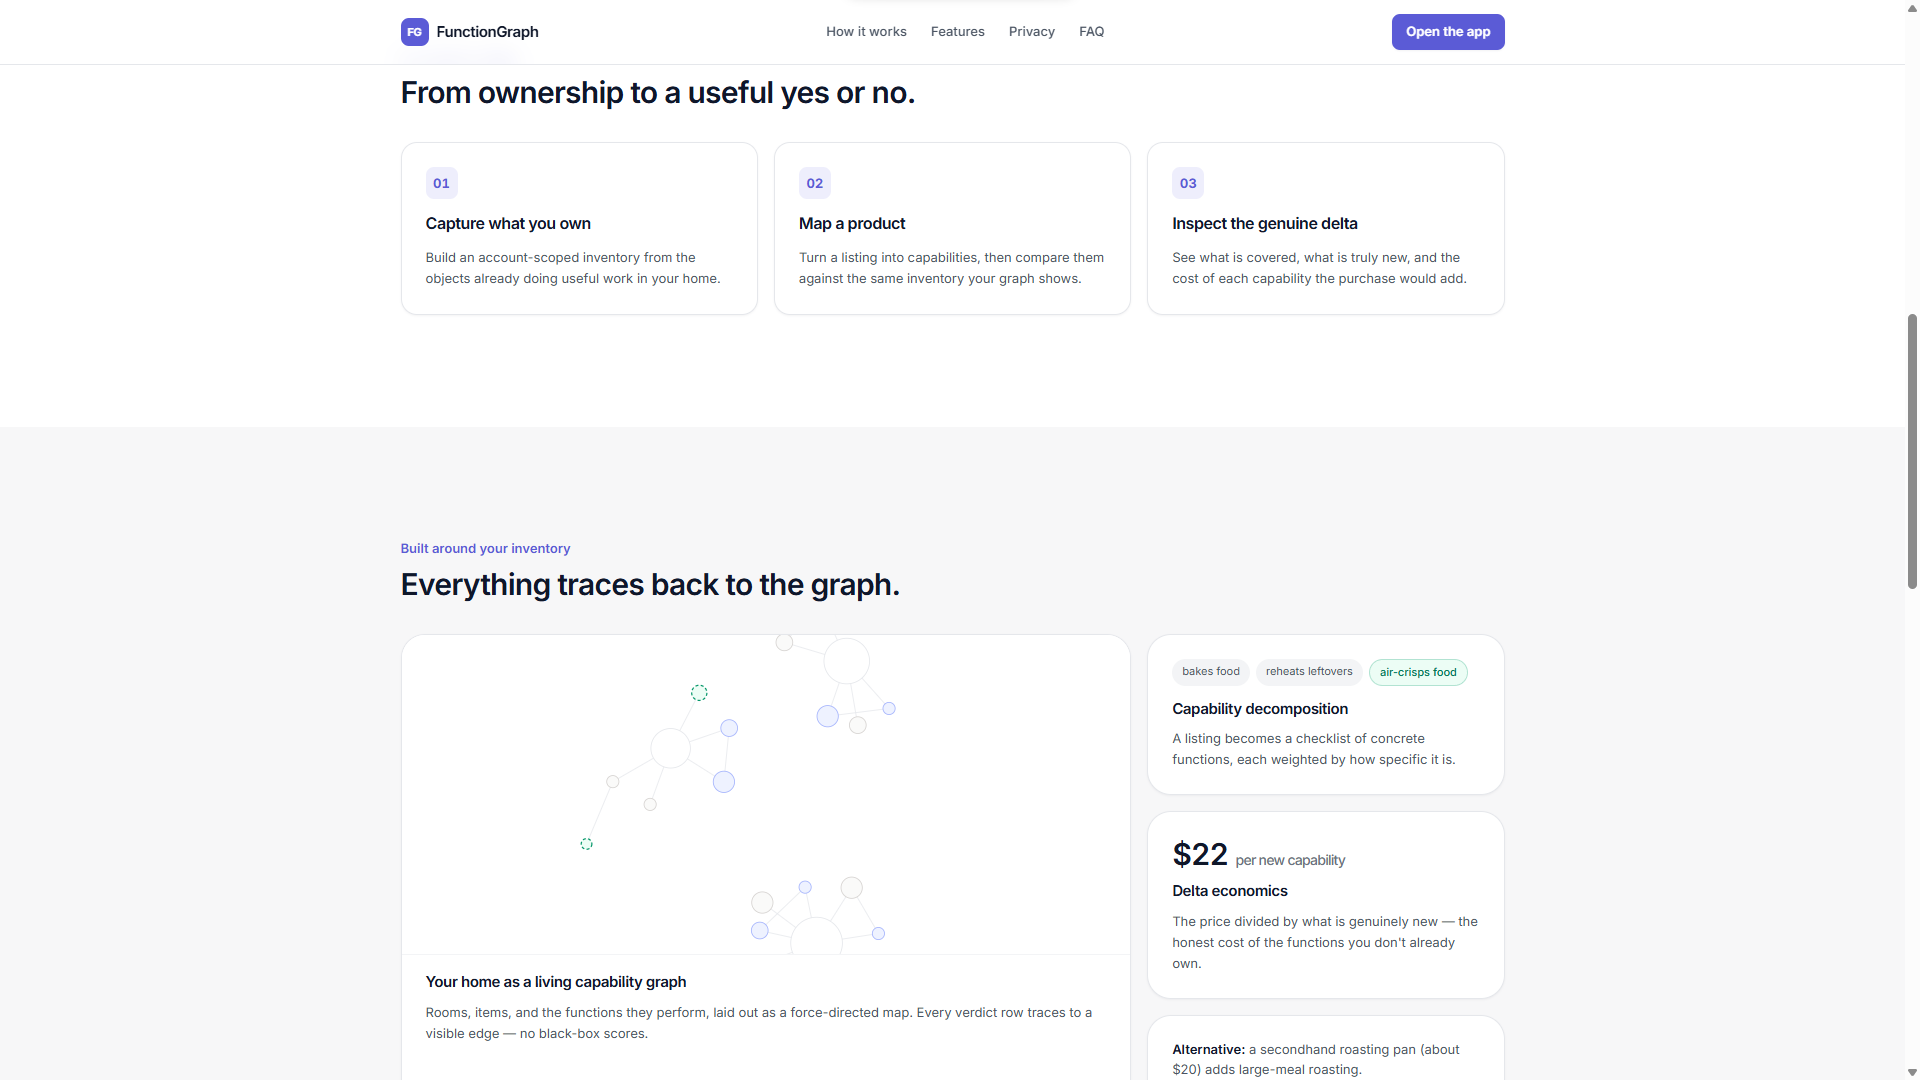
Landing page
-
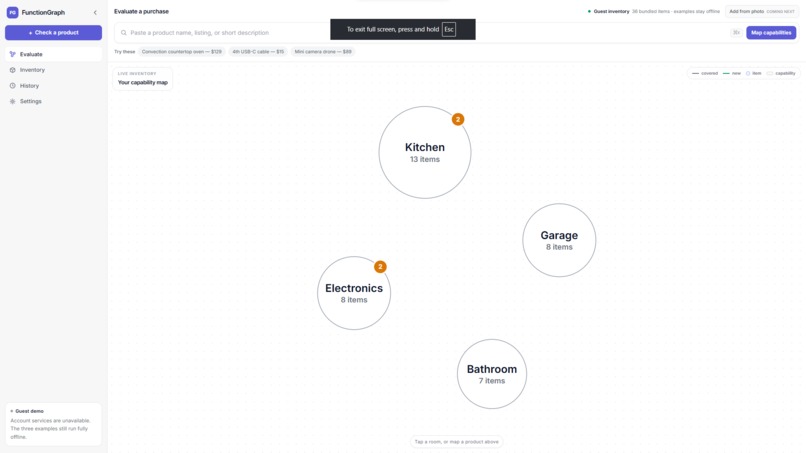
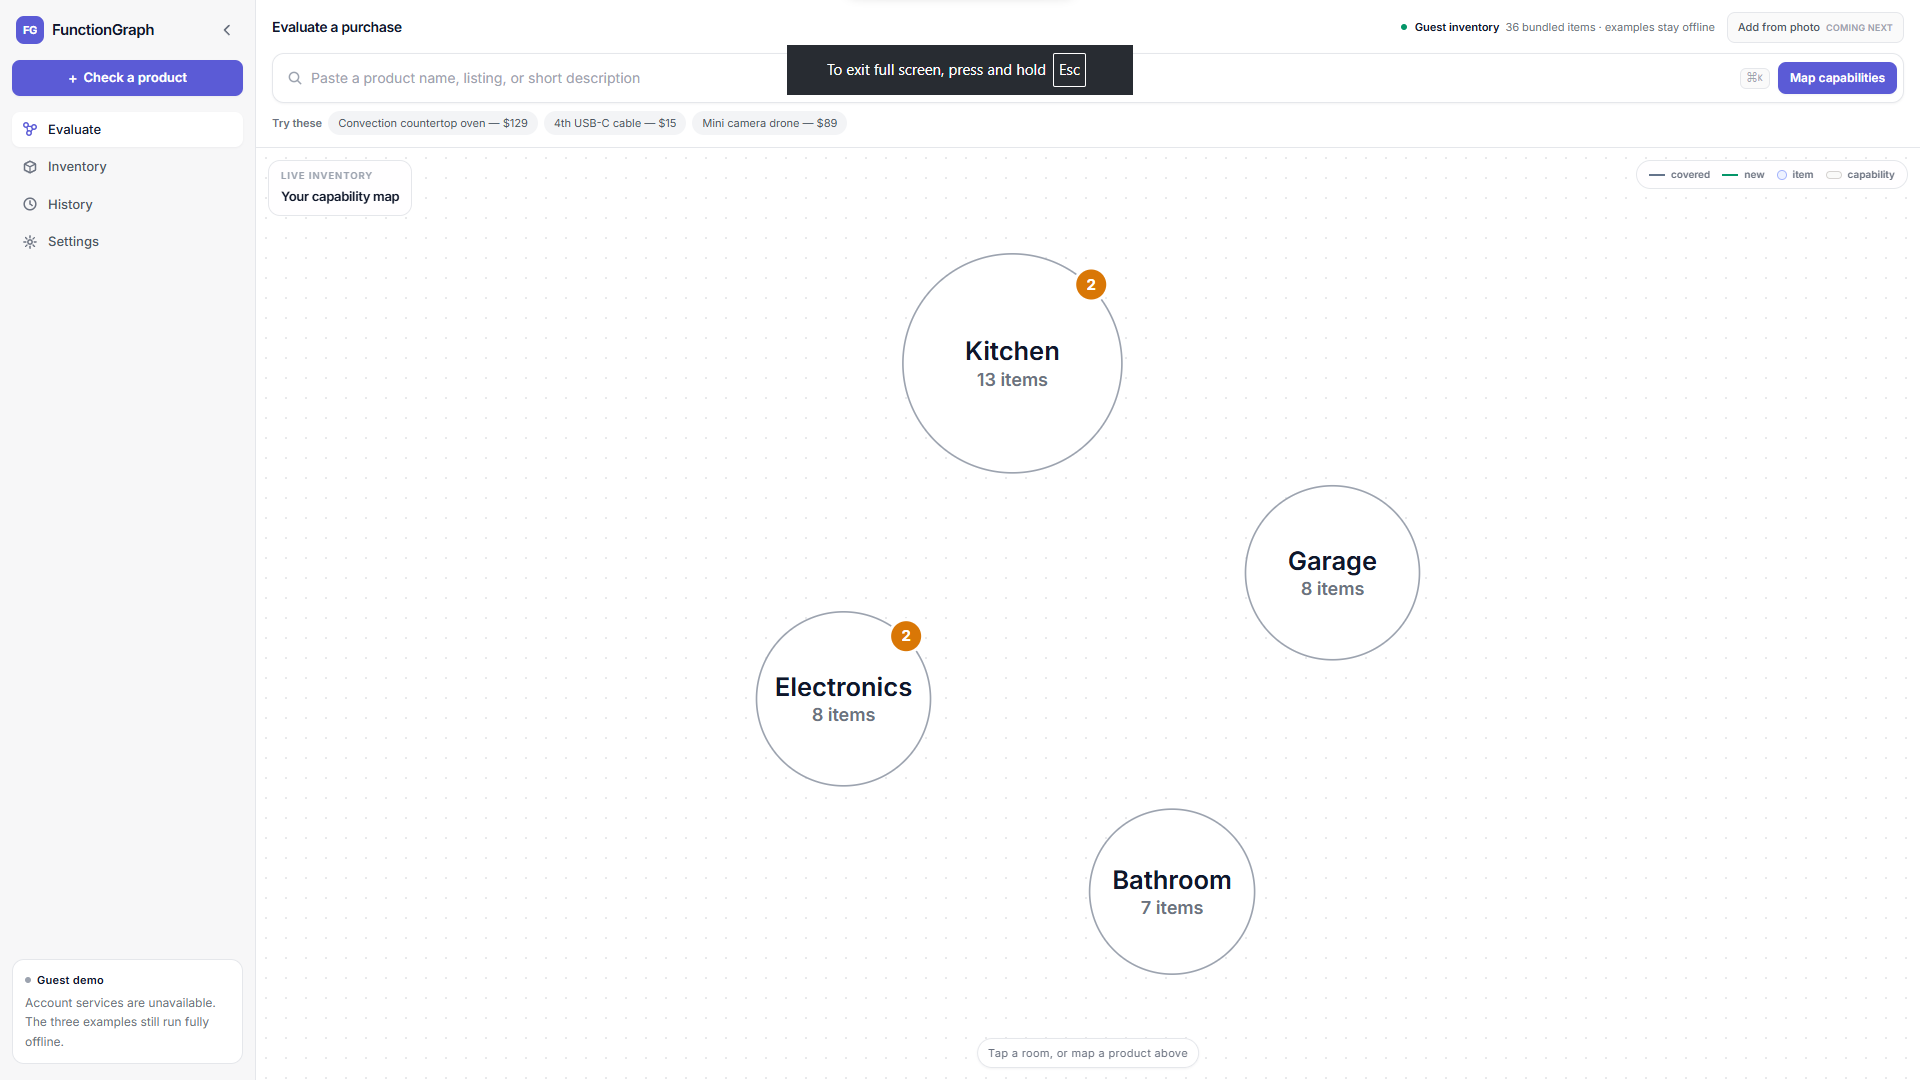
Item categories
-
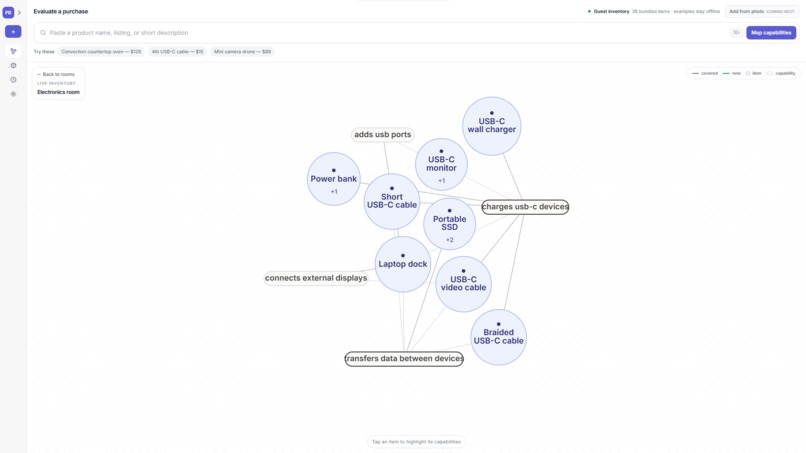
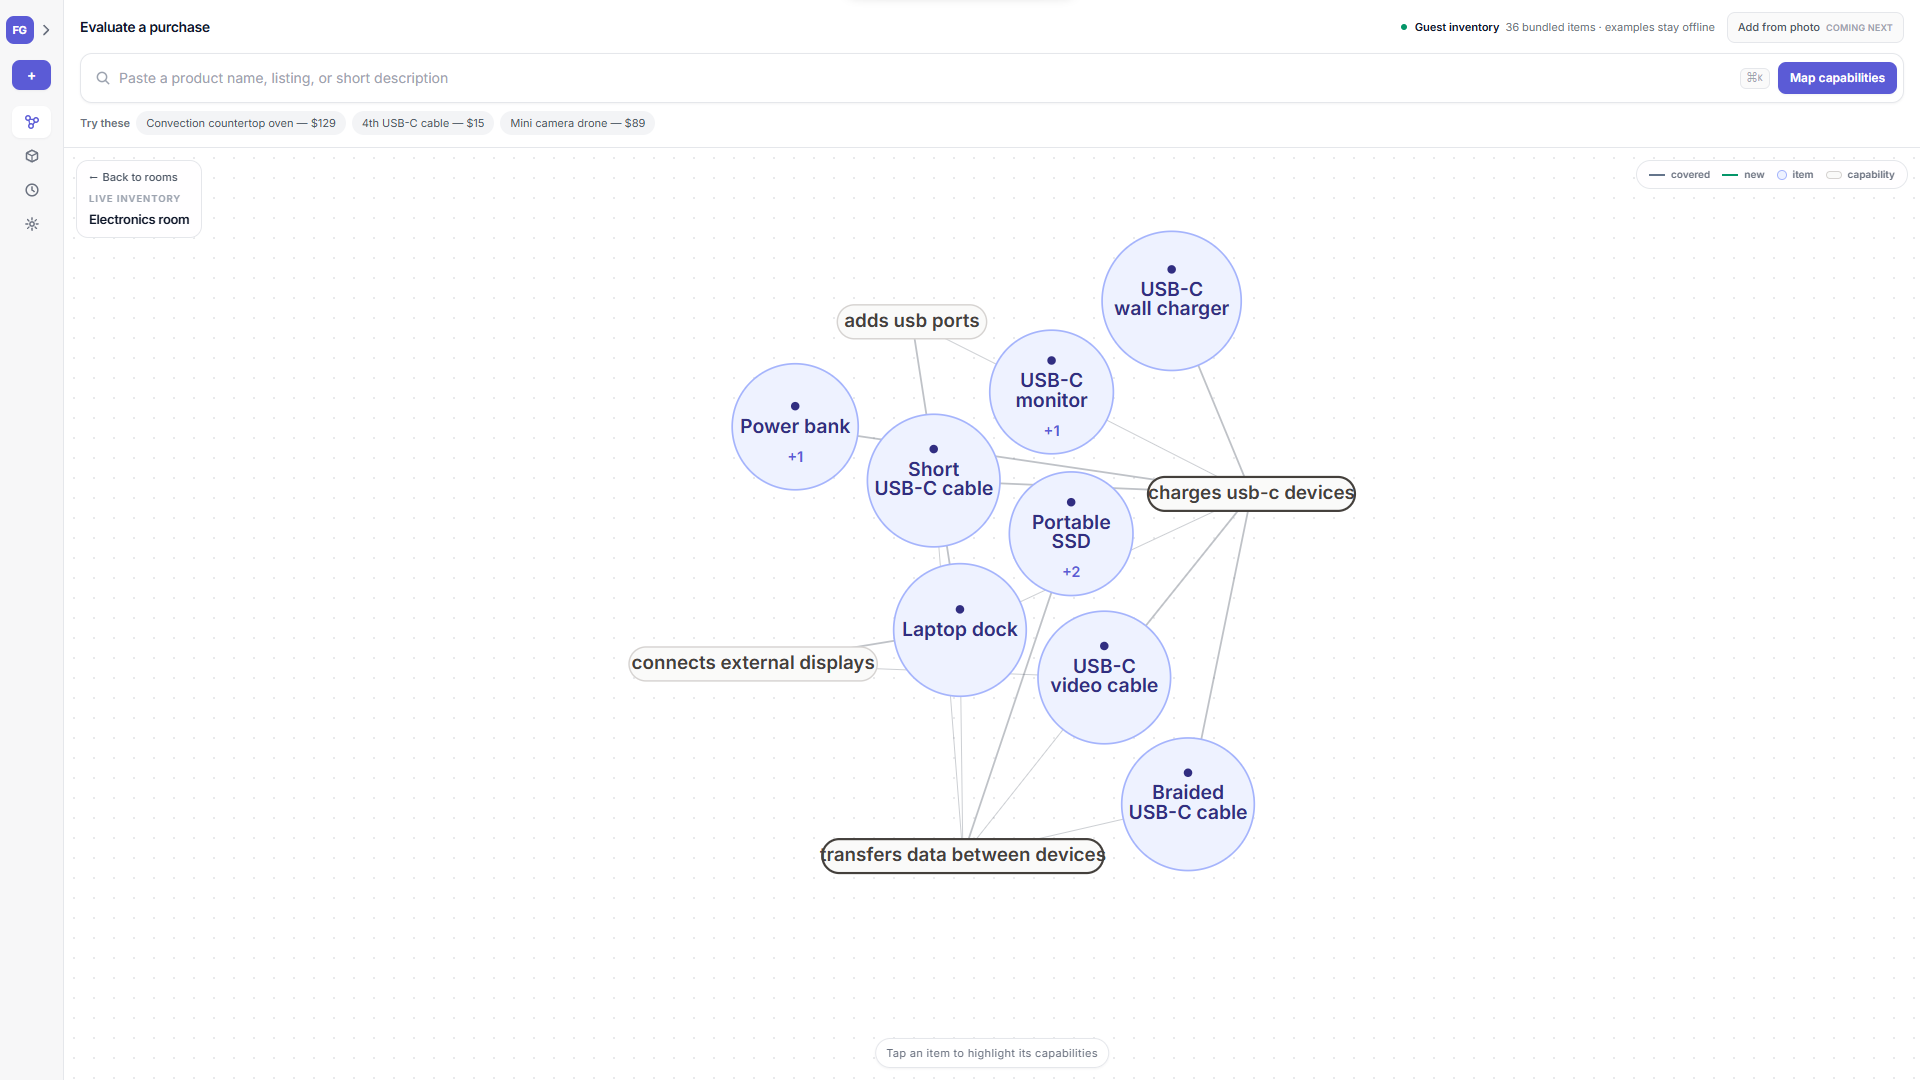
Graph visualiser
-
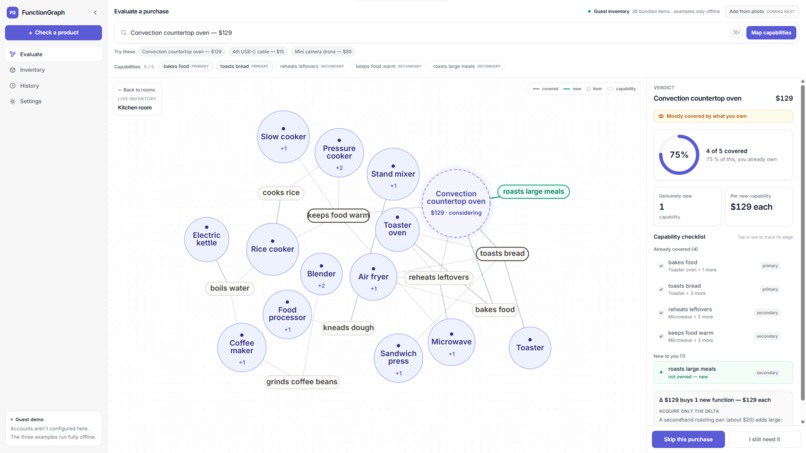
Analysis
-
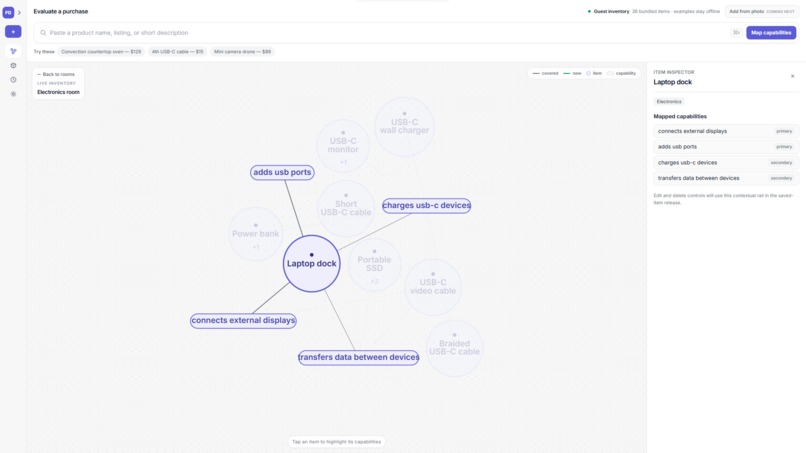
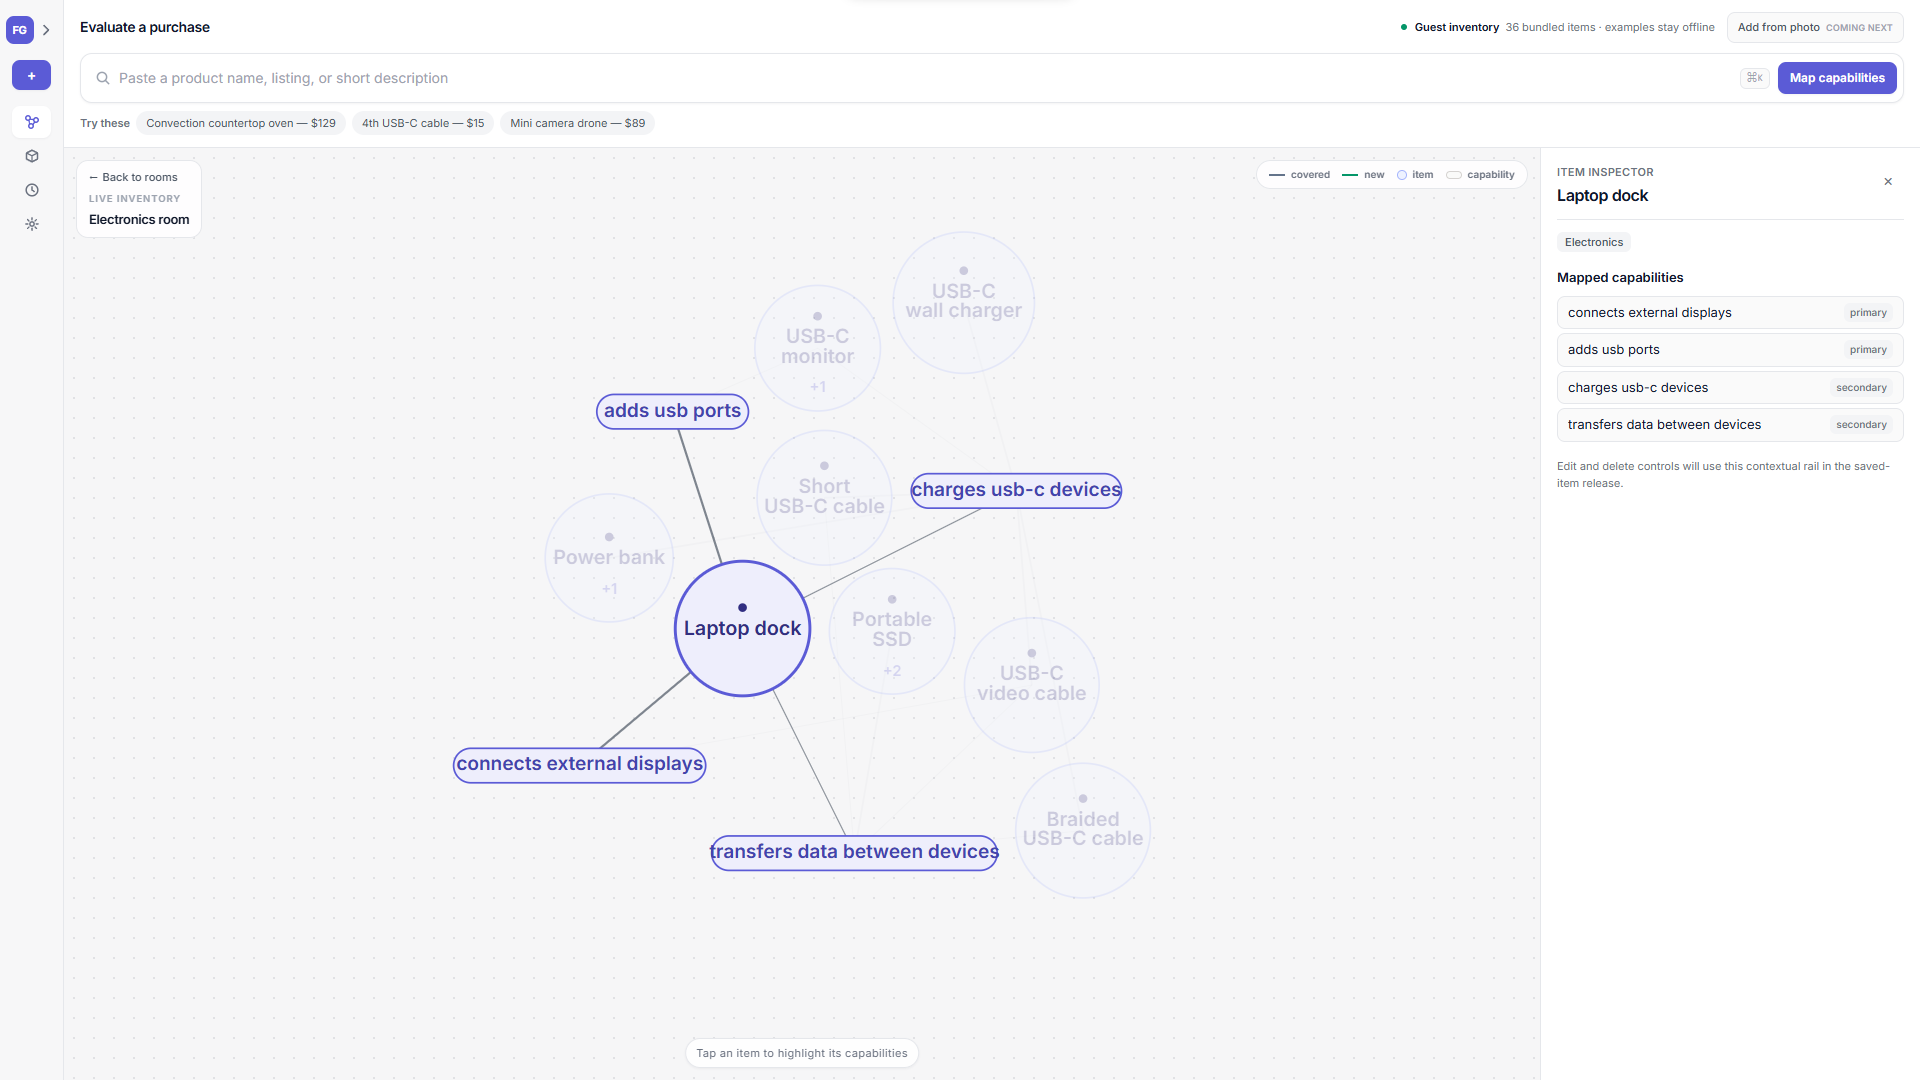
Highlighted connections
-
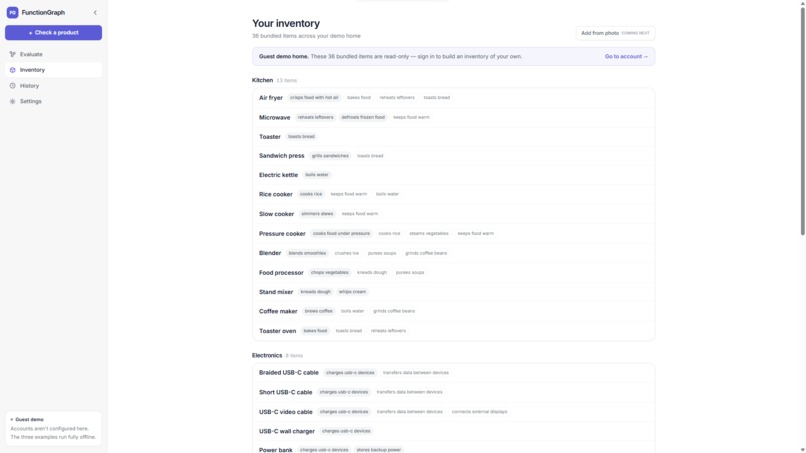
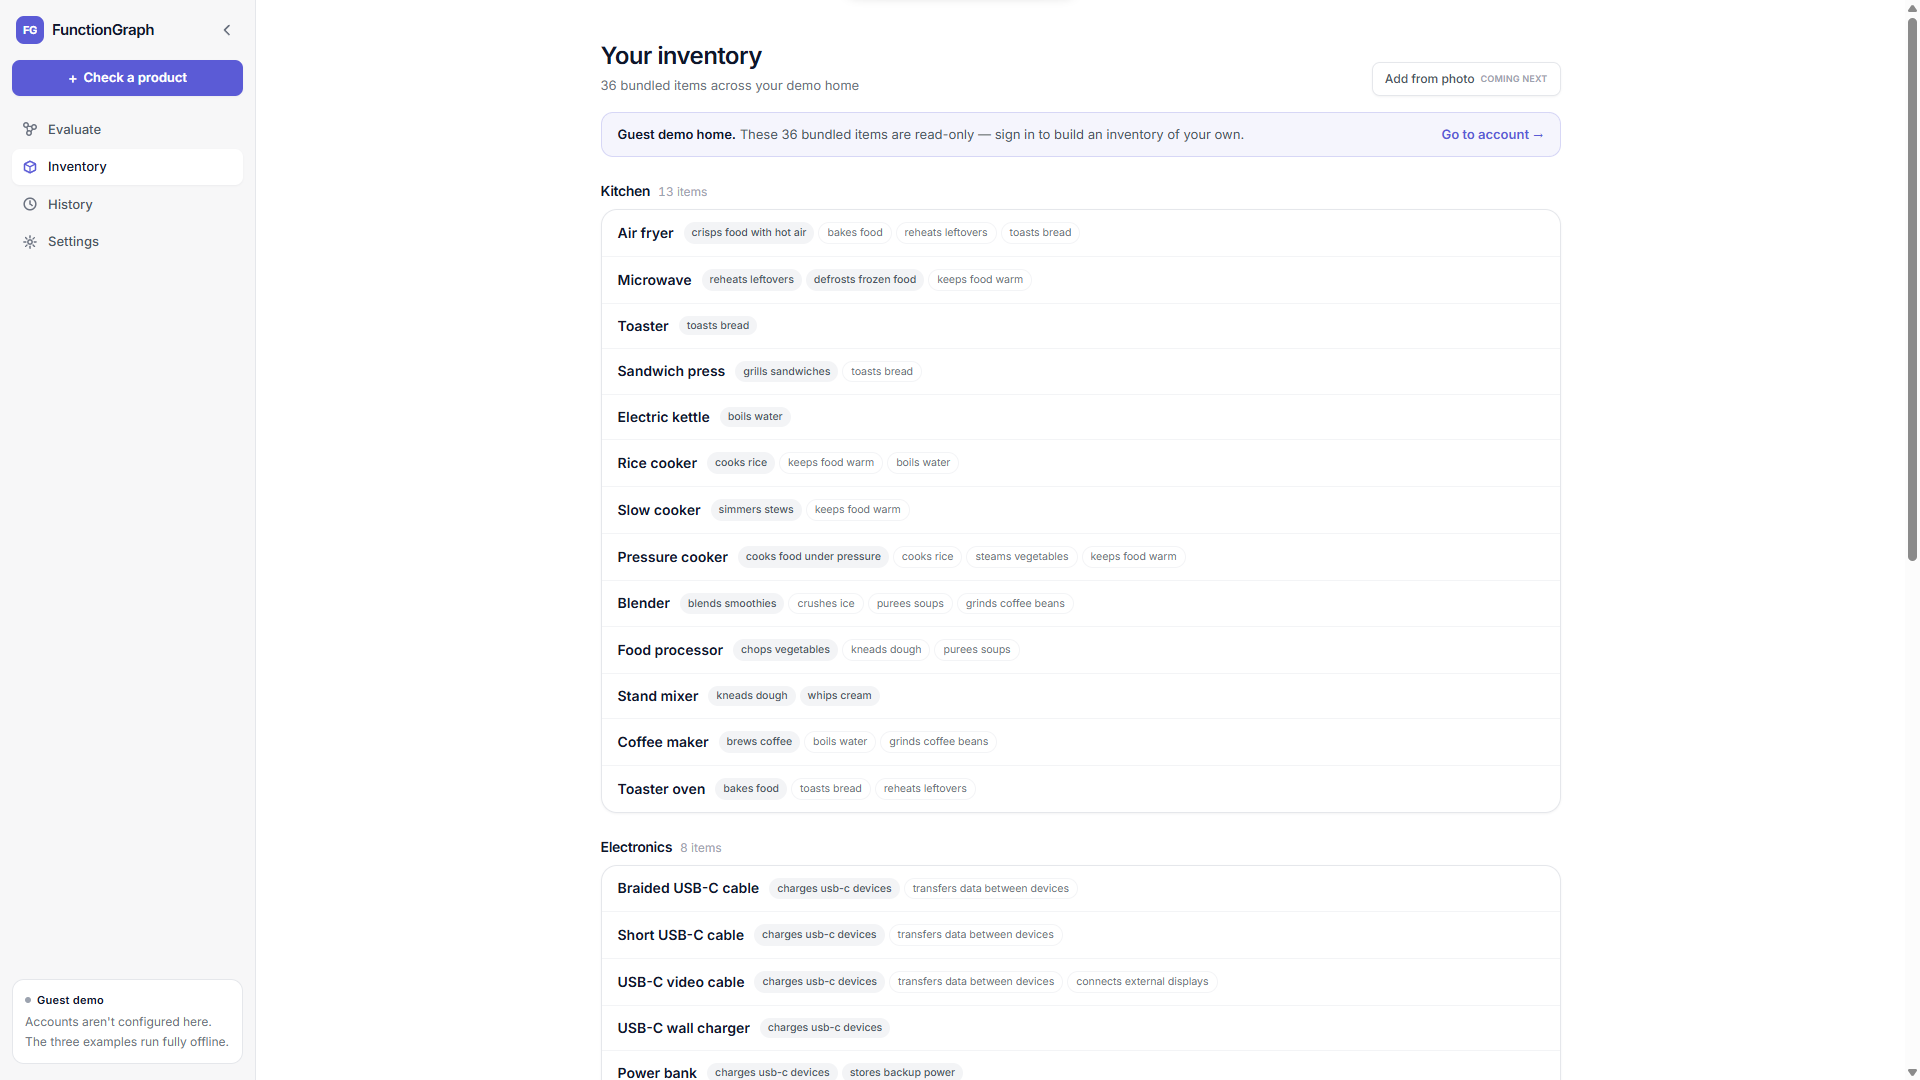
Inventory
-
-
-
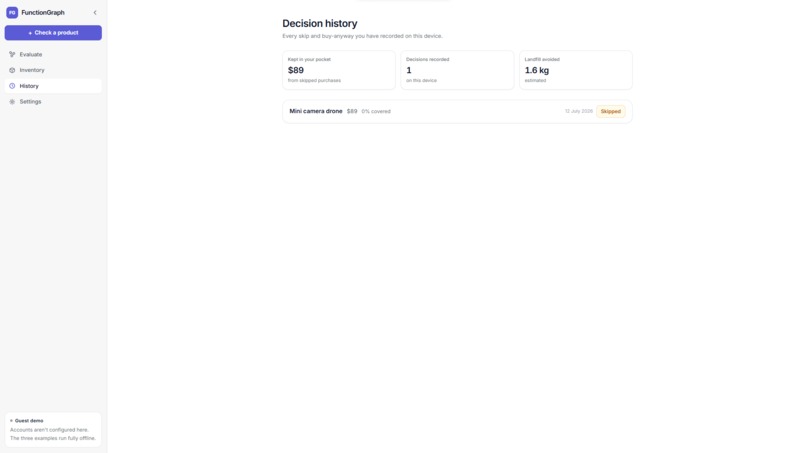
SubGraph
Inspiration
Shopping platforms compare products by brand, features, reviews, and price, but they rarely answer a more personal question:
What does this add beyond what I already own?
Products that look different can perform many of the same functions. An air fryer and a countertop oven are separate products, for example, but several of their capabilities may overlap.
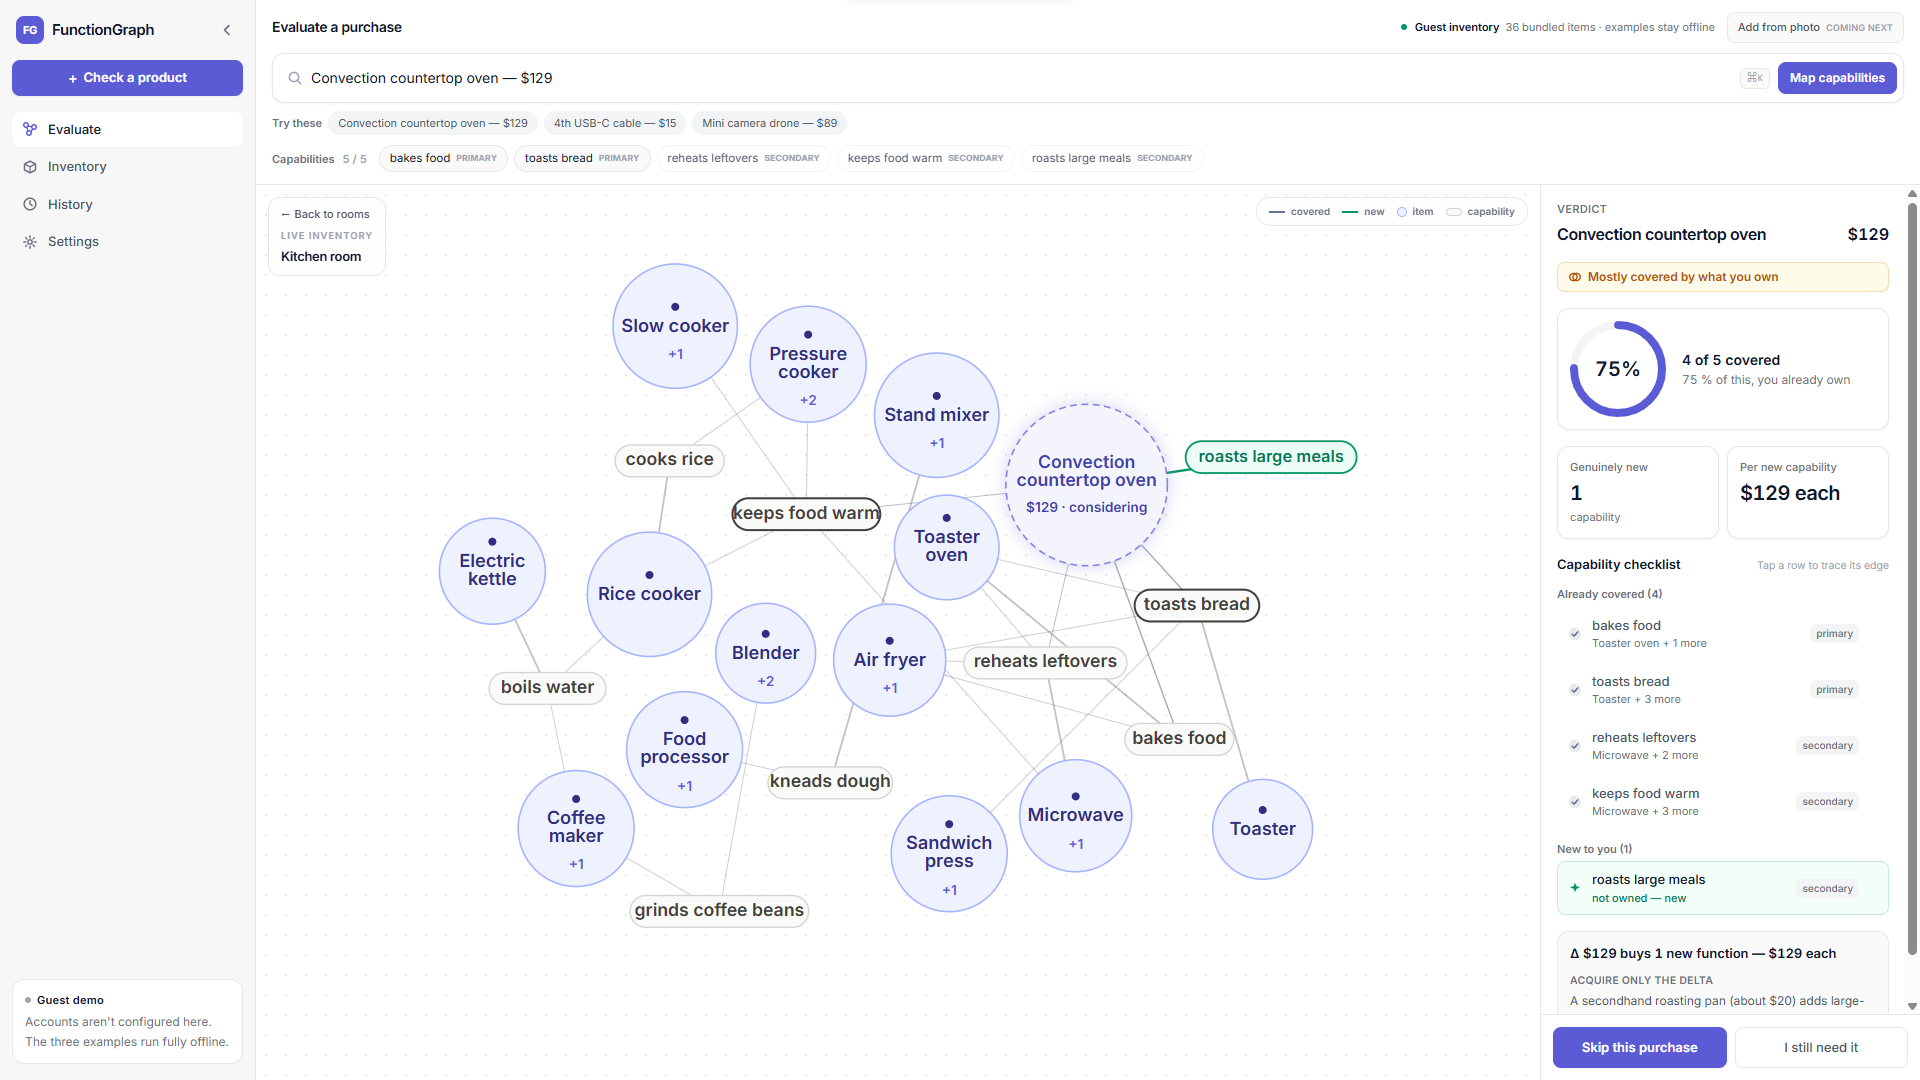
SubGraph identifies this functional overlap. It shows what is already covered, what is genuinely new, and what the user is paying for the difference.
It does not tell people whether they should buy something. It gives them evidence to make a more informed decision.
What it does
SubGraph turns a household inventory into an interactive capability graph.
When a user evaluates a product, SubGraph:
- Breaks it into three to eight functional capabilities.
- Compares those capabilities with every item they already own.
- Calculates how much of the product is already covered.
- Identifies the capabilities that are genuinely new.
- Shows the cost of each new capability.
- Maps every result to an inspectable edge in the graph.
- Suggests a cheaper or secondhand way to obtain the missing capability when appropriate.
For example, a countertop oven may overlap heavily with appliances already in the kitchen while still adding one useful function. SubGraph shows both the overlap and the new value instead of returning a simple buy-or-skip verdict.
Signed-in users can photograph a room, review the detected items, and save a personal inventory. Detected items remain provisional until confirmed. Images and temporary scan data are discarded after review; only confirmed inventory fields are stored.
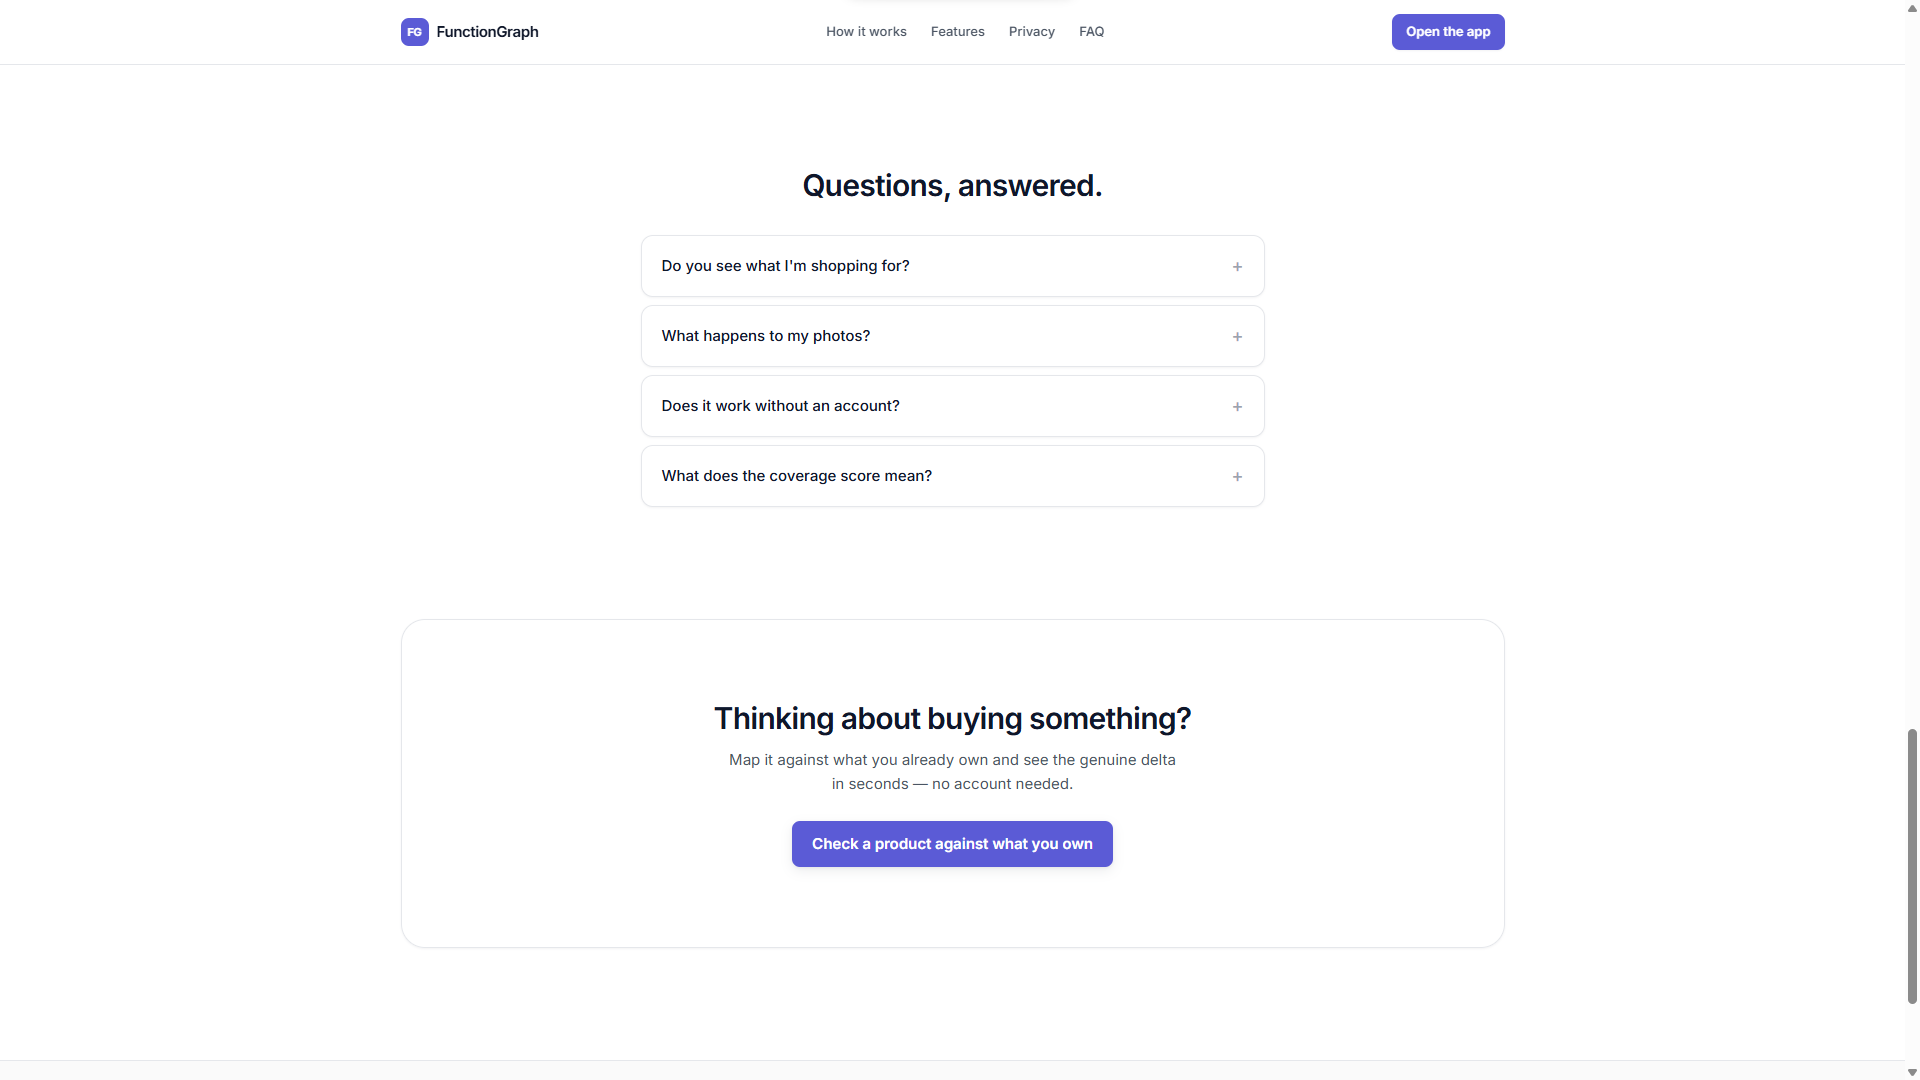
Three built-in demonstrations work without signing in:
- A countertop oven with substantial overlap.
- A completely redundant fourth USB-C cable.
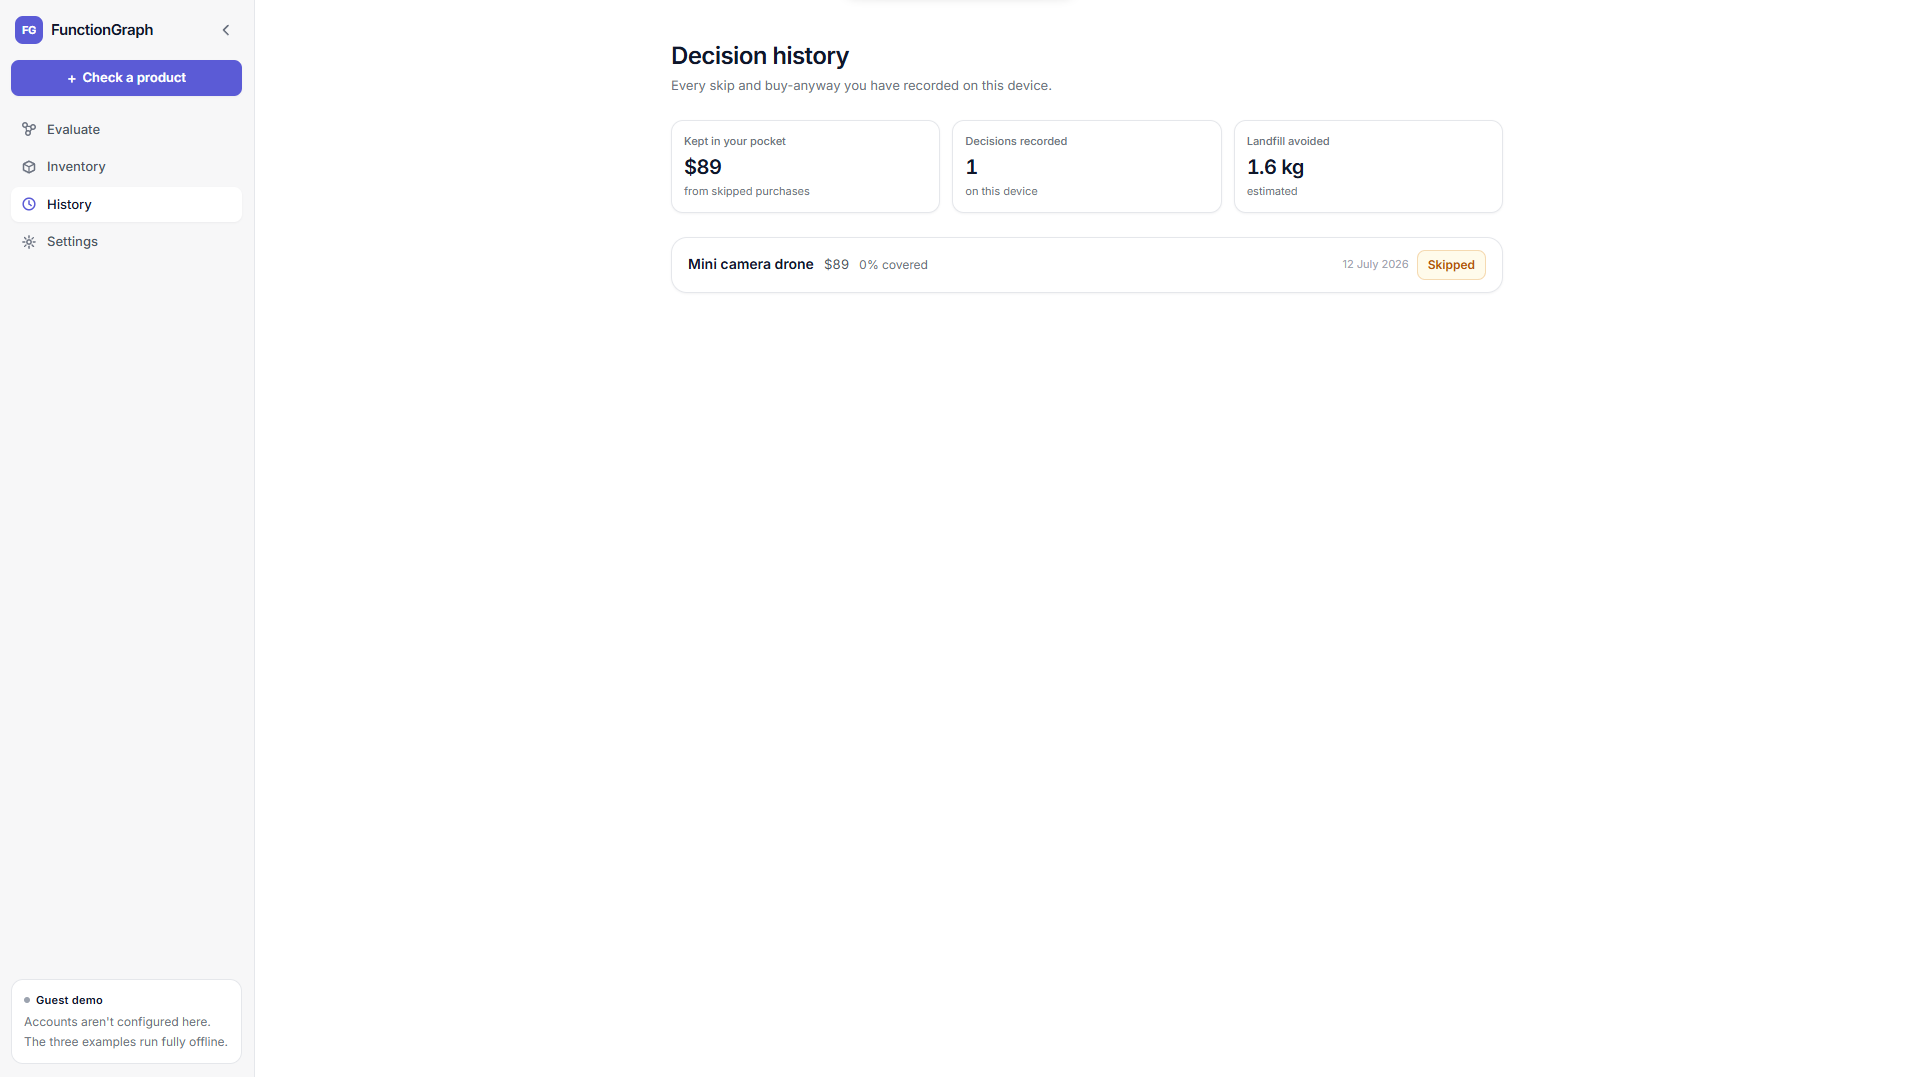
- A mini drone with genuinely new capabilities.
How we built it
| Technology | Purpose |
|---|---|
| React and TypeScript | User interface and application logic |
| D3 and SVG | Interactive force-directed capability graph |
| OpenAI structured outputs | Product and capability decomposition |
| OpenAI vision | Provisional item detection from room photos |
| OpenAI embeddings | Semantic capability matching |
| Clerk | Authentication |
| Neon Postgres | User inventory storage |
| Neon pgvector | Capability embedding storage and lookup |
| Drizzle ORM | Typed database access and migrations |
| Vercel Functions | Server-side evaluation, photo processing, and inventory APIs |
| Vercel | Hosting and deployment |
SubGraph represents capabilities using consistent verb-object phrases such as:
toasts breadcrisps food with hot aircharges usb-c devices
It first checks for exact matches. Unmatched capabilities are embedded and compared with the active inventory vocabulary using cosine similarity.
Coverage is directional and weighted:
$$ \text{coverage} = \frac{\sum_{\text{covered}} w_{\text{specificity}} \cdot w_{\text{tier}}} {\sum_{\text{all}} w_{\text{specificity}} \cdot w_{\text{tier}}} $$
Primary capabilities receive more weight than secondary ones, while capabilities shared by many products receive lower specificity weights. This prevents generic functions from dominating the result.
The score is directional because it measures how much of the proposed product is already covered by the user’s inventory, rather than how similar two products are.
D3’s force simulation creates clusters from shared capabilities instead of fixed positions. The graph and verdict list are generated from the same data, so every result can be traced to a visible connection.
Challenges we faced
Defining functional overlap
Product-name matching was too shallow, while unrestricted AI output produced inconsistent capability descriptions.
We combined structured model output, a strict capability naming convention, exact matching, embeddings, and an inventory-specific vocabulary.
Preventing misleading matches
Generic capabilities could make unrelated products appear more redundant than they actually were.
We addressed this with specificity weighting, primary and secondary capability tiers, and directional scoring.
Making the graph useful
The graph needed to explain the result rather than act as decoration.
Every verdict row and graph edge is derived from the same underlying data. Users can inspect which existing item covers each capability.
Handling photo recognition responsibly
Room scans may contain incorrect detections or private information.
Detected items remain editable and are never added automatically. Images, confidence values, model evidence, and temporary review data are not retained.
Keeping the demo reliable
Live model and database requests can fail during a demonstration.
We added deterministic offline examples that use the same scoring and graph logic as live evaluations.
What we learned
We learned that directional functional coverage is more useful than generic product similarity.
The important question is not whether two products resemble each other. It is how much of the proposed product is already covered by the user’s entire inventory.
We also learned that visualization can act as an audit trail. Mapping every result to a graph edge makes AI-assisted recommendations easier to understand and verify.
Most importantly, software designed to reduce unnecessary consumption must still be able to show when a purchase adds genuine value. SubGraph supports better decisions rather than blocking purchases.
What’s next
- Improve capability matching using reviewed user corrections.
- Replace the temporary waste-impact estimate with category-specific data.
- Connect missing capabilities with local secondhand options.
- Support product evaluation directly from listing URLs.
- Test the system with larger and more varied household inventories.
Built With
- clerk
- d3.js
- drizzle
- neon
- openai
- pgvector
- postgresql
- react
- svg
- typescript
- vite
- vitest


Log in or sign up for Devpost to join the conversation.