-
-
 GIF
GIF
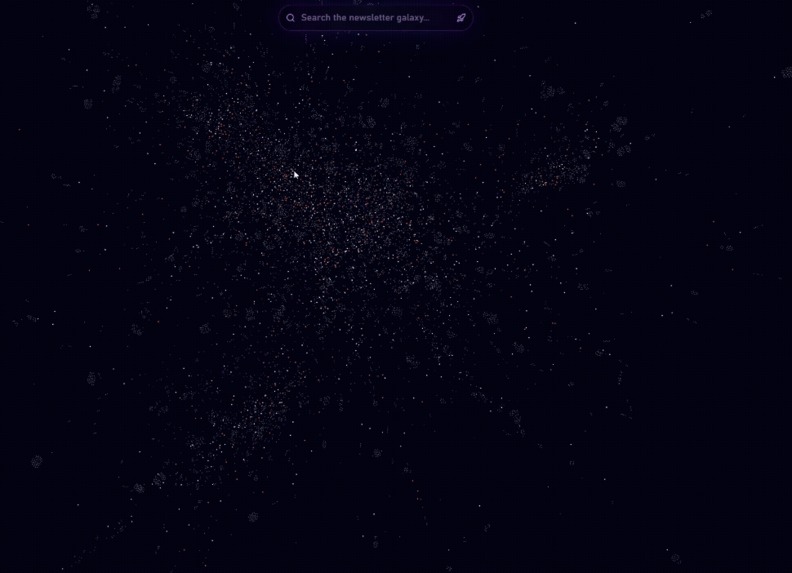
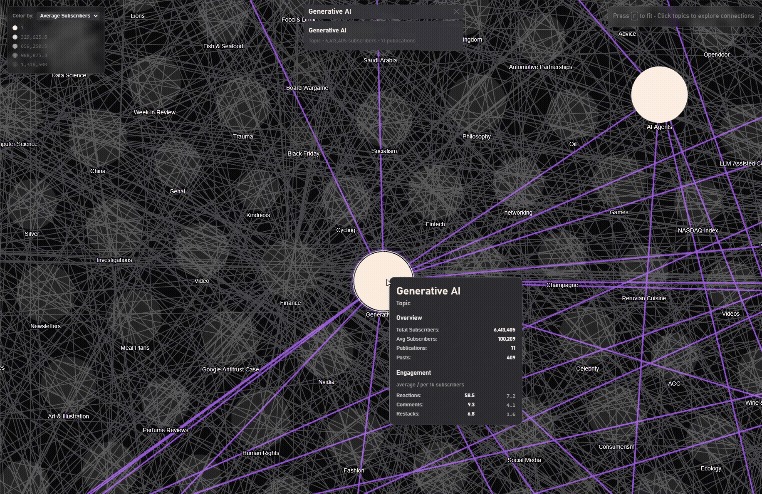
Substack Galaxy
-
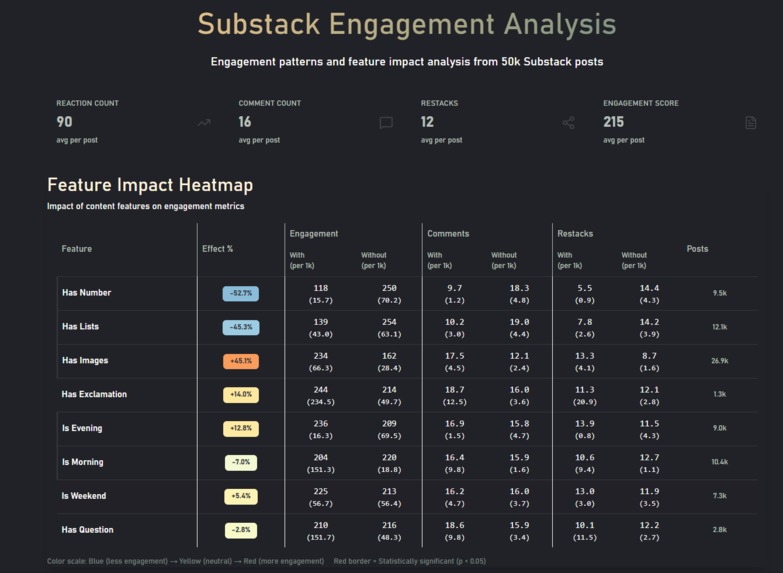
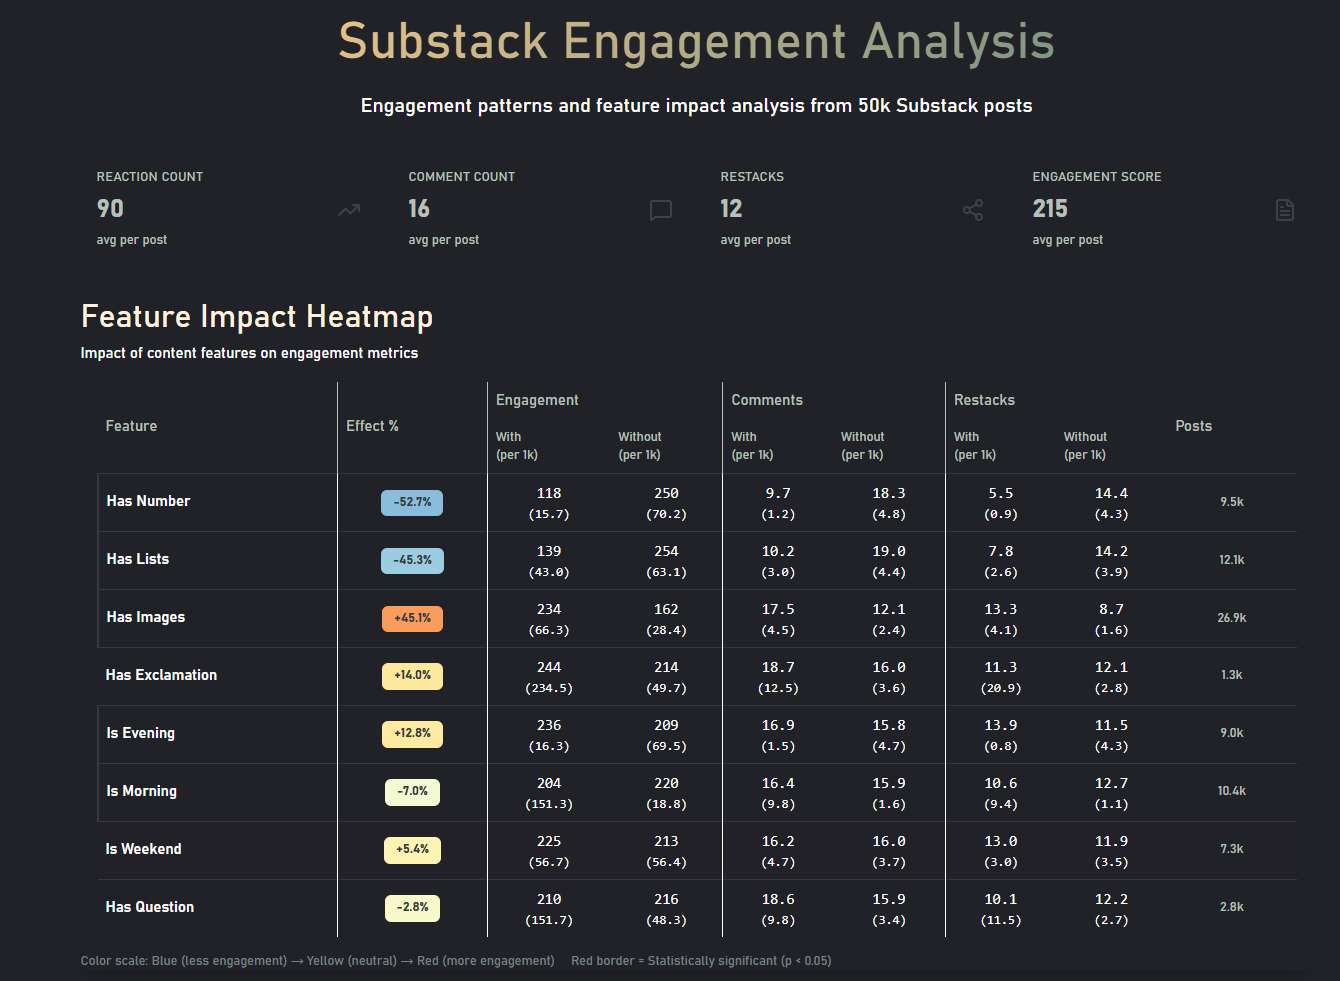
Statistically significant differences, on a quick overview
-
 GIF
GIF
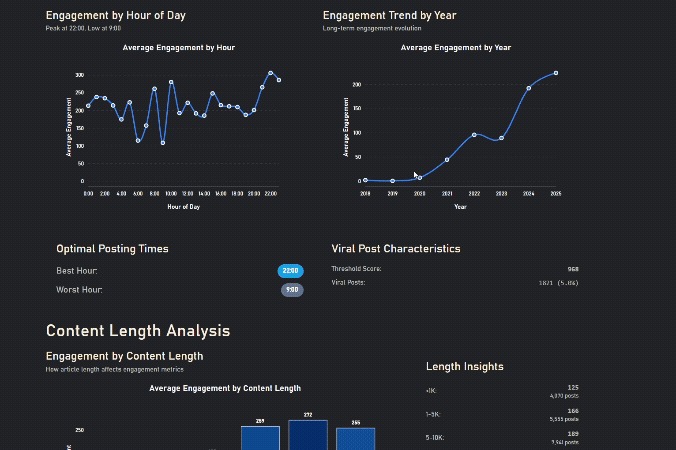
Engagement increases after work, zigzags in the morning as people have different schedules
-
 GIF
GIF
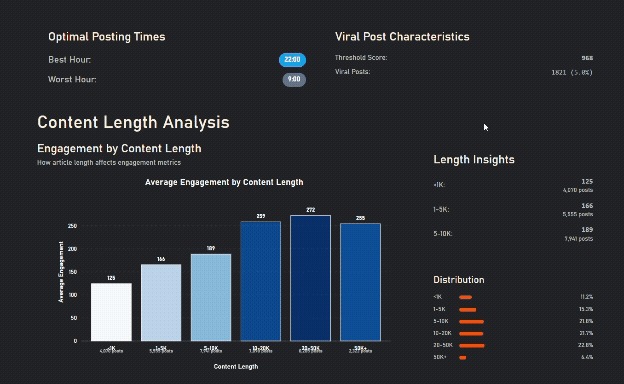
Longer Content gets more engagement, until it's too long
-
 GIF
GIF
Finding connected Topics
-

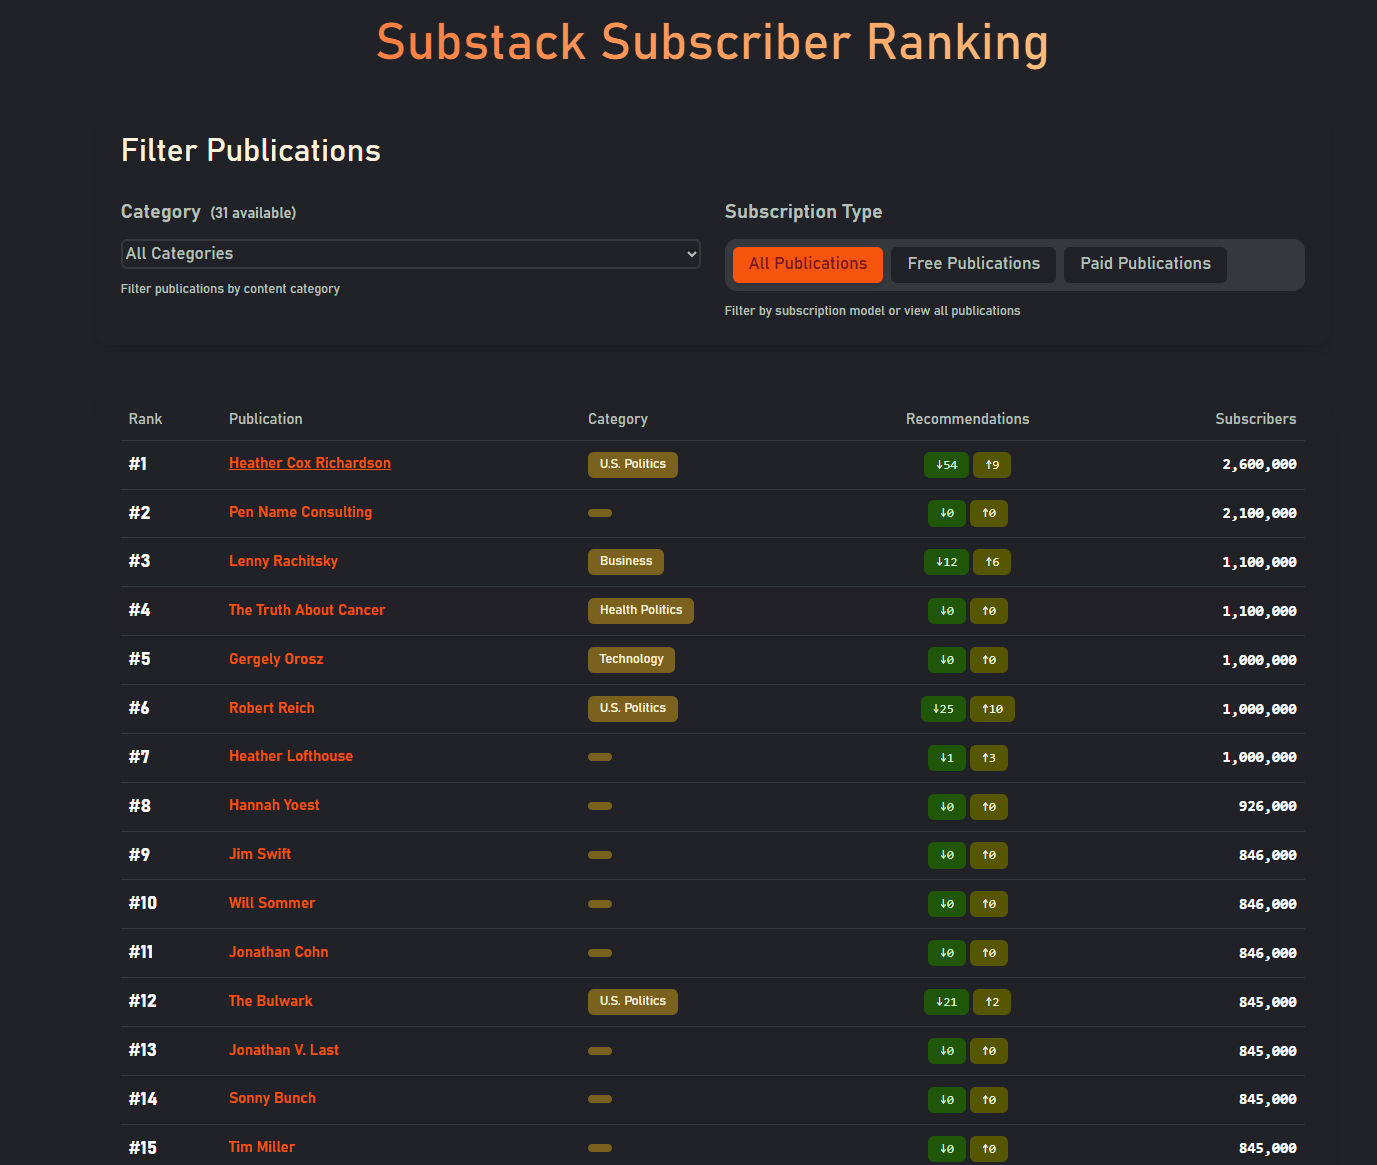
Substack Recommender Leaderboard
-
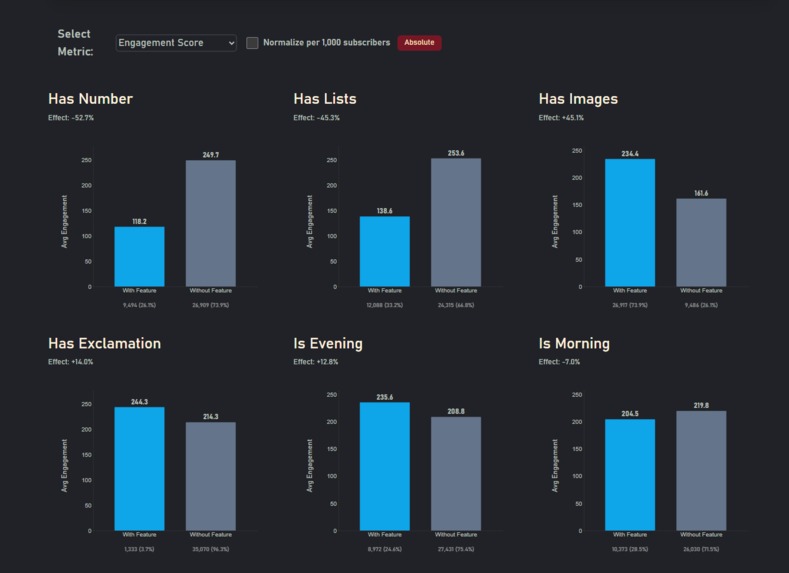
Numbers decrease engagement, people read _and_ comment on weekends
-
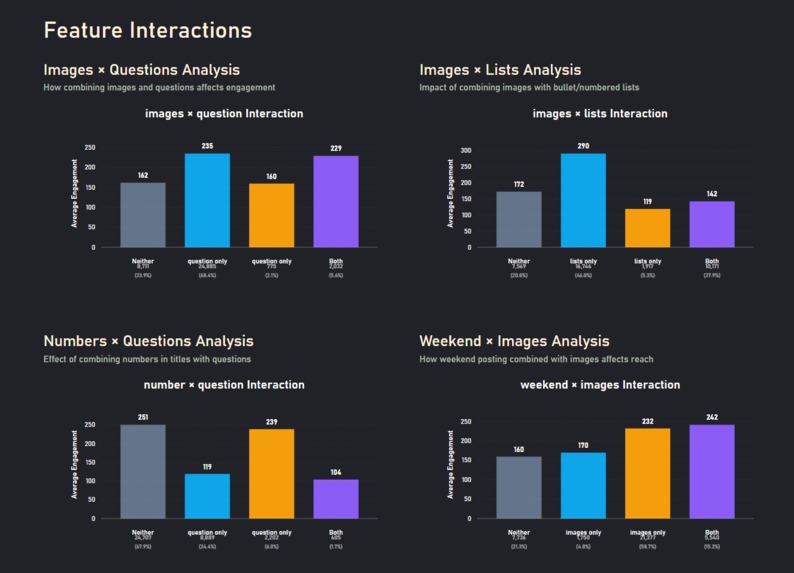
Details matter, images + questions do worse than either alone


Inspiration for subboom!
I love data. I love Substack. Subboom started as a playful Substack “galaxy” exploration, a galaxy-like map I built because I was curious about how newsletters connect. I did my thesis at the Social Networks lab at ETH Zurich, so networks and graphs are often on my mind.
I decided to go bigger when the hackathon got extended: I would transform that galaxy into a full analytics dashboard, helping readers discover new writers through recommendation networks and helping writers learn what drives engagement.
One-liner: Subboom turns the Substack universe into a fun, interactive research exploration for writers and readers—powered by analytics, networks, and Kiro-accelerated development.
What subboom! does
Subboom is a comprehensive analytics and visualization suite for the Substack ecosystem.
- Home / Leaderboard (
/) – Ranked publications with filtering (category, free/paid) and responsive tables. - Engagement Analysis (
/engagement) – Feature impact, time patterns (hourly/weekend effects), content-length correlations, and top-post exemplars. - Topic Explorer (
/topic-explorer) – Sort/search topics; scatter plots, bar charts, sparklines, treemap, engagement rates per topic and more. - Topics Overview (
/topics) – topic galaxy (force graph), with search, node sizing, and network toggles. - Categories (
/cats) – Category stats (mean/median/min/max/std dev), recommendation in/out counts. - Categories Graph (
/graph/cats) – category network graph, to be extended with more data. - Substack Galaxy (
/graph/recommendation-map) – High-performance 2D map with fuzzy search, 10k+ newsletters, smooth focus animations, and recommendation edges. The original idea. The seed, also why I chose the name, subboom, because the animation feels like a big bang of publications coming to life.
Who it helps
- Writers: pick collaborators that could connect to bigger audiences via their recommendation network, learn when to post, what topics are trending/competitive, and which title features hurt/help engagement and what type of content works in which topic, also, details matter!
- Readers: traverse “mini-clusters” of connected newsletters; discover hidden gems by network proximity.
- Everyone: it’s just genuinely fun to fly around the data galaxy and explore data.
How I built it (with Kiro)
Almost exclusively built in Kiro.
- Stack:
SvelteKit+Svelte 5,Tailwind v4,Skeleton UI,D3,Three.js(3D). Deployed on Cloudflare Pages/Workers (client-rendered, heavy caching). - Kiro-first workflow
- Specs + Steering: A large
/.kirodirectory with specs for the TopicGalaxy, Leaderboard, and Accessibility (color-blind-safe palettes, ARIA patterns). I keep a customrules.mdsteering file that tells Kiro what to watch for (e.g., “don’t catch-and-hide errors in if blocks”), which dramatically improved code quality. - Hooks (game-changer early on): After any
.svelteedit, a hook reviewed Skeleton dev color pairings, built-in directives, Svelte 5 runes, and Tailwind usage, then auto-fixing inconsistencies where Claude usually gets stuck, was a huge timesaver. - Testing discipline: Kiro reliably generated and ran UI/UX tests and data-handling tests (null safety, edge cases). It repeatedly surfaced ARIA gaps and fixed them in context.
- Vibe → Spec → Code: I started with heavier spec usage, then mixed in faster “vibe requests” once the architecture was stable.
- Specs + Steering: A large
- Impact: I estimate ~100 hours saved vs. building this solo from scratch; the whole project came together in ~30–50 hours thanks to Kiro.
Challenges I ran into
- Data scale vs. edge runtime: CloudFlare CPU limits made SSR expensive, so I disabled SSR, pushed rendering client-side, and leaned on aggressive caching.
- Graph size & meaning: The recommendation network was originally ~30k edges; after cleaning and trimming non-active/low-signal nodes, I settled at ~12k nodes / 17k edges for both data quality and frame-rate.
- Perf & usability: Level-of-detail (LOD) rendering, debounced search/filters, virtualized lists, and canvas-based drawing keep interactions smooth.
Accomplishments I am proud of
- Scale: ~50k posts, several thousand newsletters, hundreds of thousands of comments analyzed.
- UX: Keyboard navigation, ARIA labeling, and accessible color choices were accounted for. Many via Kiro’s auto-fix and check UX tasks.
- Discoveries (from my dataset):
- Mini-clusters: some newsletters recommend niche sets that nobody else does.
- Feature insights: images and reader questions correlate with higher engagement; technical/data posts draw the most comments.
- Numbers and exclamation marks in the titles correlate with lower engagement (numbers ≈–50% in my models).
What I learned
- Spec-driven dev with Kiro: writing good specs and a strong steering file compounds; hooks catch stylistic/library issues instantly; letting tests drive fixes leads to a consistently accessible UI.
- Big-data perf on the web: How to balance pre-computation, LOD, and client rendering for fluid graph exploration.
What’s next
- Engagement prediction API: I’ve trained predictors/inference models; I’ll expose endpoints so writers can estimate engagement before publishing.
- Richer topic exemplars: More sample posts per topic; deeper cross-topic trends.
- Insights for action: Collaboration suggestions (“who to partner with next?”), cohort growth curves, posting-time recommendations, and alerts.
Methods & formulas (selected)
Let $RR$ = reactions, $CC$ = comments, $SS$ = restacks, and $N_\text{subs}$ = subscribers.
Engagement (per 1k subscribers)
$$ER_{1k}=\frac{R+\;w_c\,C+\;w_s\,S}{N_\text{subs}}\times 1000,\quad \text{with } w_c, w_s > 1 \text{ to reflect higher effort.}$$
Network basics
Degree $k_i=\sum_j A_{ij}$; PageRank $PR$ with damping $d\in(0,1)$. I use degree/PageRank for salience, plus edge-weighted LOD for rendering.
Temporal patterns
I test hourly/day-of-week effects and title-feature impacts via feature importance (tree models) and statistical tests (normalized by $N_\text{subs}$).
Data notes
Data were cleaned/deduped, and non-active nodes pruned for clarity/performance. I report correlations/associations from this dataset—not universal causal claims.
Built With
- cloudflare
- html5
- svelte
- sveltekit
- tailwind
- typescript


Log in or sign up for Devpost to join the conversation.