-
-
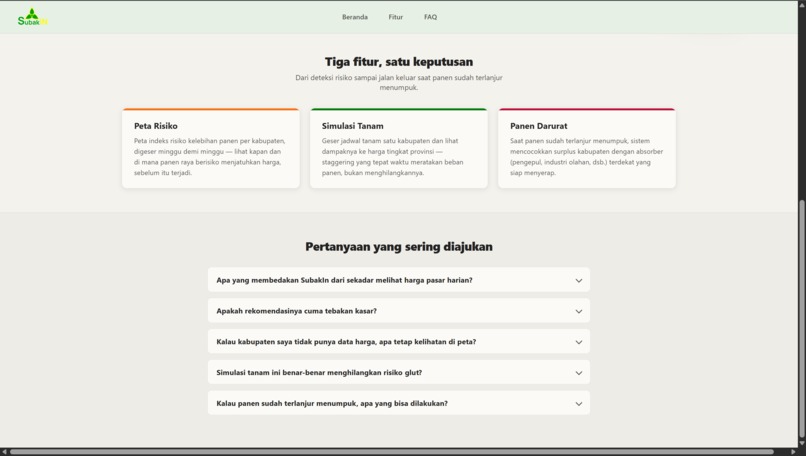
Landing Page 2
-
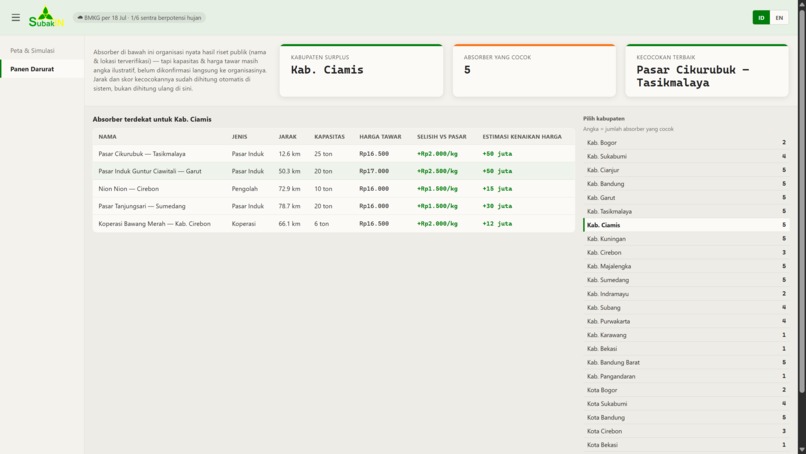
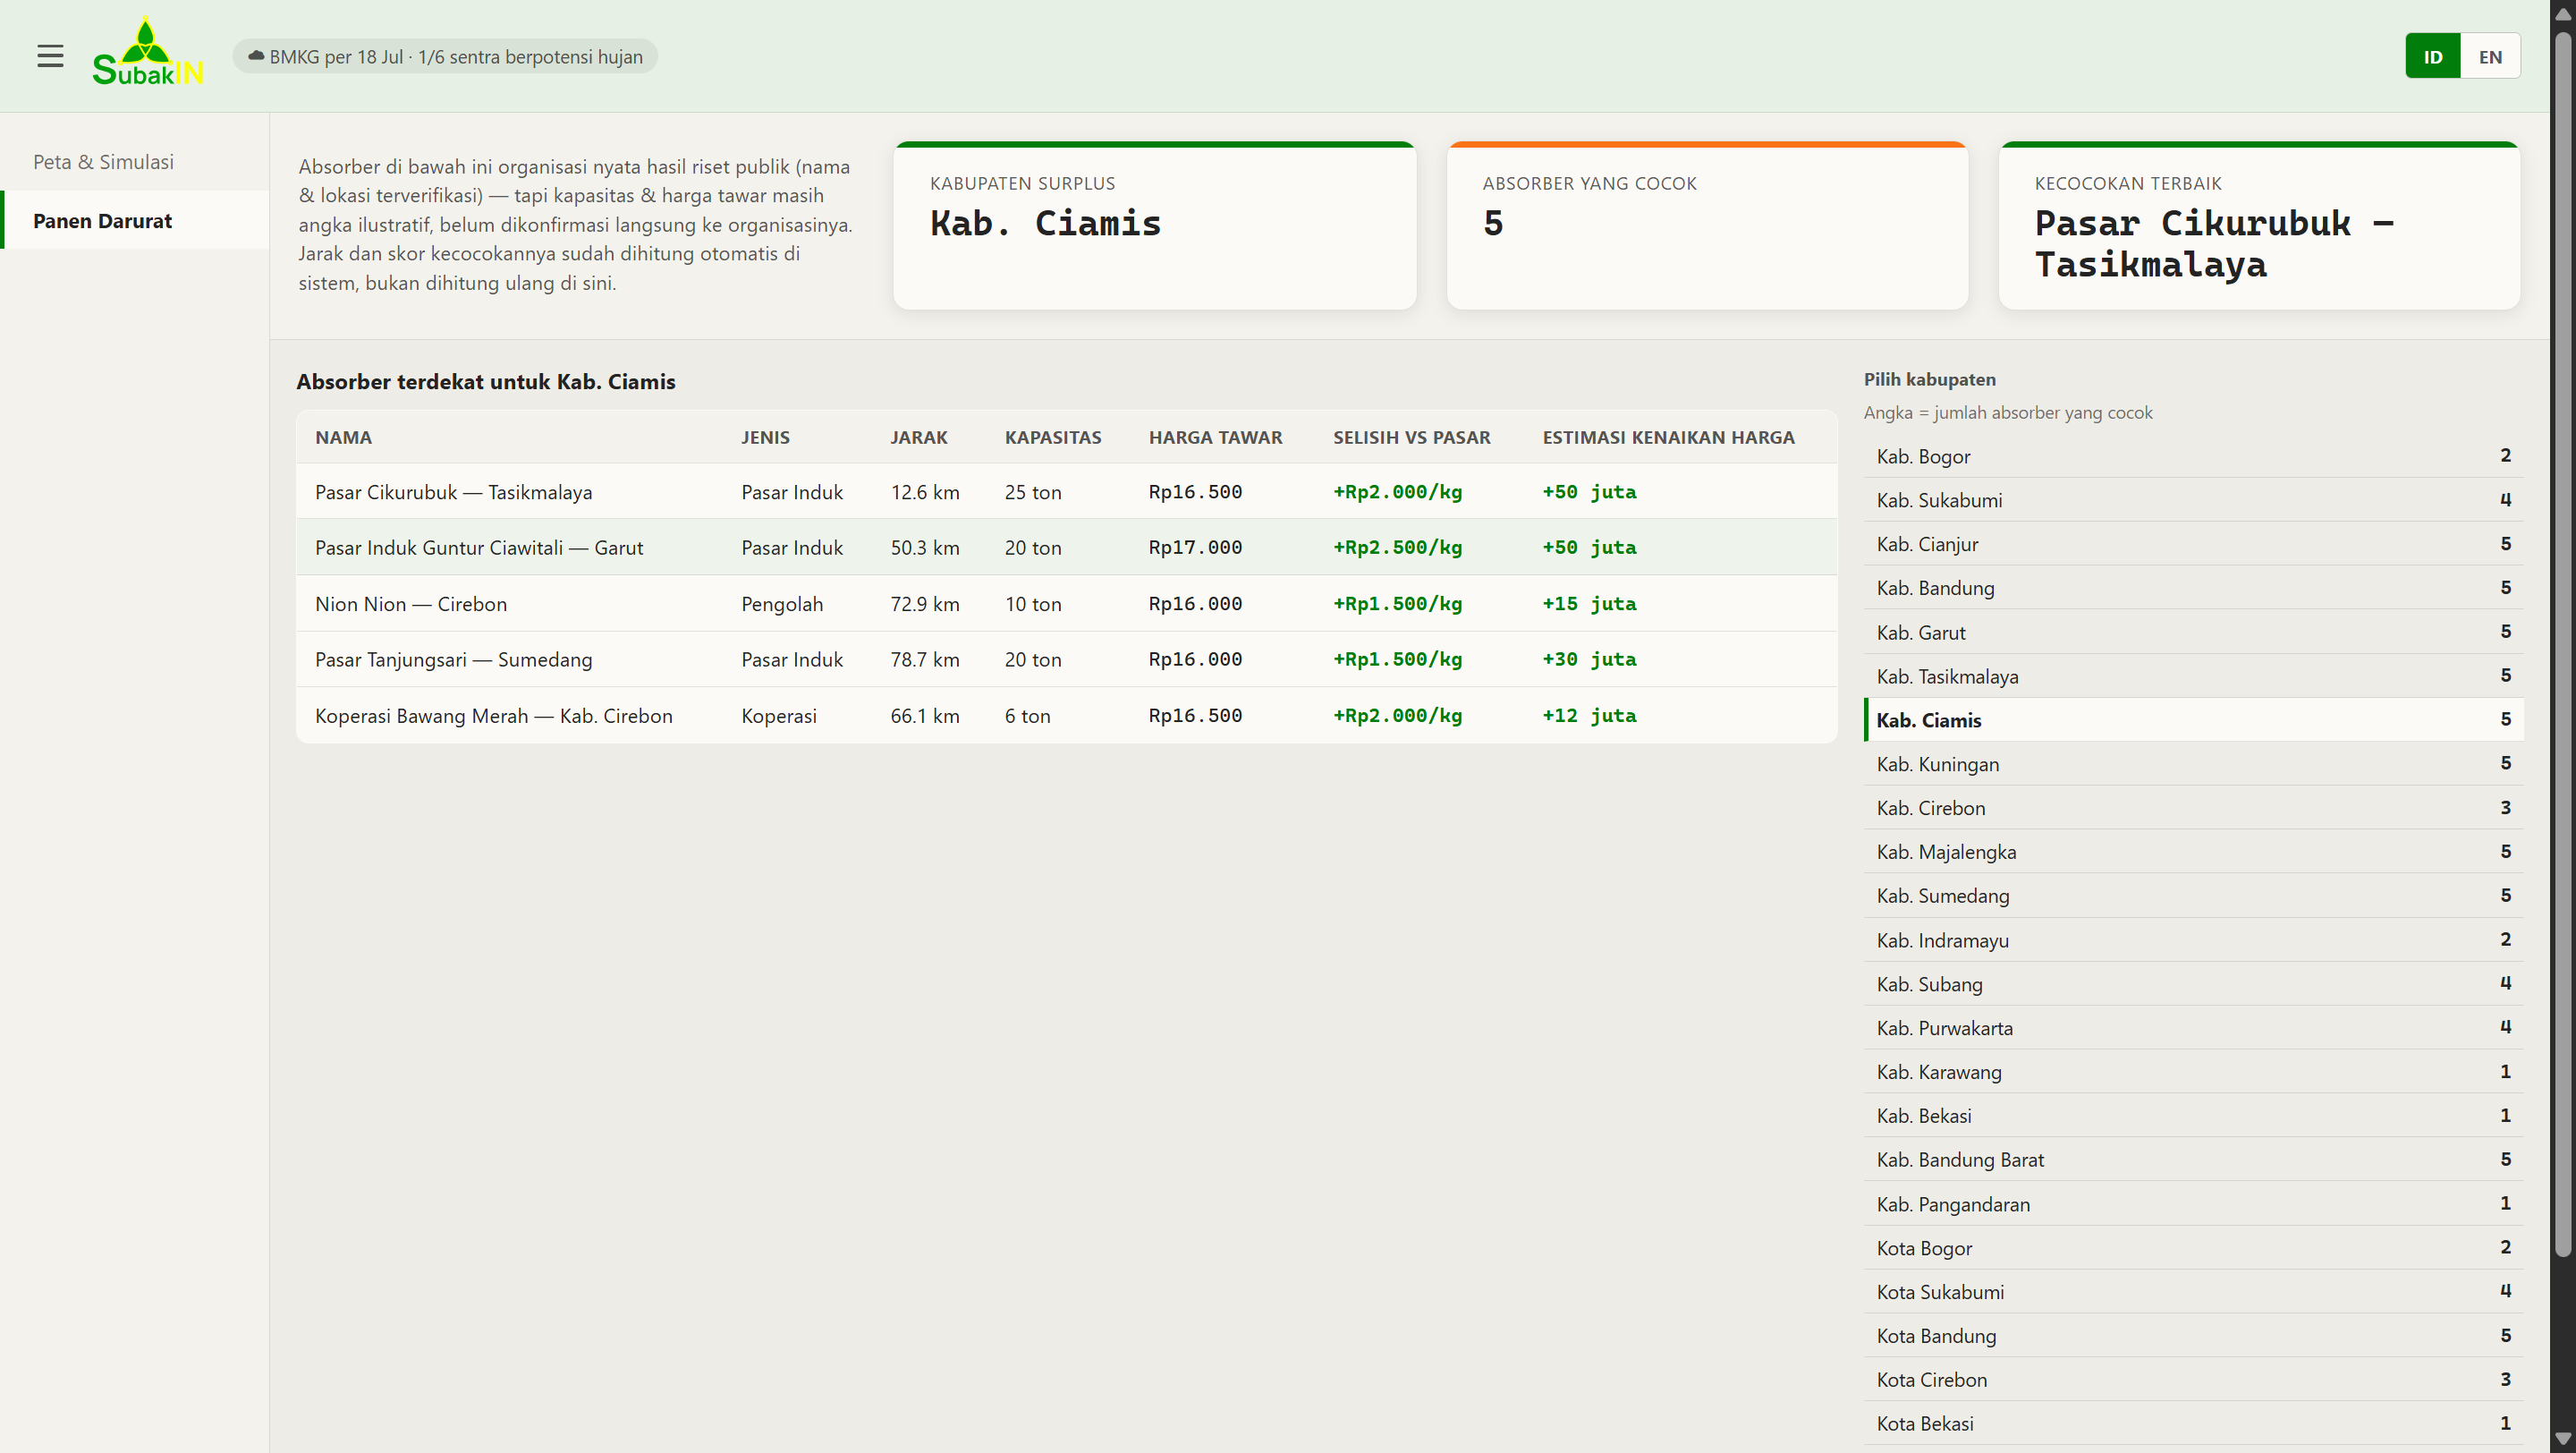
Emergency Harvest : as a mitigation/fallback of system for distributing the glut
-
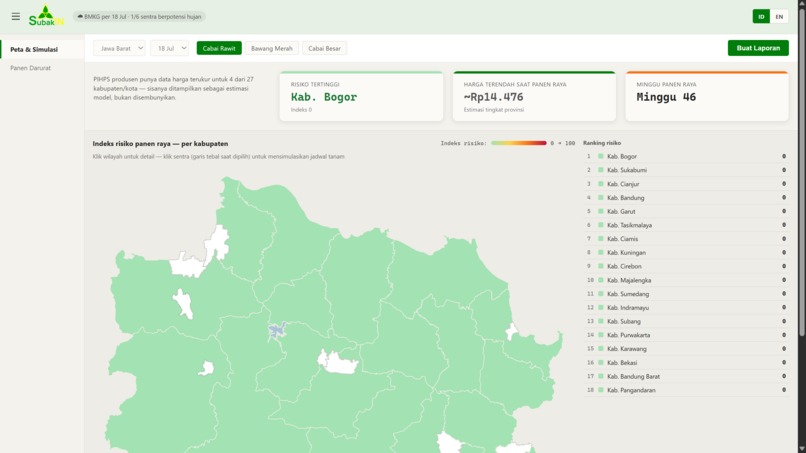
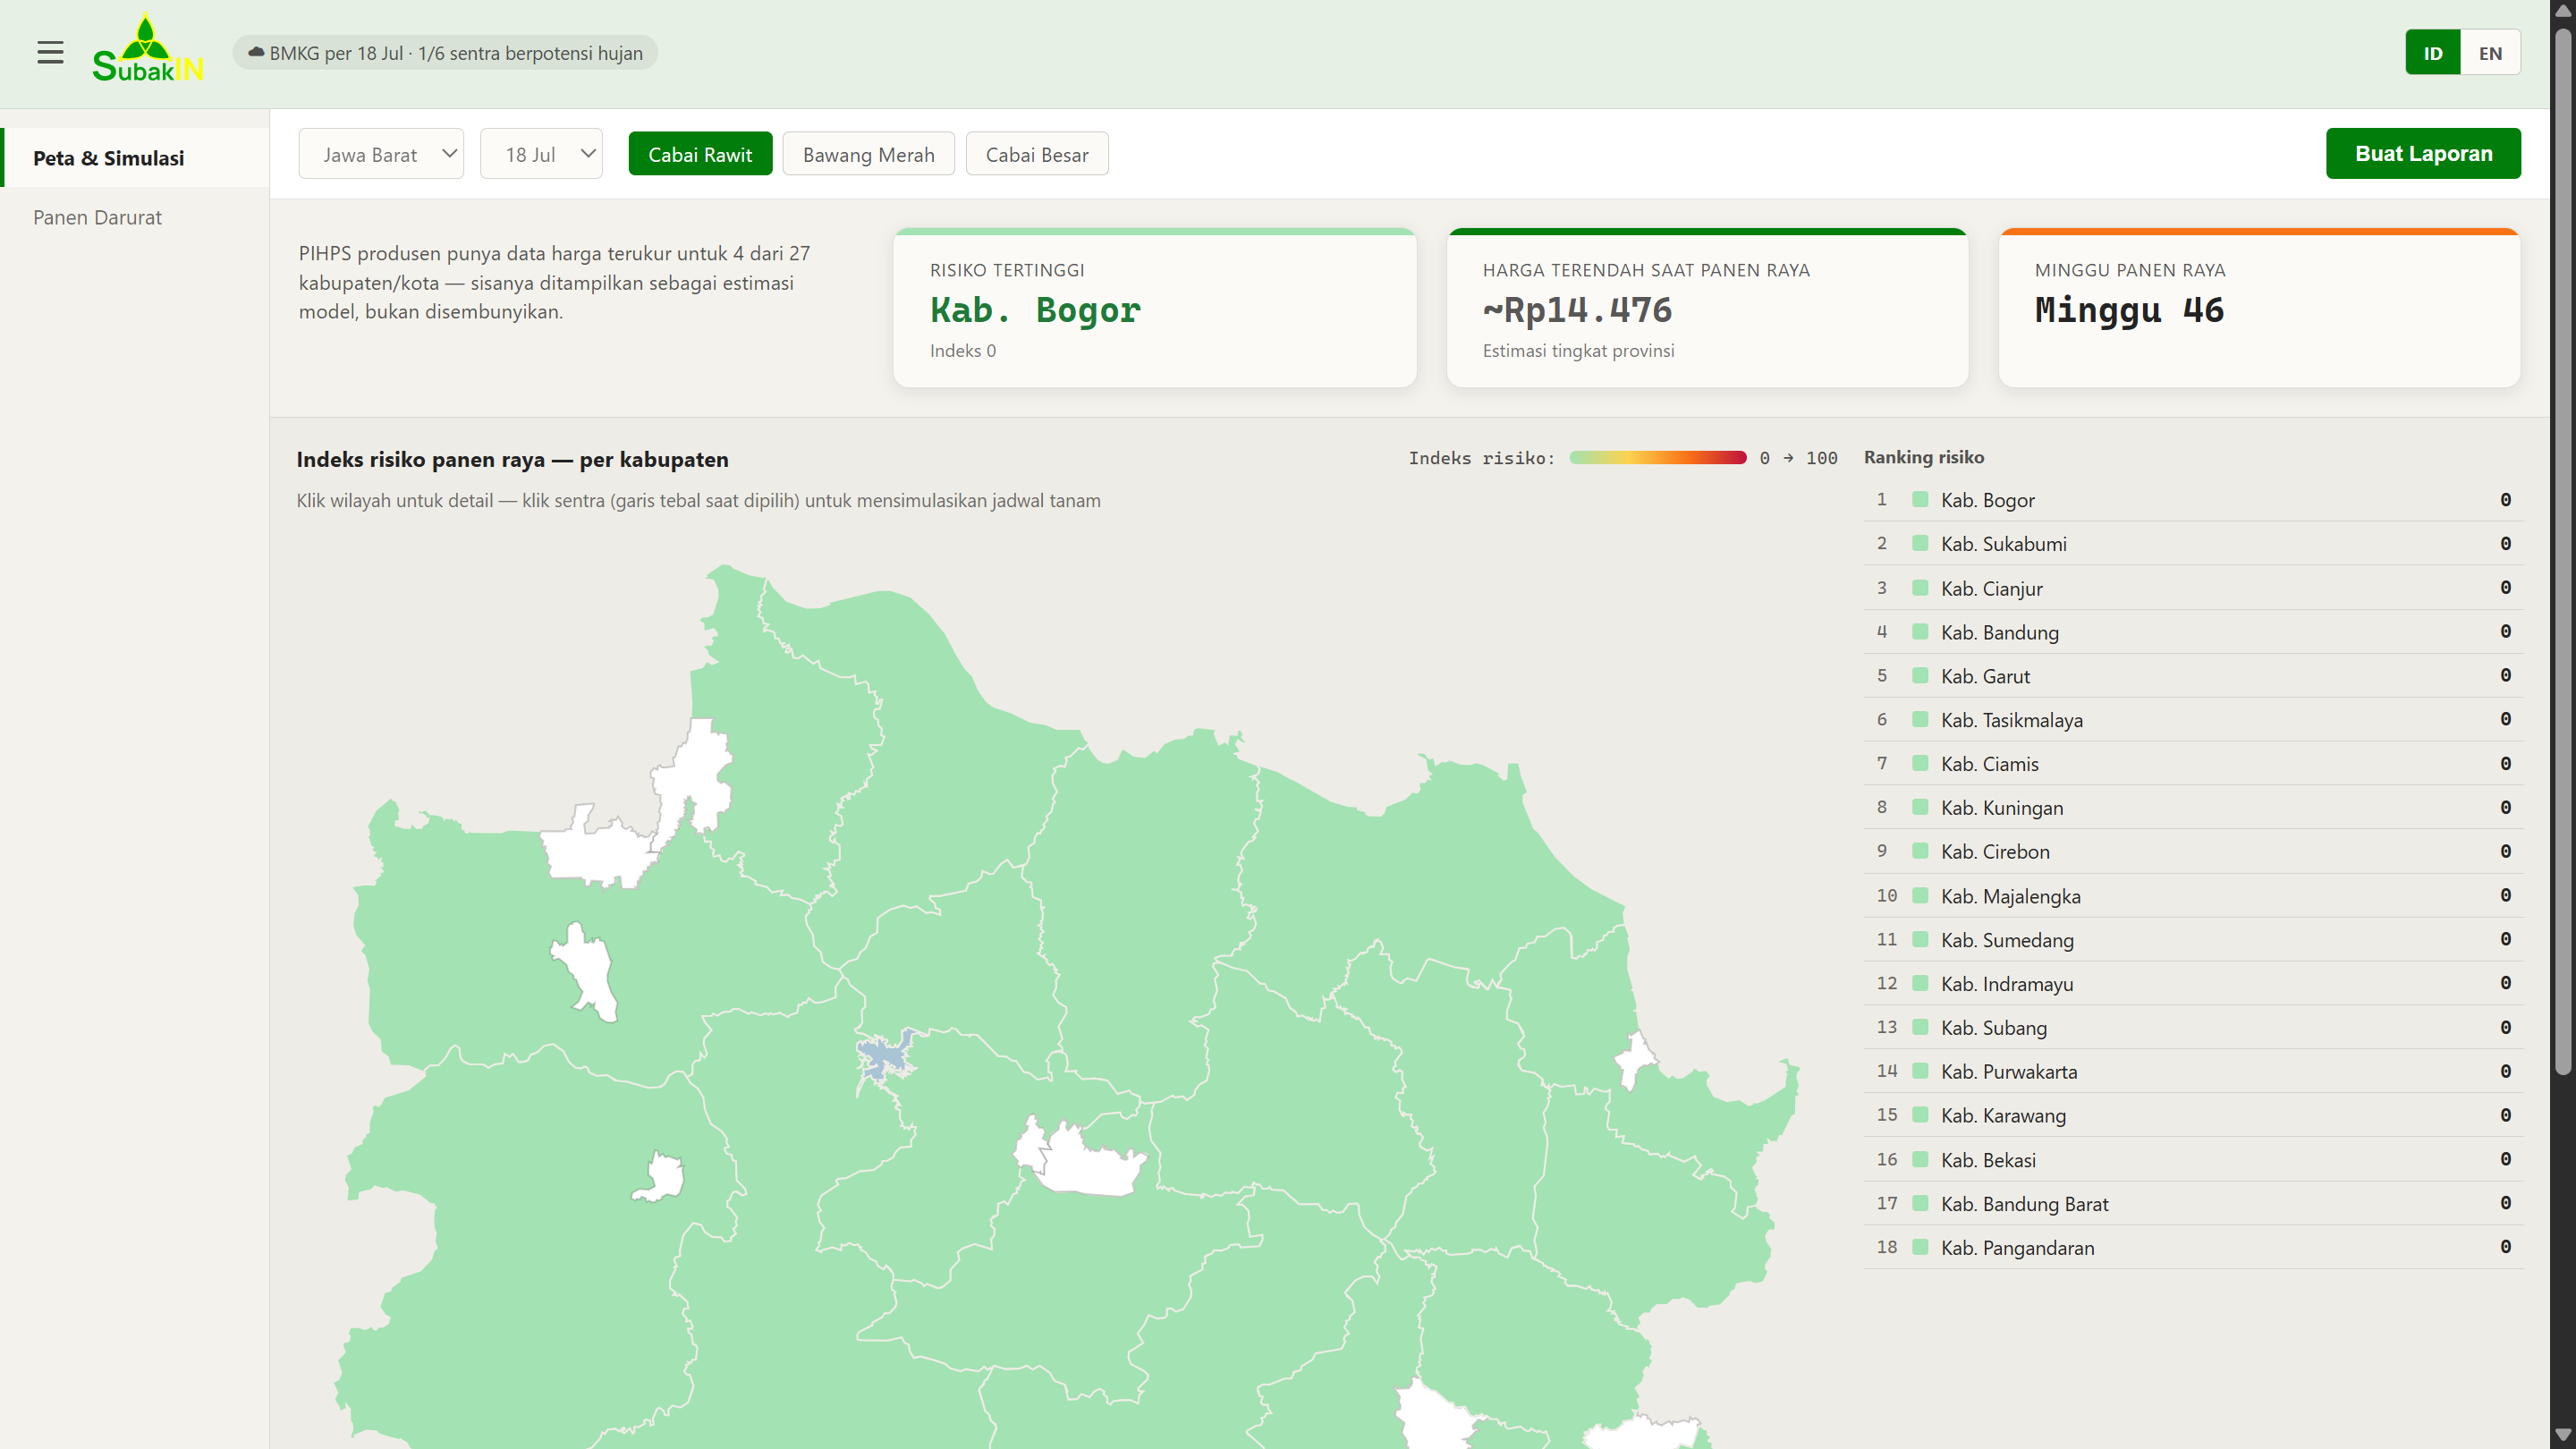
Risk Map : Map that show glut index risk
-
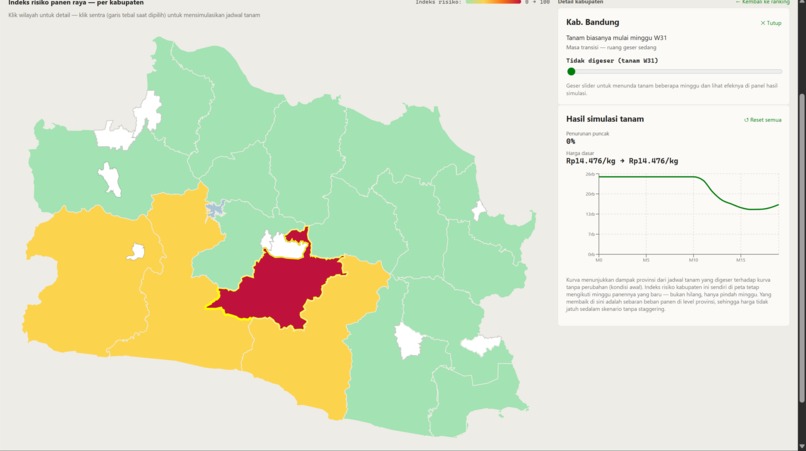
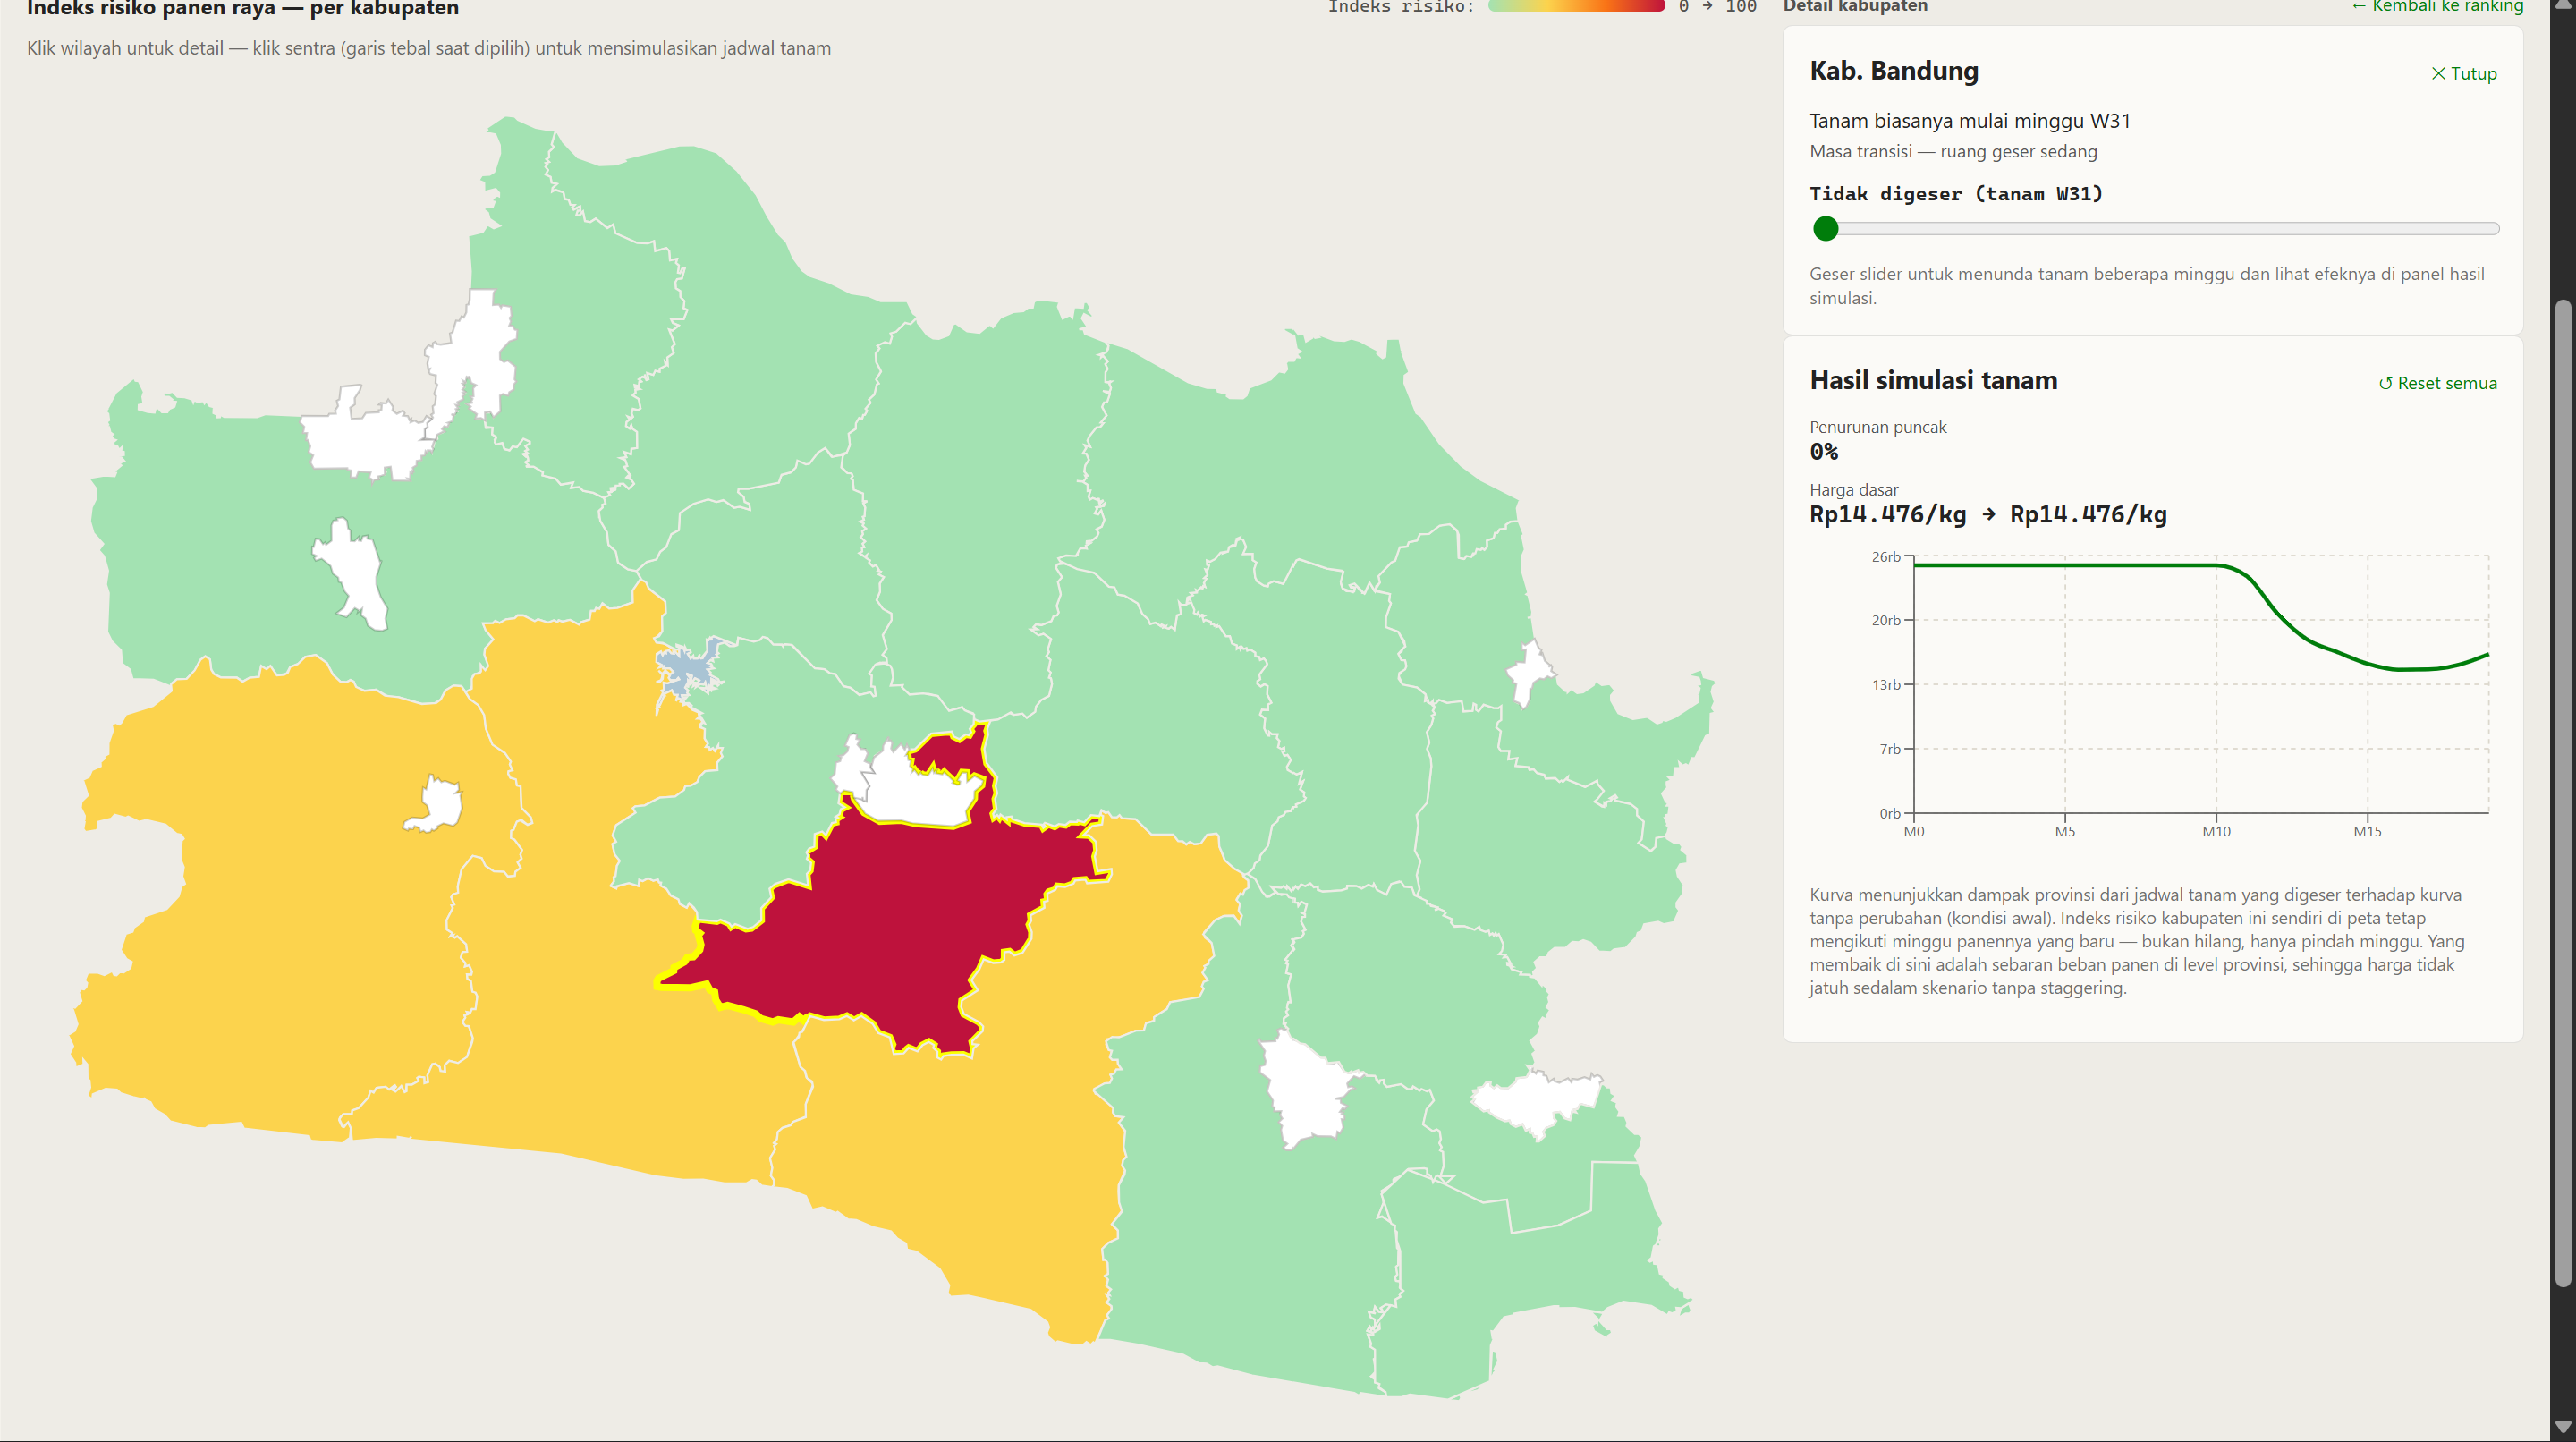
Planting Simulation : Simulating a planting simulation on goverment's data
-
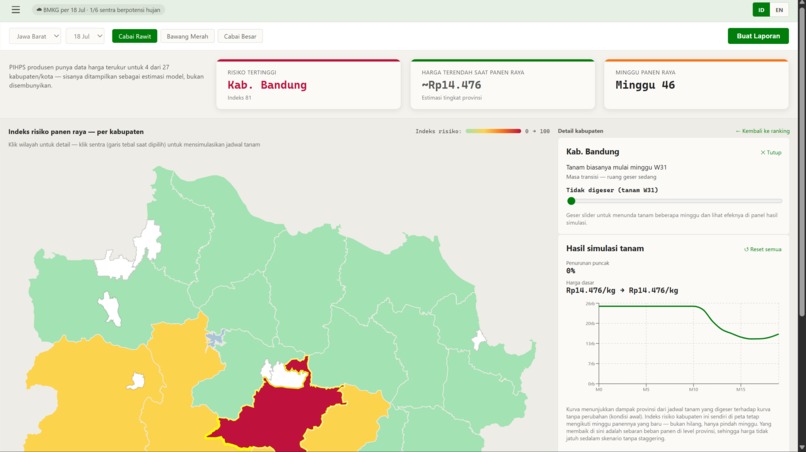
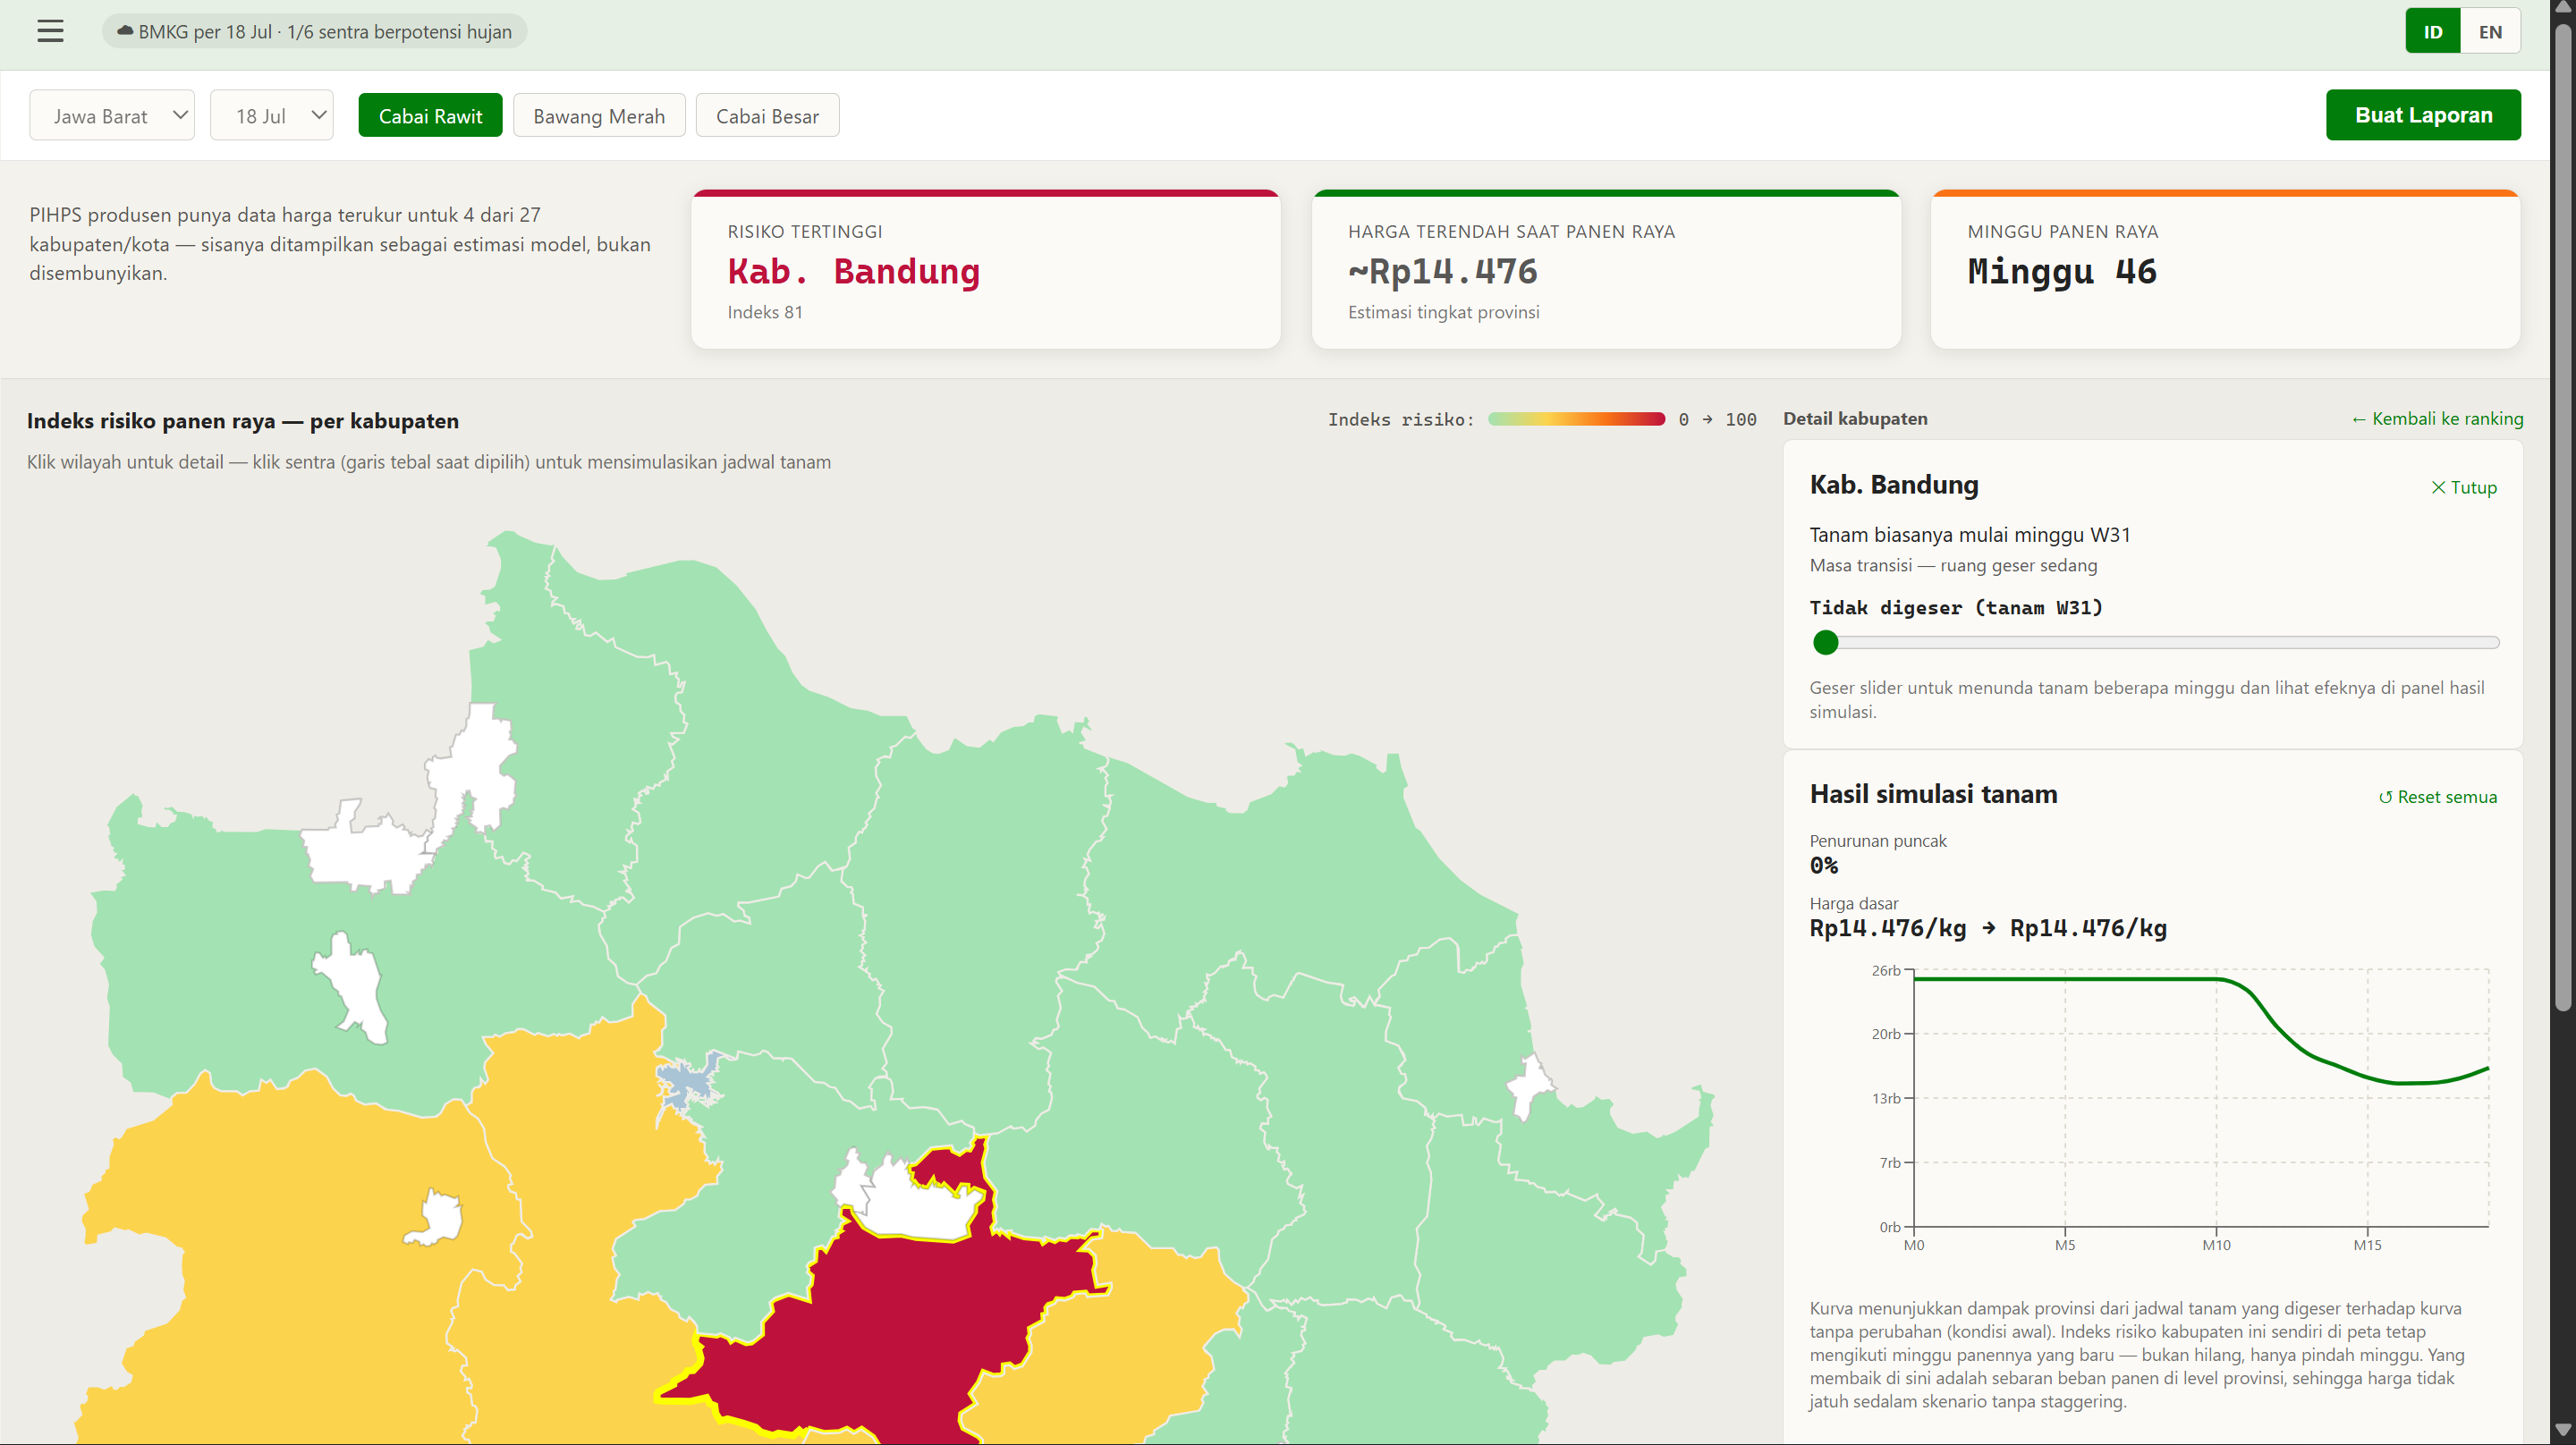
Planting Simulation (2)
-
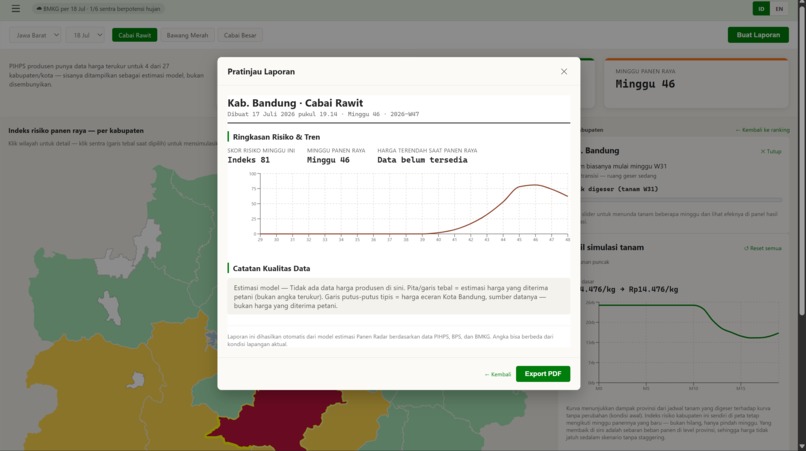
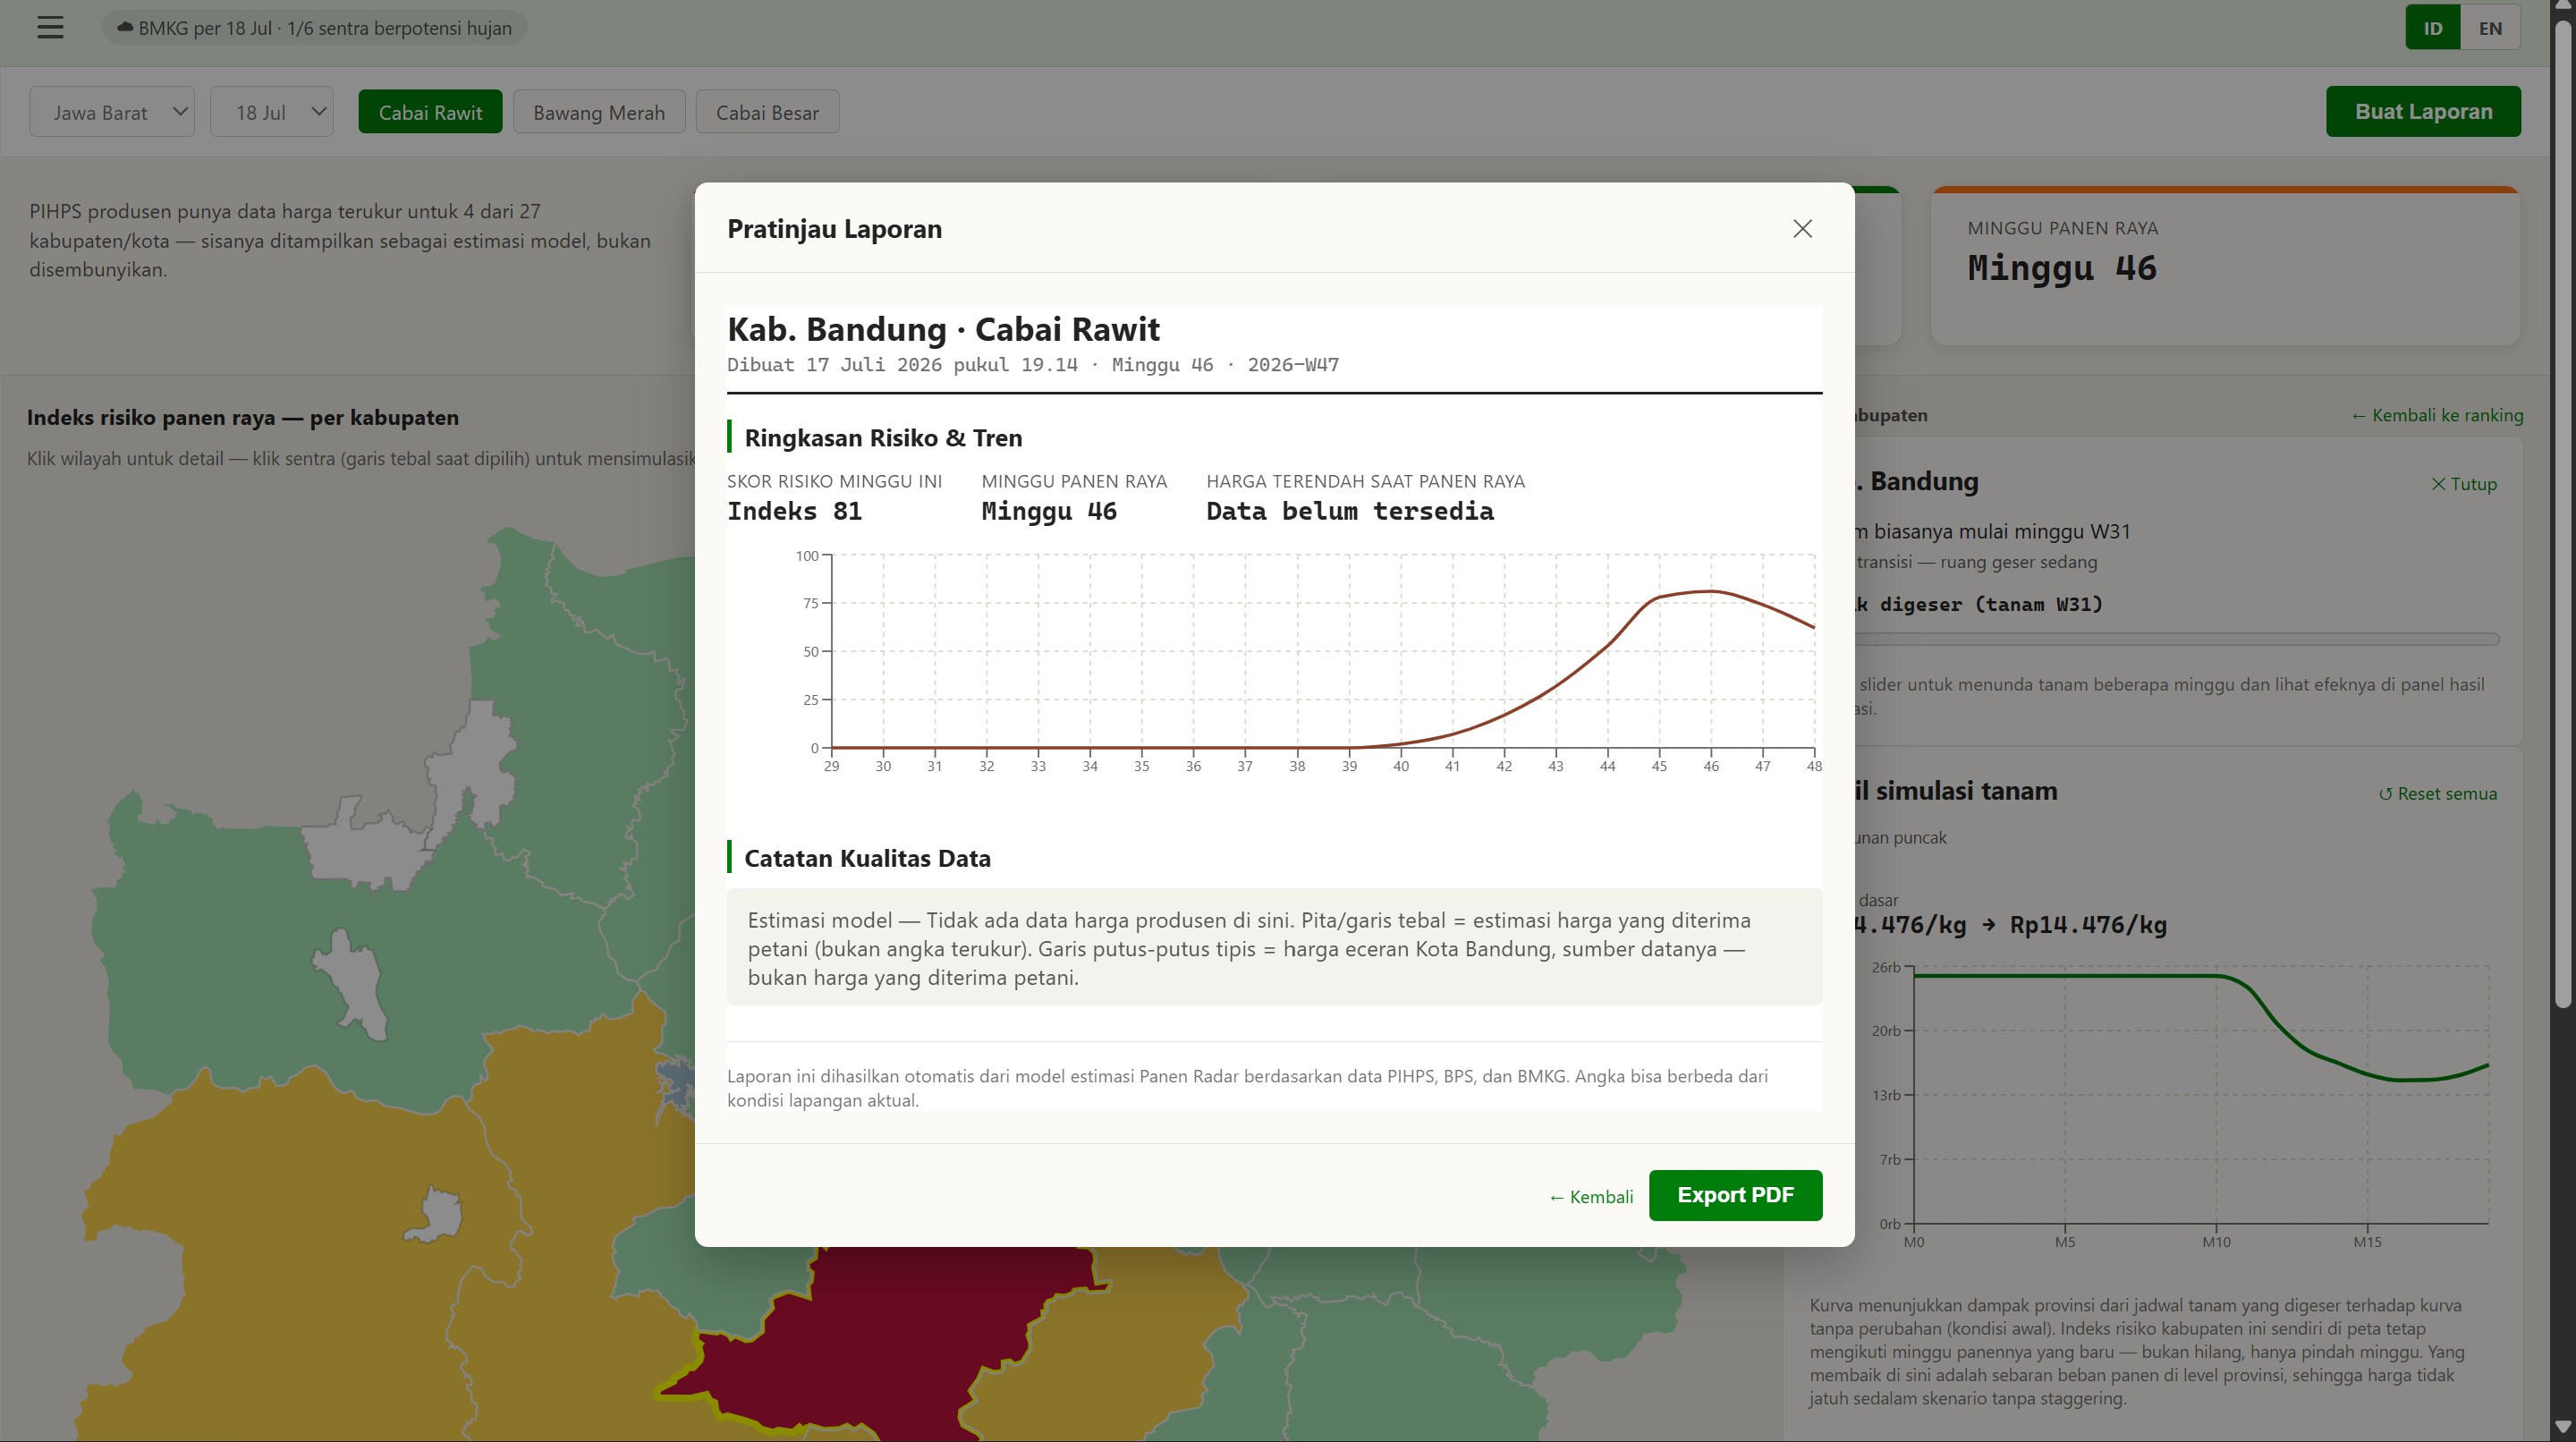
Buletin Report
-
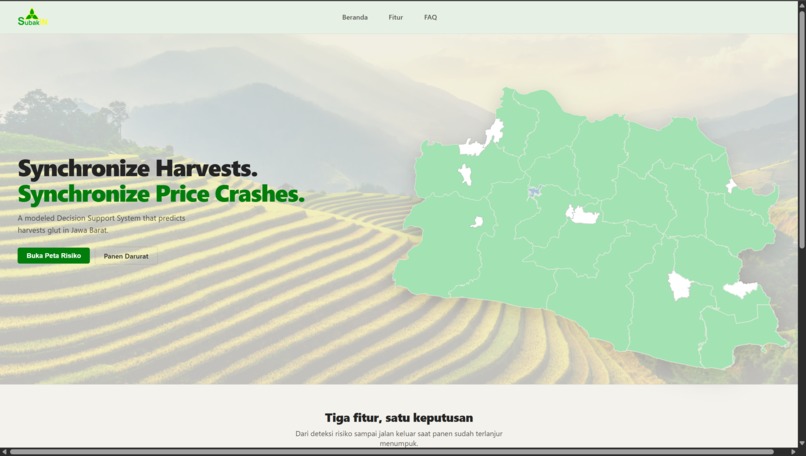
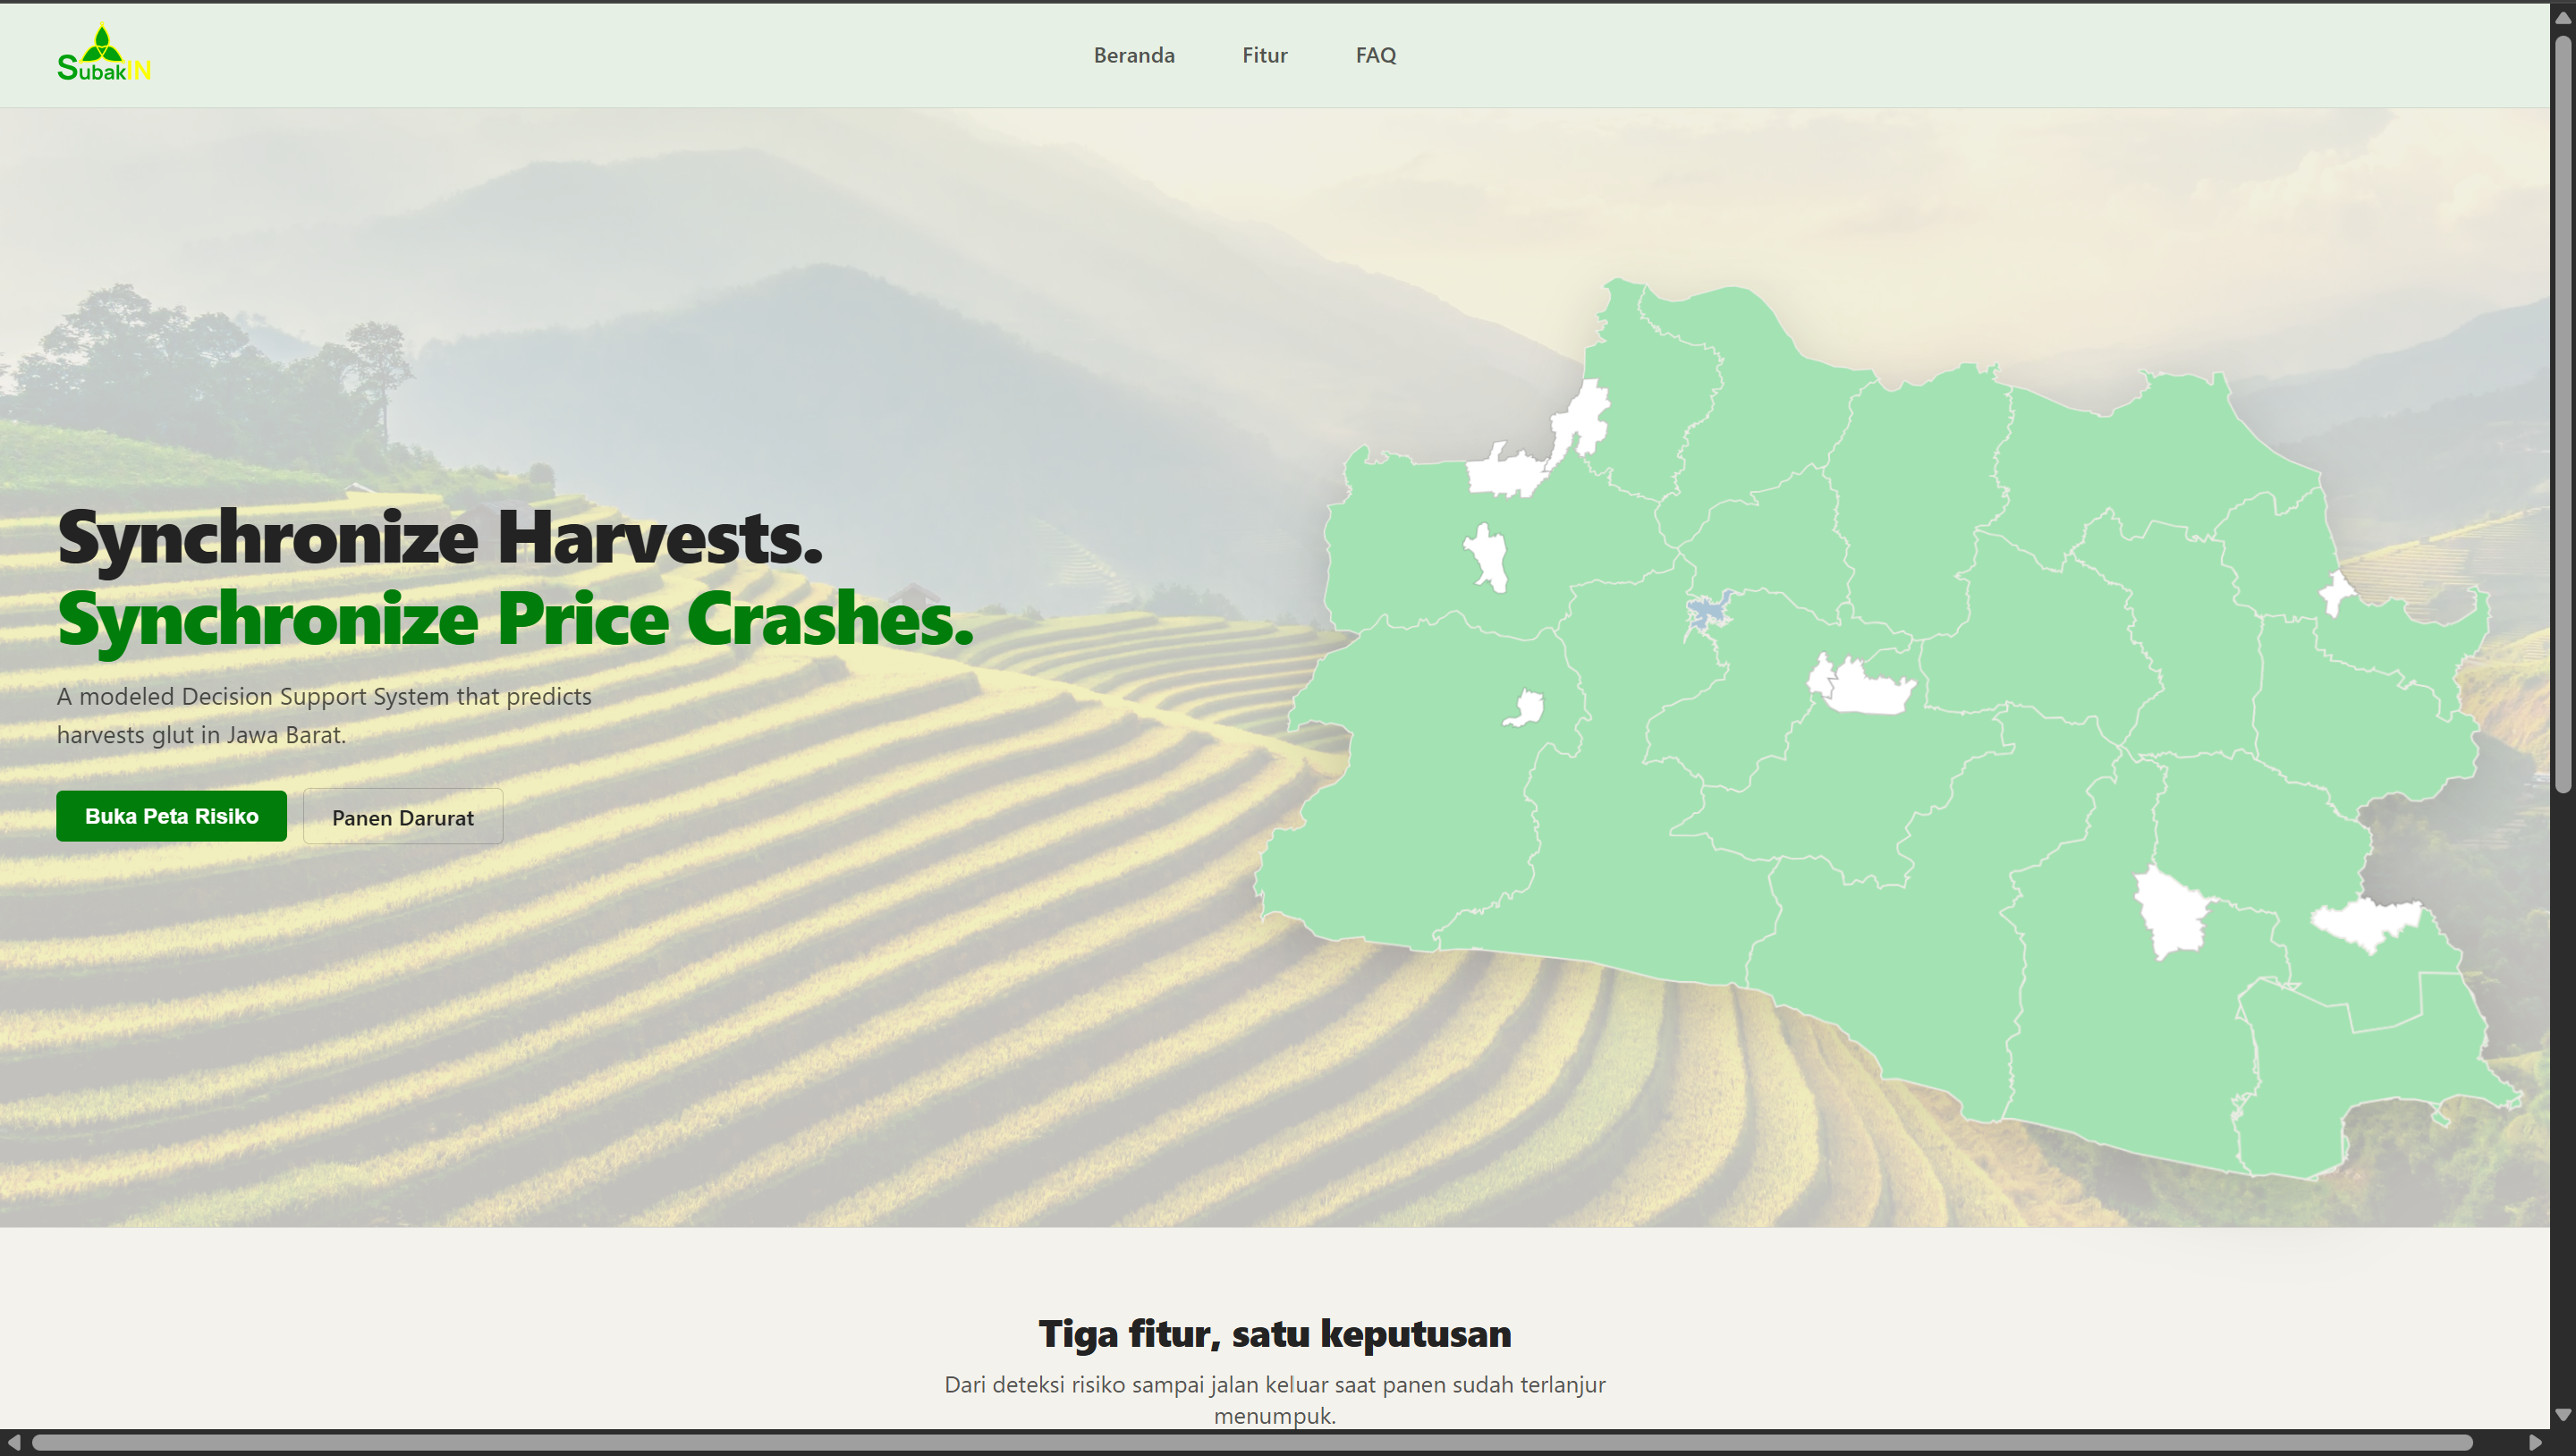
Landing Page
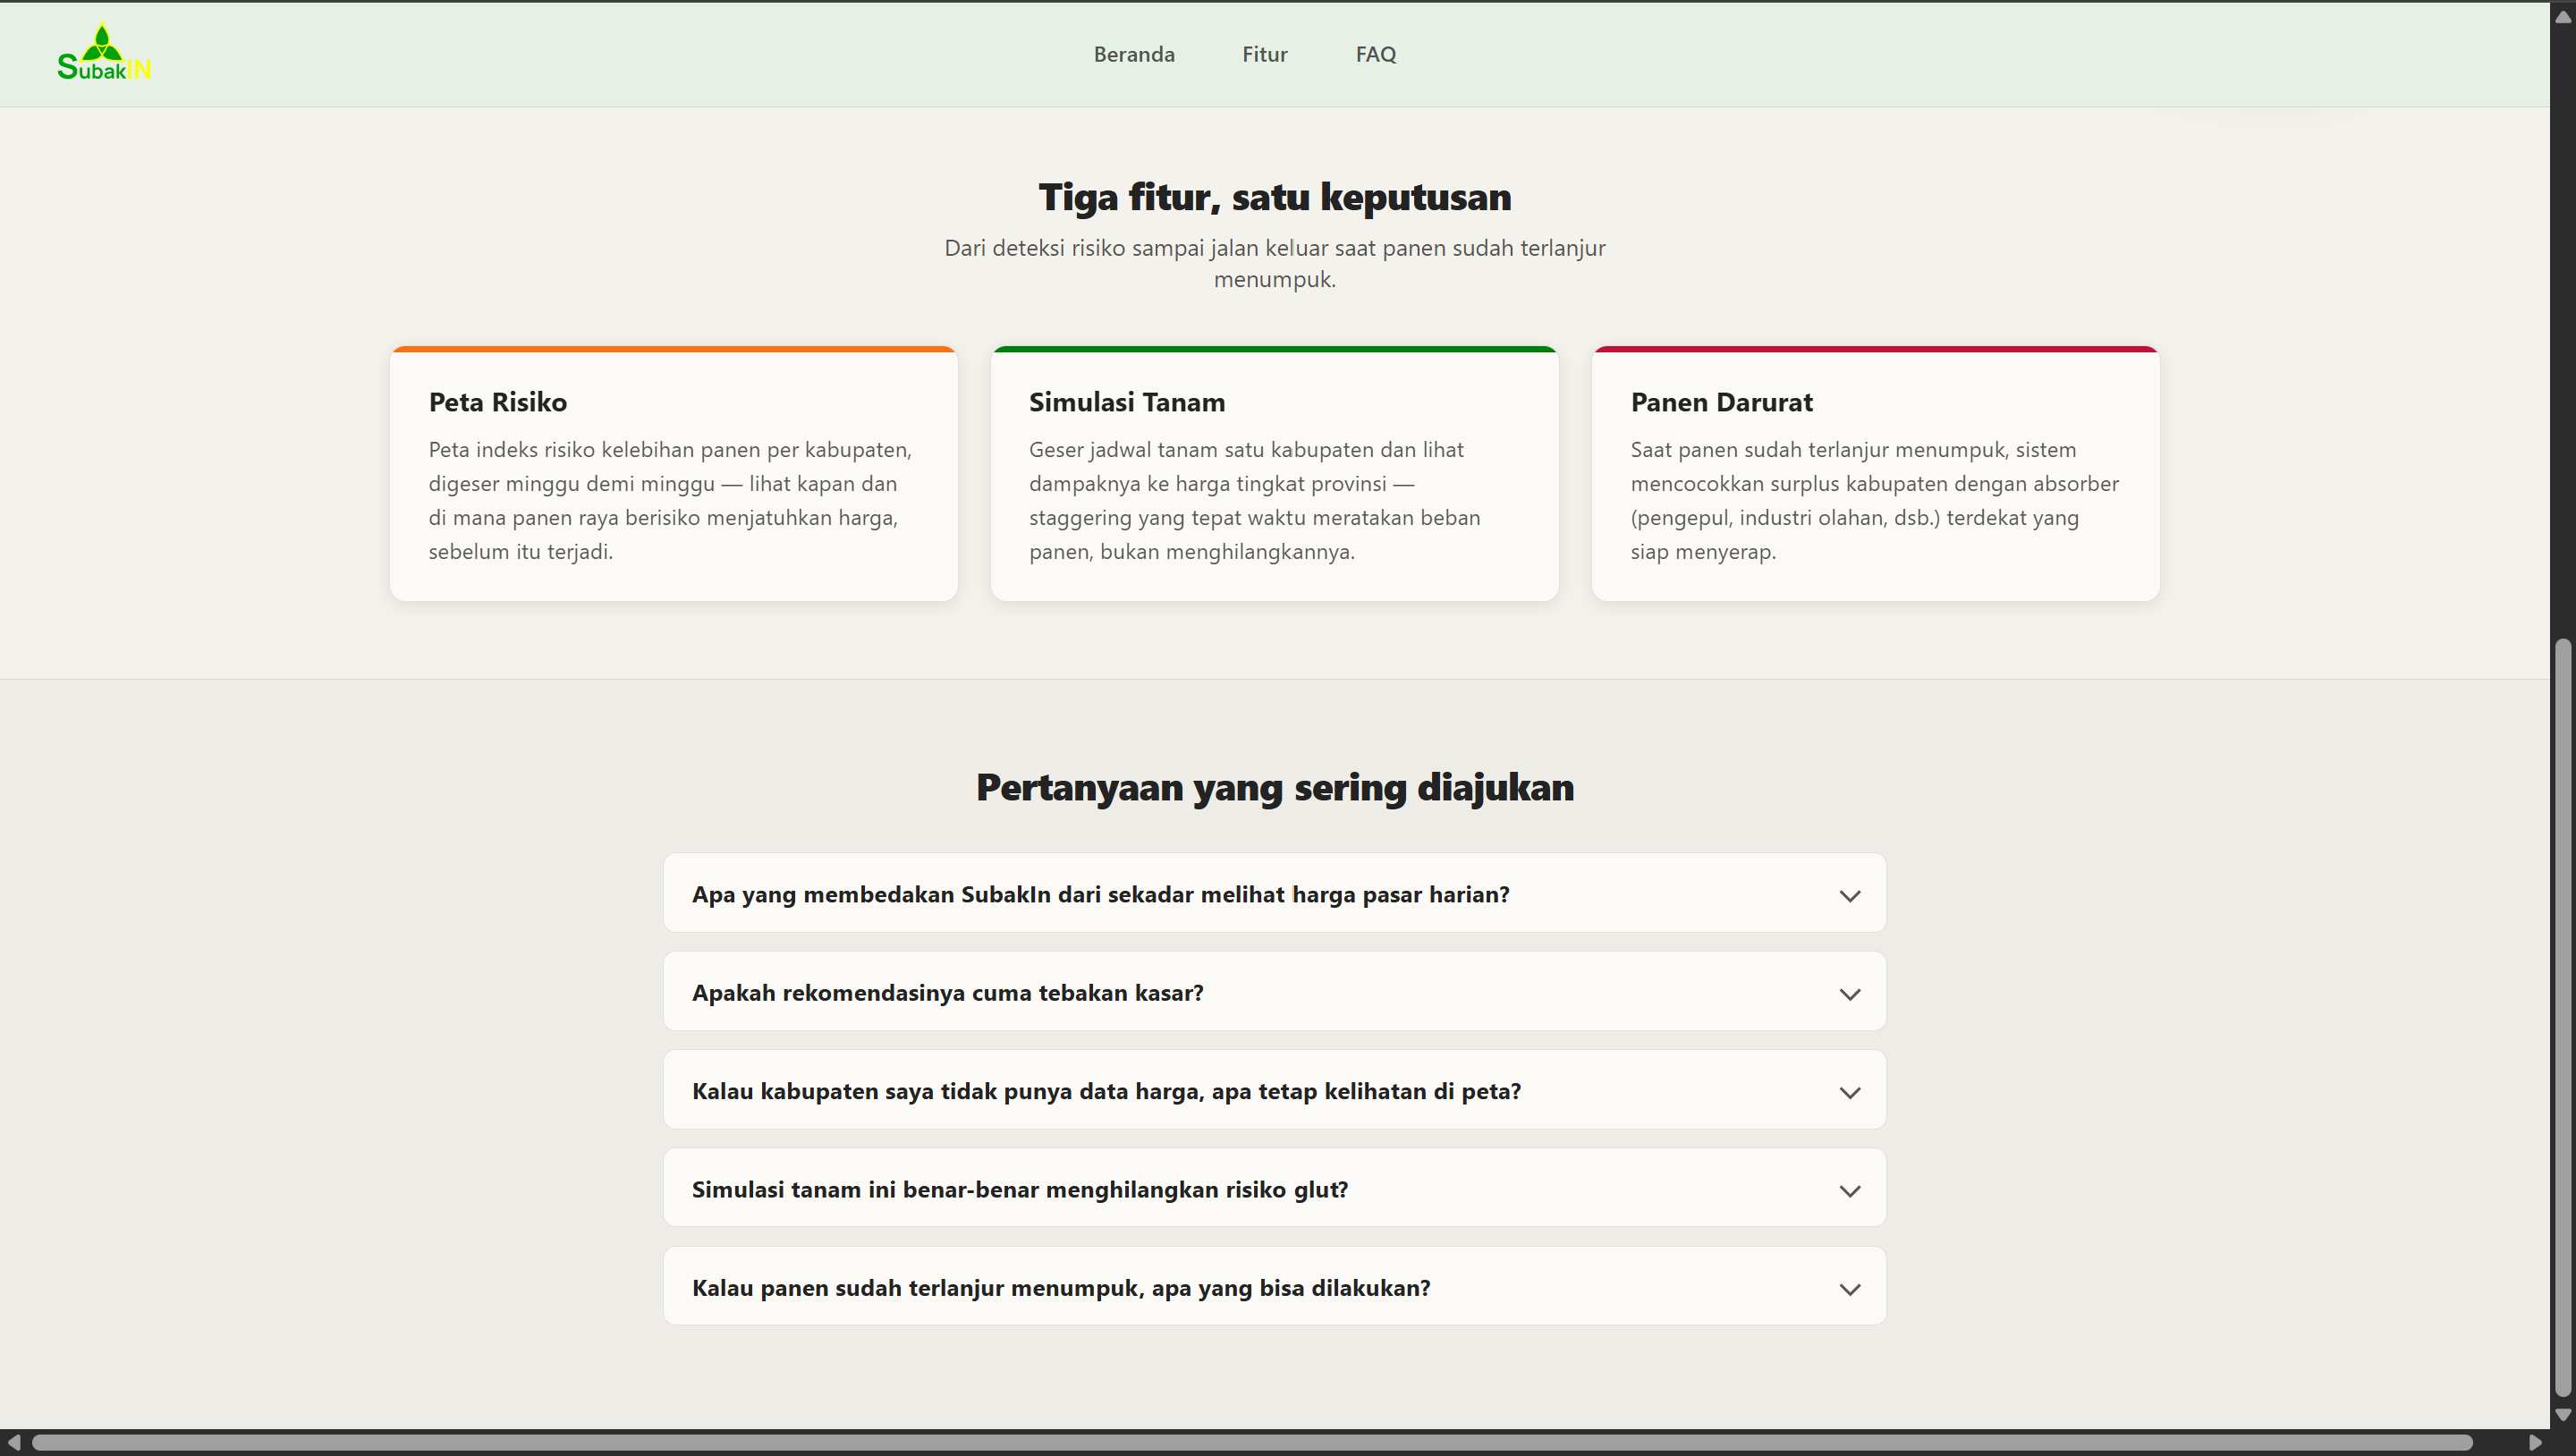
Inspiration
Bali has a centuries old irrigation system called Subak, a temple based network that rotates water turns between rice terraces so harvests never pile up at the same time. It has survived hundreds of years of real world use and is still running today, proving that simple coordination can prevent exactly the kind of chaos Indonesian horticulture faces now: every year, farmers throw away their own harvest not because it failed, but because it succeeded too well, all at once. We saw the news: tomatoes in Malang dumped into a ravine as prices crashed from Rp4,000 to Rp600/kg, chilies in Kapuas thrown out on the roadside because their price fell below the cost of picking them. Thousands of farmers grow the same commodity in the same window, with zero visibility into what their neighbors are planting, so when harvests collide, supply floods and prices crash below break even.
As IPB students, we saw this as a coordination problem, not a production one, so we didn't want to build another farmer facing app. Indonesia already has a graveyard of agricultural apps abandoned within months, because farmers (average age ~55) rarely have the digital literacy or trust to adopt yet another app. Instead, we brought Subak's coordination principle into the digital age for the people farmers already trust: penyuluh (agricultural extension workers) and the Dinas Pertanian above them, the existing distribution layer that just needed a coordination signal. That's how SubakIn was born.
What it does
SubakIn is a decision support system for the Department of Agriculture (Dinas Pertanian) that predicts harvest glut for horticulture commodities in West Java, 2 to 3 months before it happens: early enough to actually be prevented.
Three things the system does:
1. Risk Map Maps all 27 regencies/cities in West Java by a Harvest Glut Risk Index, combined with price forecasts backtested against 8 years of real producer price data. MAPE (forecast error) is shown as measured: it varies by region and commodity, roughly 18% to 46%, averaging around 26%, not a single flattering number. The map also explicitly distinguishes regions with measured data from regions with modeled estimates, because honesty about what we know and don't know is part of the product, not just a disclaimer.
2. Planting Simulation An interactive simulator that shows: if planting schedules are staggered by 2 to 4 weeks across regencies (not changing what's grown, just when), the supply peak can drop significantly and the floor price recovers above production cost. This is the argument, visualized: visual proof that the problem is timing, not total production volume.
3. Decision Report A one page summary of the current risk situation and simulation results, ready to send to agricultural extension networks. It works alongside a separate Emergency Harvest feature, which matches a regency's surplus with the nearest ready buyers (traders, processors, and other absorbers) once a glut has already happened. SubakIn is deliberately not a farmer marketplace, not a plant disease chatbot, and not a replacement for existing government policy (like Bapanas's food distribution facilitation). It's a predictive intelligence layer nobody has built yet: giving decision makers a three month head start, before the price crashes, not after.
How we built it
Data
We built every model on real government data we pulled and verified ourselves, not assumptions.
- PIHPS (Bank Indonesia): daily farm gate producer prices since 2018, pulled through the GetGridDataKomoditas endpoint, which gives a per regency breakdown.
- BPS WebAPI: annual production and harvested area data for all 27 regencies/cities in West Java, pulled via the raw REST API after the official package (stadata) failed to install.
- BMKG: official weather forecasts via API, plus planting season onset data, which turned out to only exist as a several hundred page official PDF bulletin (no API, no HTML table). We extracted it manually from seasonal zone prefix codes (JABAR_01 through JABAR_41) after multiple rounds of investigation.
Methodology
STL decomposition for seasonality, feeding a Holt Winters/SARIMA price forecast validated with rolling origin backtesting. A planting cohort × harvest kernel convolution model detects when harvest timing piles up across regencies. These feed a composite Glut Risk Index, calibrated to light up right at the price crash points that actually happened historically.
Architecture
We deliberately chose a backend server free architecture for the demo. Python computes every model and exports it as static JSON files; React reads those files and runs lightweight simulation (staggering, convolution) directly in the browser. This is a JAMstack pattern with scheduled static regeneration: the right fit for data that's naturally slow changing (daily prices, annual production, seasons that shift over months), and it also makes our demo fully resistant to connectivity failures on stage.
Challenges we ran into
Inconsistent Government Data Government data was never designed to talk to each other. PIHPS, BPS, and BMKG each use different regional coding systems: PIHPS uses its own internal IDs, BPS uses a Kemendagri independent coding scheme, and BMKG uses Kepmendagri's adm4 codes plus its own seasonal zone codes. Joining these datasets without an explicit alias table nearly caused us to mismatch regencies over trivial issues like trailing whitespace and ambiguity between "Kota" (city) and "Kab." (regency) prefixes.
Data Availability and Accessibility KATAM, the official government planting calendar, was completely inaccessible throughout our entire development period; every domain alias was down. We had to rebuild our entire planting window mechanism from a BMKG proxy dataset instead, which itself wasn't an API or a clean table but a several hundred page PDF whose data appendix was indexed by zone codes, not province names. Our first search failed outright because we searched for "Jawa Barat" instead of the code "JABAR_XX".
A Blind Spot in Monitoring Infrastructure We discovered that government price monitoring infrastructure is effectively blind in its own production centers. Cross checking against BPS data, we found that Kabupaten Bandung is the province's #1 shallot producer (~44% of provincial output), yet it has zero coverage in PIHPS's farm gate price data. In fact, 21 of West Java's 27 regencies/cities have no farm gate price data at all, for any commodity. At first this felt like a failure on our part to collect the right data. It turned out to be a structural feature of PIHPS itself, designed to monitor consumer city price stability, not production centers, and it ended up becoming the strongest piece of evidence for our product's core thesis.
Avoiding the Self-Defeating Recommendation Trap We initially designed SubakIn as a recommendation engine ("plant commodity X, not Y") before realizing it fell into a classic cobweb theorem trap: a uniform recommendation, followed by many farmers at once, cancels itself out. We redesigned it into a state display coordination signal instead, with timing staggering as the primary lever rather than commodity switching.
Balancing Feature Ambition with Demo Reliability We originally scoped six separate screens before realizing that was too risky for a three person team with 30 hours on the clock. We cut it down to two core interactive screens plus one synthesis document (the Decision Brief), so that everything we showed on stage would be rock solid.
Accomplishments that we're proud of
Data Integrity Every model stands on real government data we pulled and verified ourselves: not synthetic data, not assumptions. Our price forecasts are backtested against eight years of historical data, with the error metric (MAPE) shown openly rather than hidden.
Turning a Limitation into a Strength We turned a data limitation into a product argument. Instead of hiding regions with incomplete data, we built a system that explicitly distinguishes measured data from modeled data, and made that gap itself part of the case for why the product is needed.
Iterative Correction We found and corrected our own mistaken assumptions mid build, including an incorrect ranking of shallot (bawang merah) production centers from an outdated source, and a misalignment between our understanding of data granularity and our feature design, catching both before we built further on the wrong foundation.
A Defensible Position We proactively mapped our product against existing government policy (HAP, FDP, the Champion system, KATAM) and our closest competitor (Dipanen), so we could answer "doesn't this already exist?" with a rehearsed answer, not improvisation on stage.
What we learned
We learned that Indonesian government data is far richer than it looks, but almost never designed to connect: every institution has its own region code system, and some critical data (like the KATAM planting calendar) can be completely inaccessible without warning. Verifying against real data responses instead of guessing at schemas became a discipline we kept returning to throughout the project.
We also learned that recommendations that look sensible individually can fail collectively, a lesson from the cobweb theorem that reshaped our entire product architecture, from a "recommendation engine" into a "coordination signal." And we learned that honesty about data limitations, if designed for deliberately, can become a product strength instead of a weakness to hide.
Finally, we learned that a problem that looks like it needs new technology, coordinating planting timing to prevent harvests from piling up, has actually already been solved by Indonesia's own local wisdom through the Subak system. Our job wasn't to invent a new solution from scratch, but to recognize a pattern that already works and bring it to digital scale.
What's next for SubakIn
Real Planting Data Integration Through e-RDKK and SIMLUHTAN (requiring formal cooperation with the Ministry of Agriculture / Dinas Pertanian), replacing the planting cohorts we currently model from BPS production data and BMKG season onset.
Geographic Expansion Including chili production centers in other provinces (Central Java, Yogyakarta) that are proven to supply the same wholesale markets as West Java, working through the Indonesian Chili Champion network (ACCI), which already covers those regions.
Price Estimates with Uncertainty Intervals For regencies that currently lack producer price data, using a price transmission model from retail data with wider coverage, with the uncertainty range widening automatically when market conditions get volatile.
Scheduled Data Refresh Pipeline Using scheduled jobs (matched to each source's natural pace: daily for prices, twice daily for weather, seasonally for planting calendars) to keep the model current without sacrificing the reliability of the static architecture that's already proven safe for demos.
Outcome Tracking Logging the scheduling recommendations we gave and comparing them against actual price outcomes after a full planting season, as a first step toward empirically proving the system's effectiveness in the field.

Log in or sign up for Devpost to join the conversation.