-
-
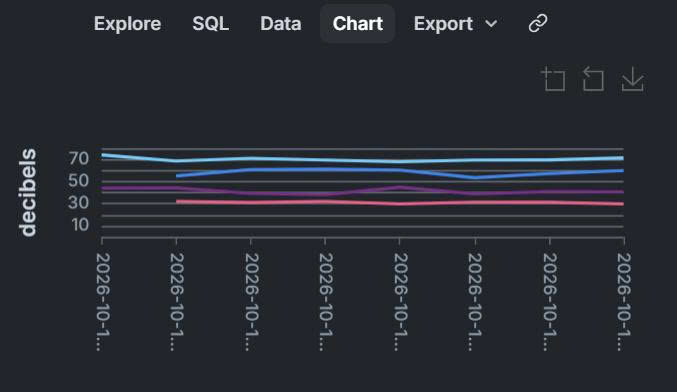
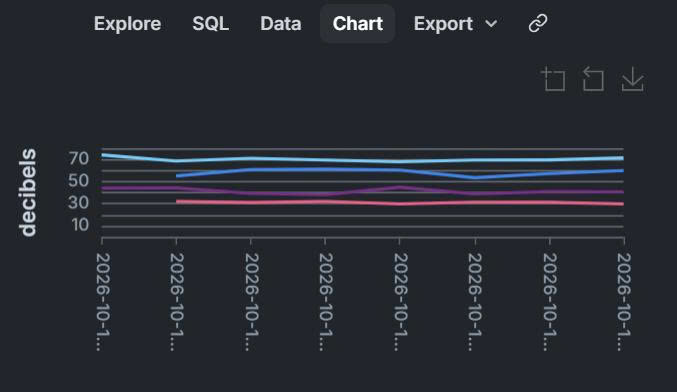
tiger data chart for noise level
-
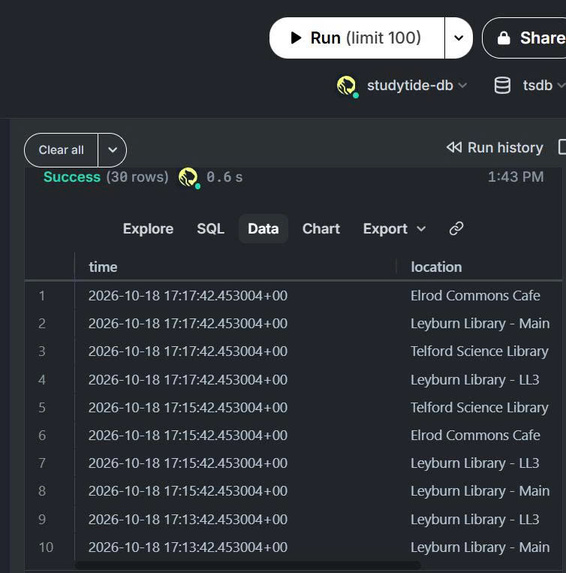
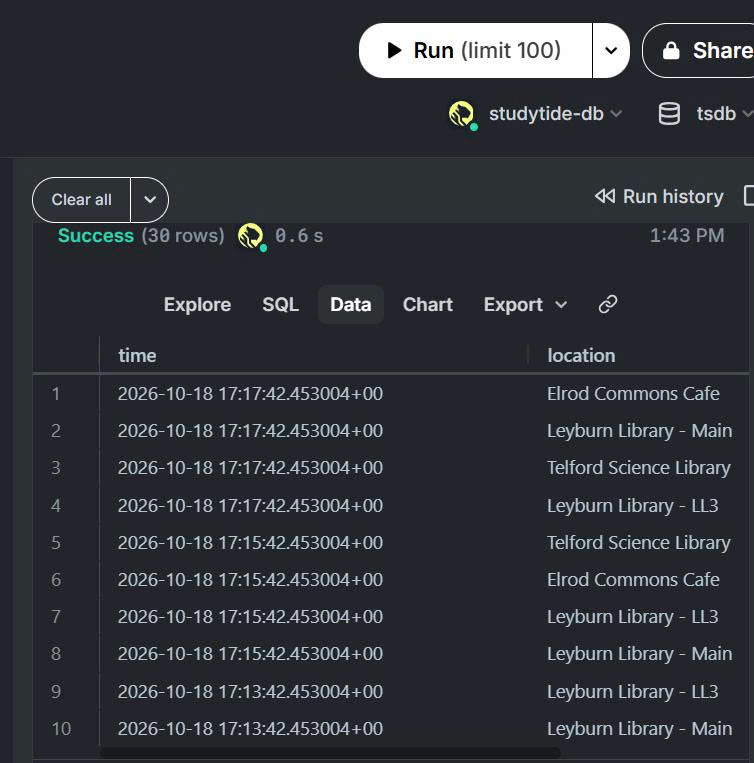
tiger data queries
Inspiration
I've always struggled with where to go to study. There are so many spots on campus yet each time I need to prep for a class, I need to choose the best spot to maximize utility. Some spots offer large monitor setups, but can get noisy when I need absolute silence to focus. On the other hand, when I want to discuss assignments, I cannot study without disturbing others. Sometimes I just want a snack and casual discussion where noise isn't an issue. Moreover, subjecting ratings like "it's too loud" vary from person to person. Therefore, I wanted to build an objective telemetry tool that matches students with the right sensory environment.
What it does
StudyTide is a live campus acoustic telemetry platform that streams real-time sound levels across campus locations into a centralized dashboard.
- Study session intent matching: students select their session goals (solo deep focus, audio study, or group discussion...). The system dynamically recommends the best-matched locations based on live telemetry.
- Dynamic thresholds based on location: rather than enforcing a static noise standard, each space has its own noise levels. A level of 45dB on a collaborative setting can be flagged elevated in a silent zone.
- Rolling time-series trends: include a 90-minute historical analytics view tracks whether a room is quieting down or peaking
- Space contexts: displays real utilities of each location such as dual monitor, specialized software downloaded in computers, Wi-Fi stability, ...
How we built it
- Database engine: powered by Tiger Data (recording timestamped sensor pings)
- Time-bucket aggregation: Use PostgreSQL to calculate continuous rolling metrics
- Built with Python, Streamlit, and Pandas
Challenges we ran into
- Avoiding subjective bias: I figured out I didn't want to let students evaluate how "noisy" the places are with raw physics data, so we just translate raw decibel metrics into acoustic context
- I also had to ensure that asynchronous IoT pings across multiple locations didn't cause gaps in rolling chart visualizations. I resolved this by leveraging Tiger Data's time-buck aggregations and forward-filling rolling metrics.
What we learned
- How high-frequency time-series metrics require dedication analytical aggregation
- How to bridge hardware telemetry simulation with clean human-centered design
What's next for StudyTide
I want to expand coverage across all 20+ campus academic and recreational buildings, segmented floor-by-floor. Integrate Web Audio API so student laptops can passively contribute encrypted volume metrics
Built With
- gemini
- postgresql
- python
- streamlit
- tigerdata
- timescaledb


Log in or sign up for Devpost to join the conversation.