-
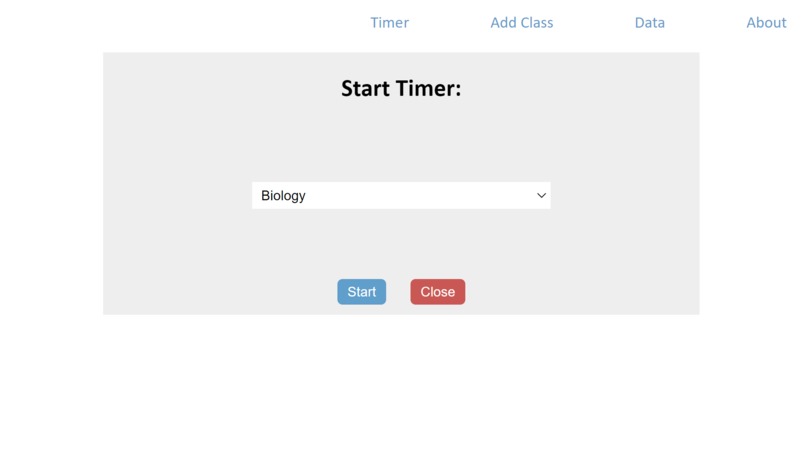
Choose what class to study for
-
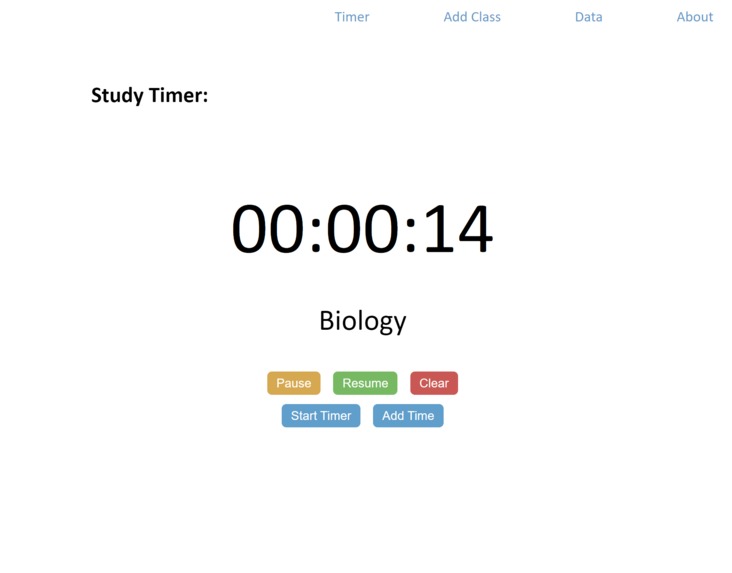
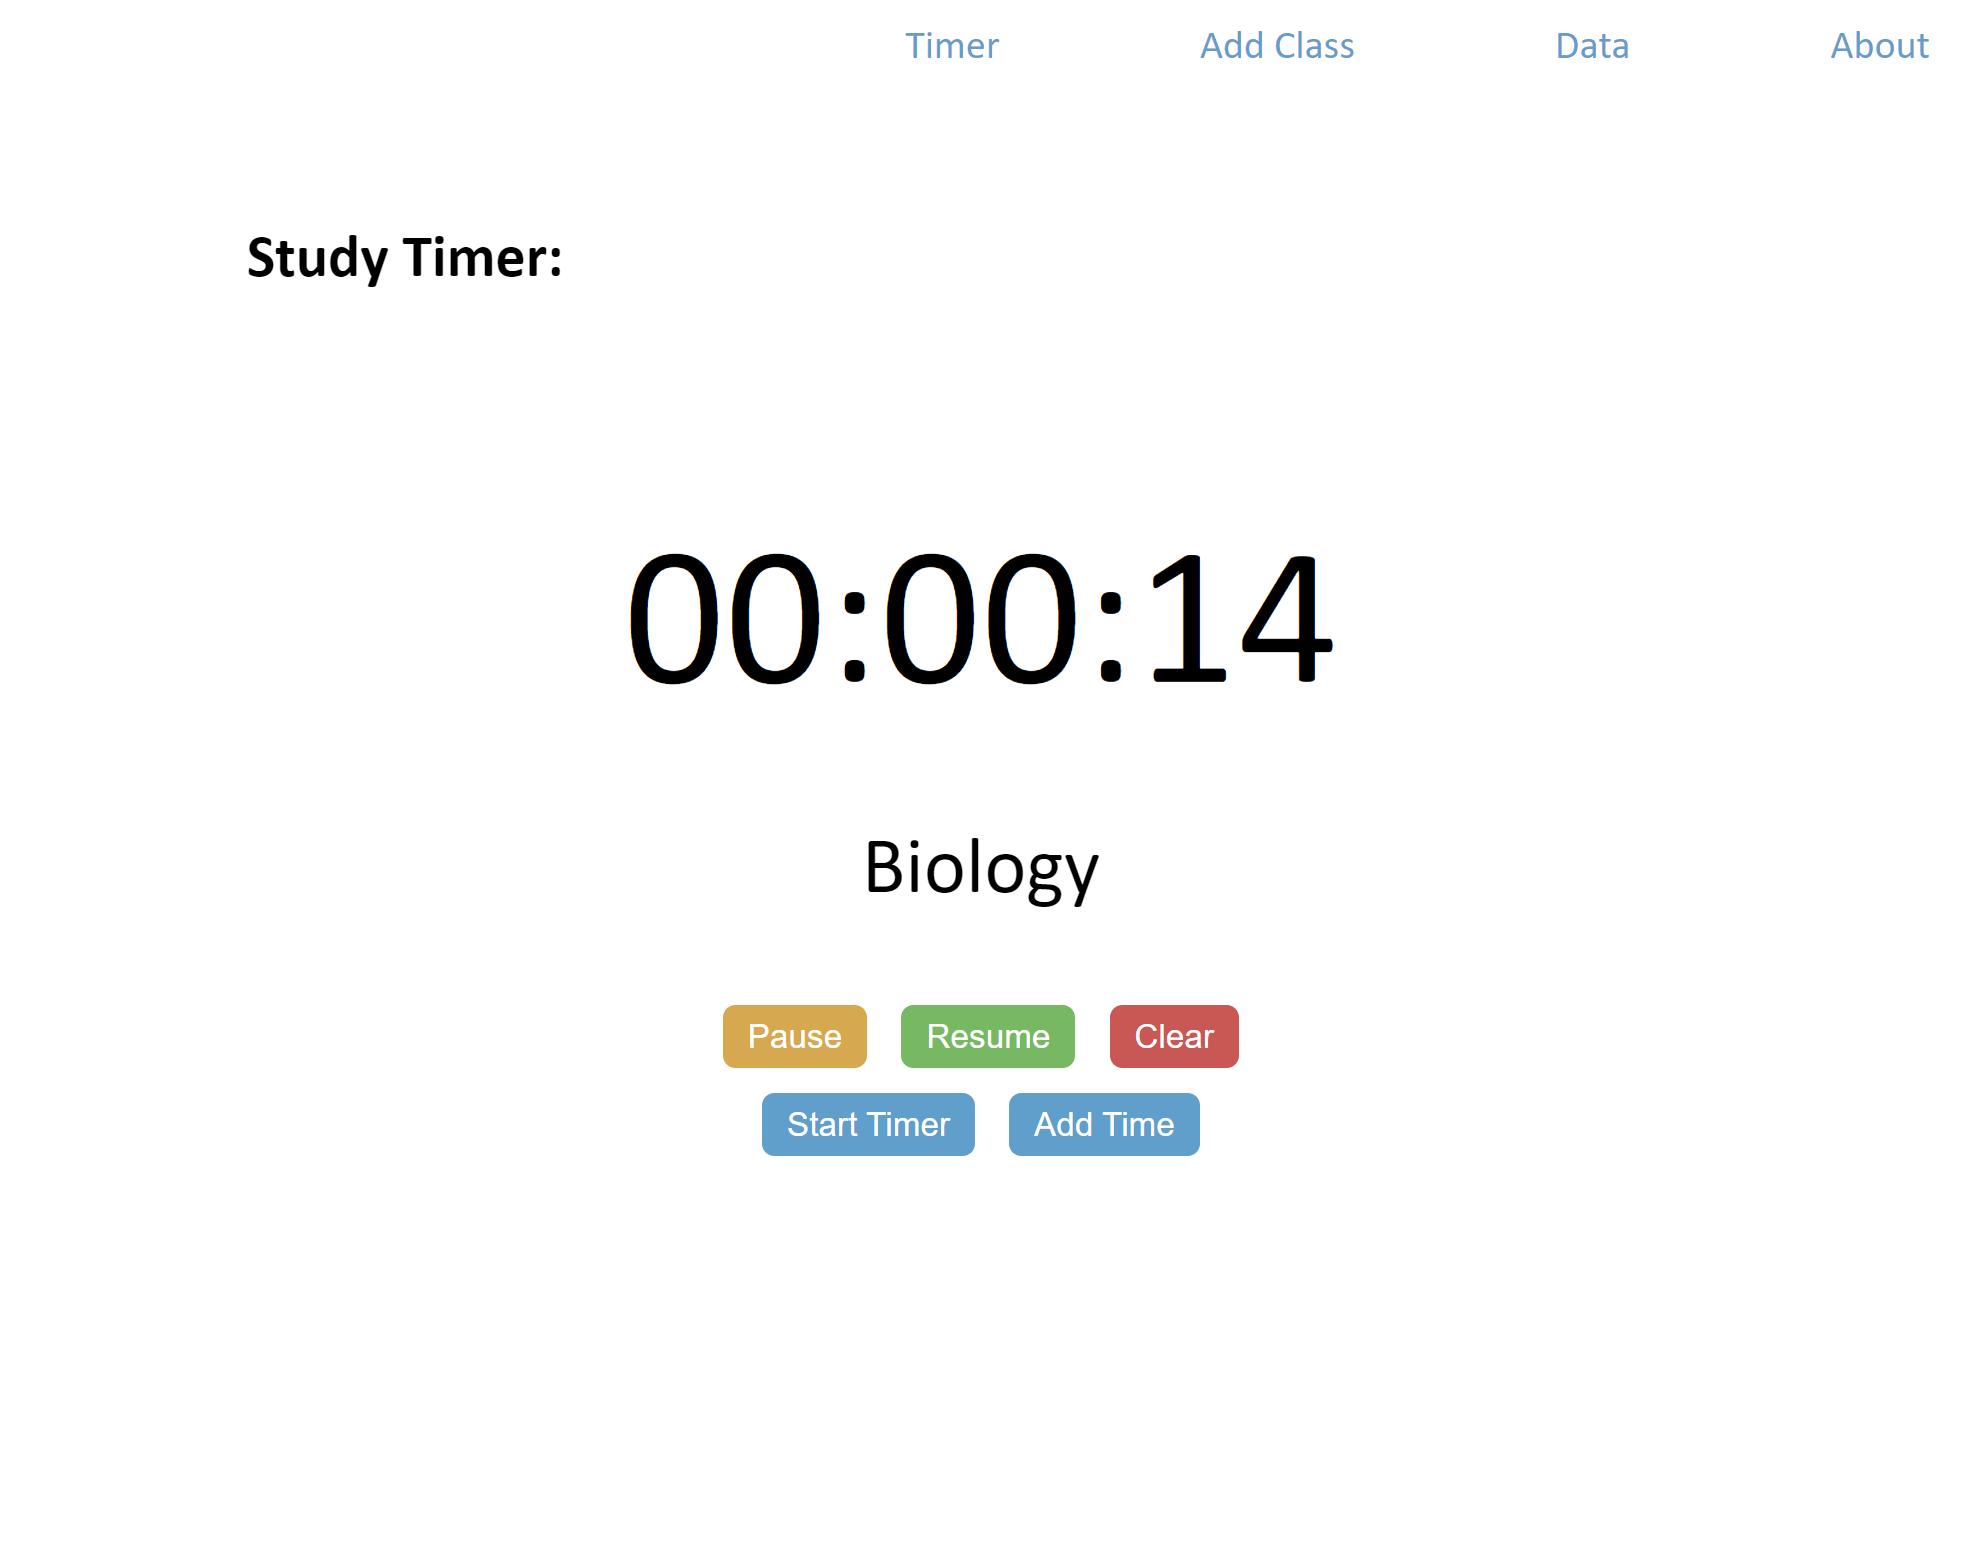
Study Stat Timer (Times how long a class has been studied for)
-
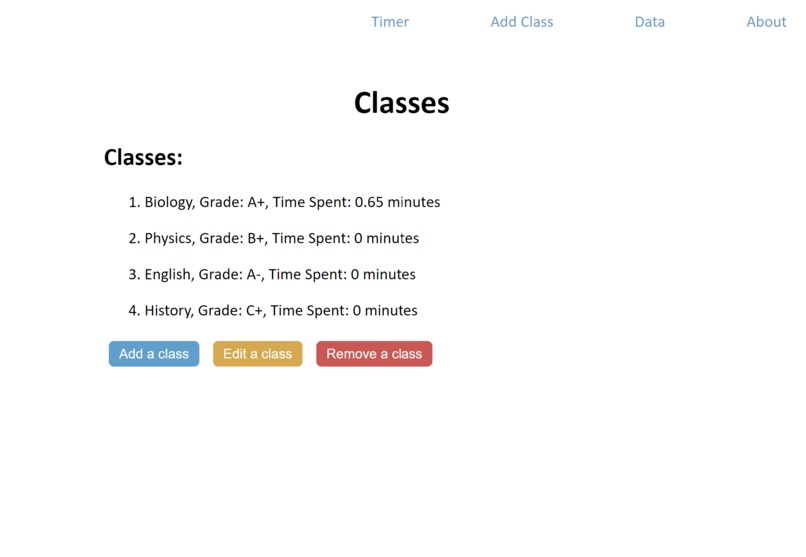
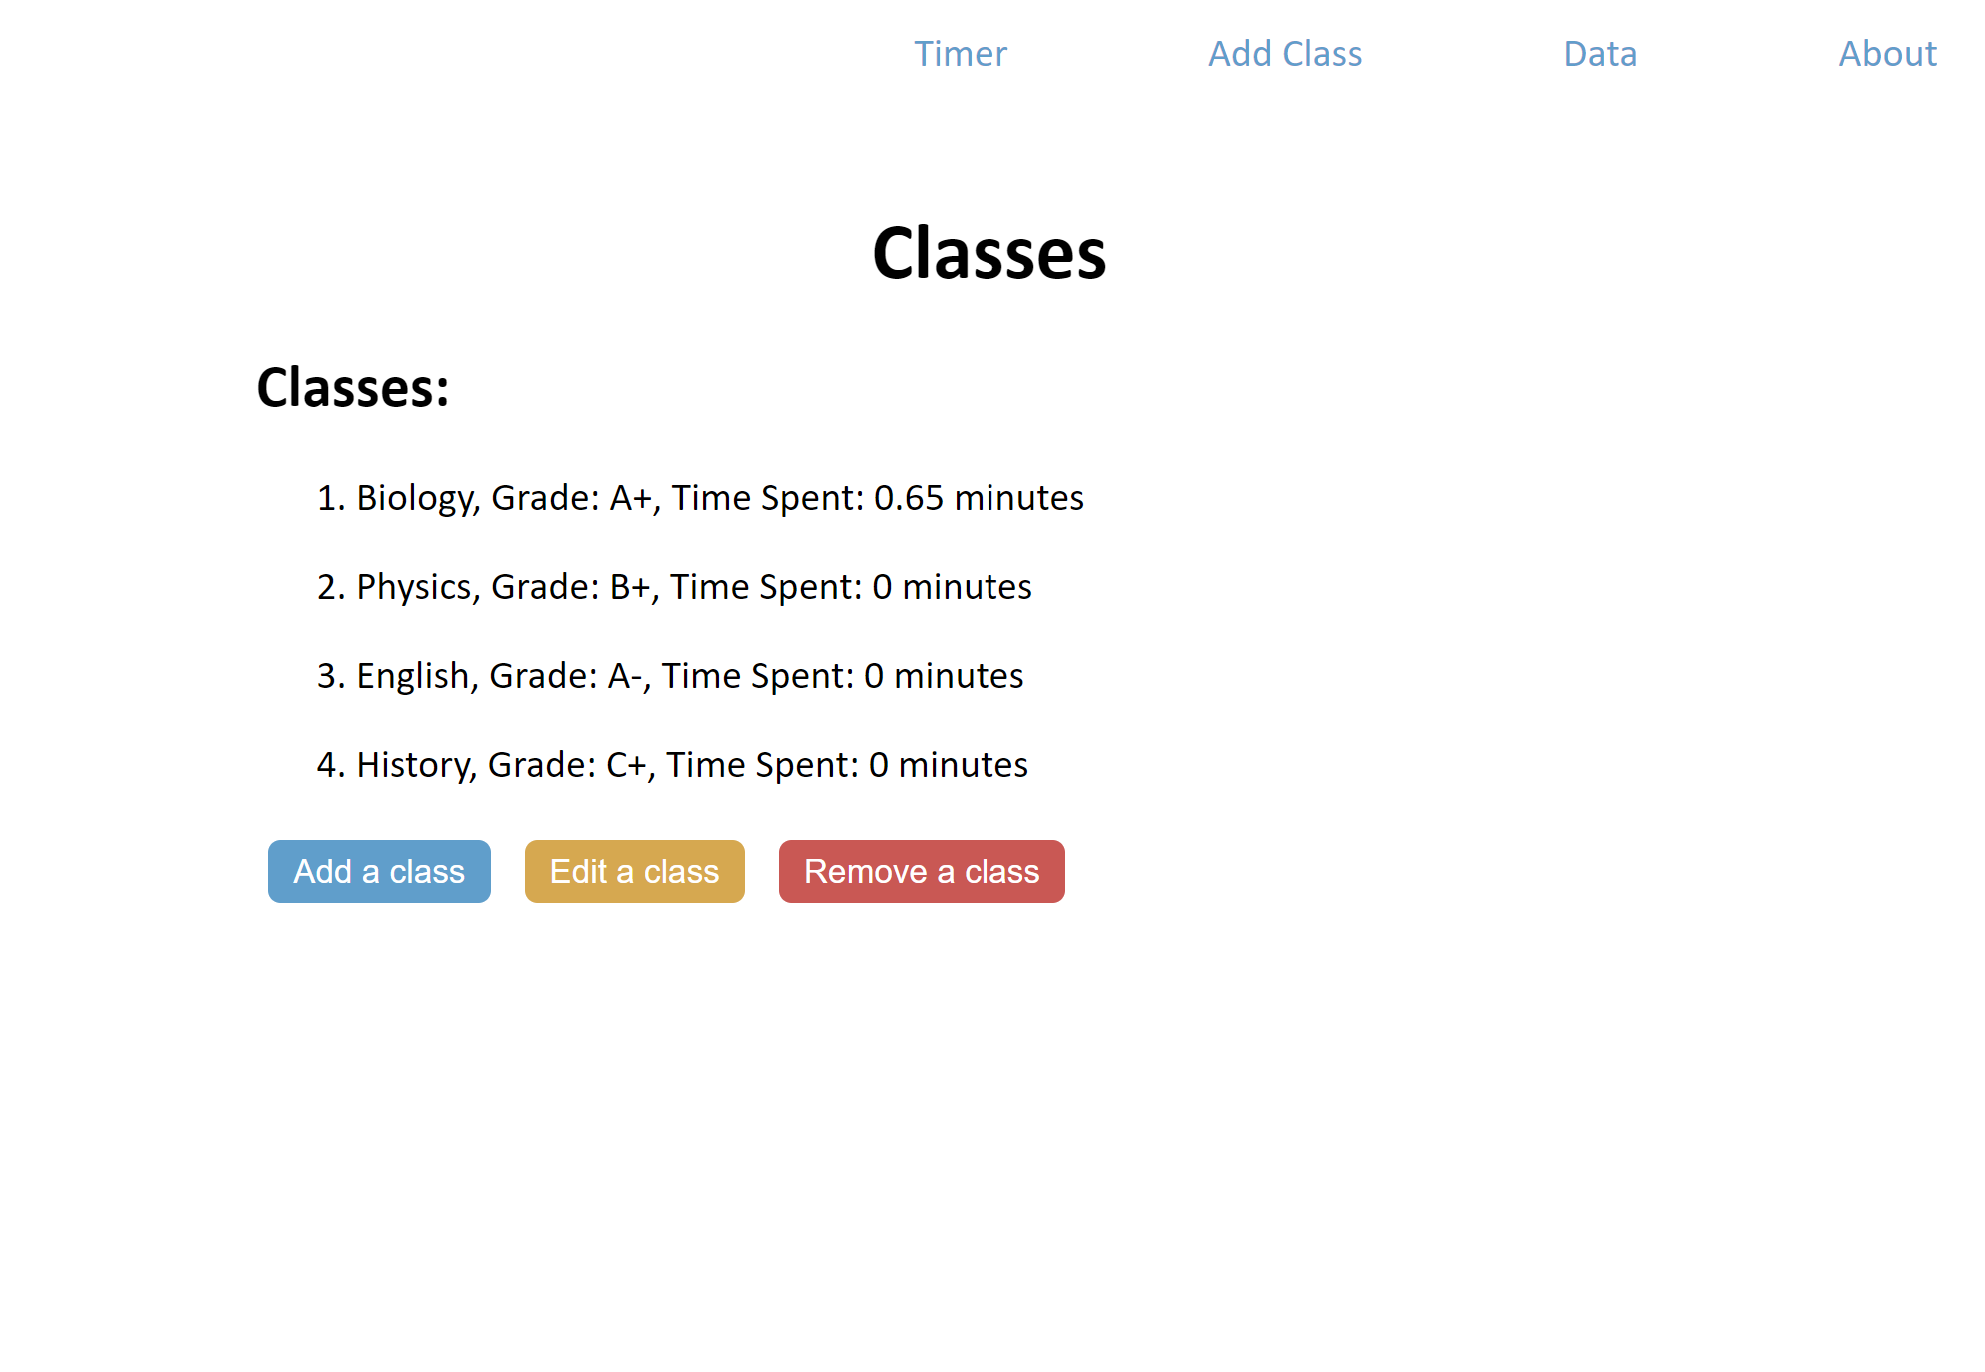
Study Stat Classes (Add, Edit, Delete, View Stats)
-
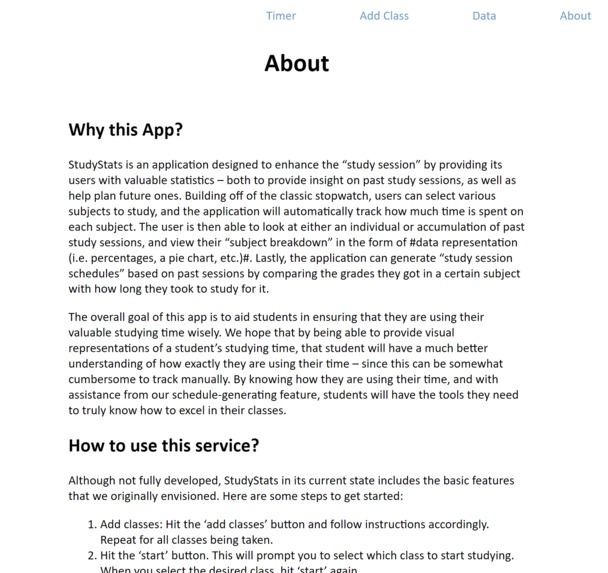
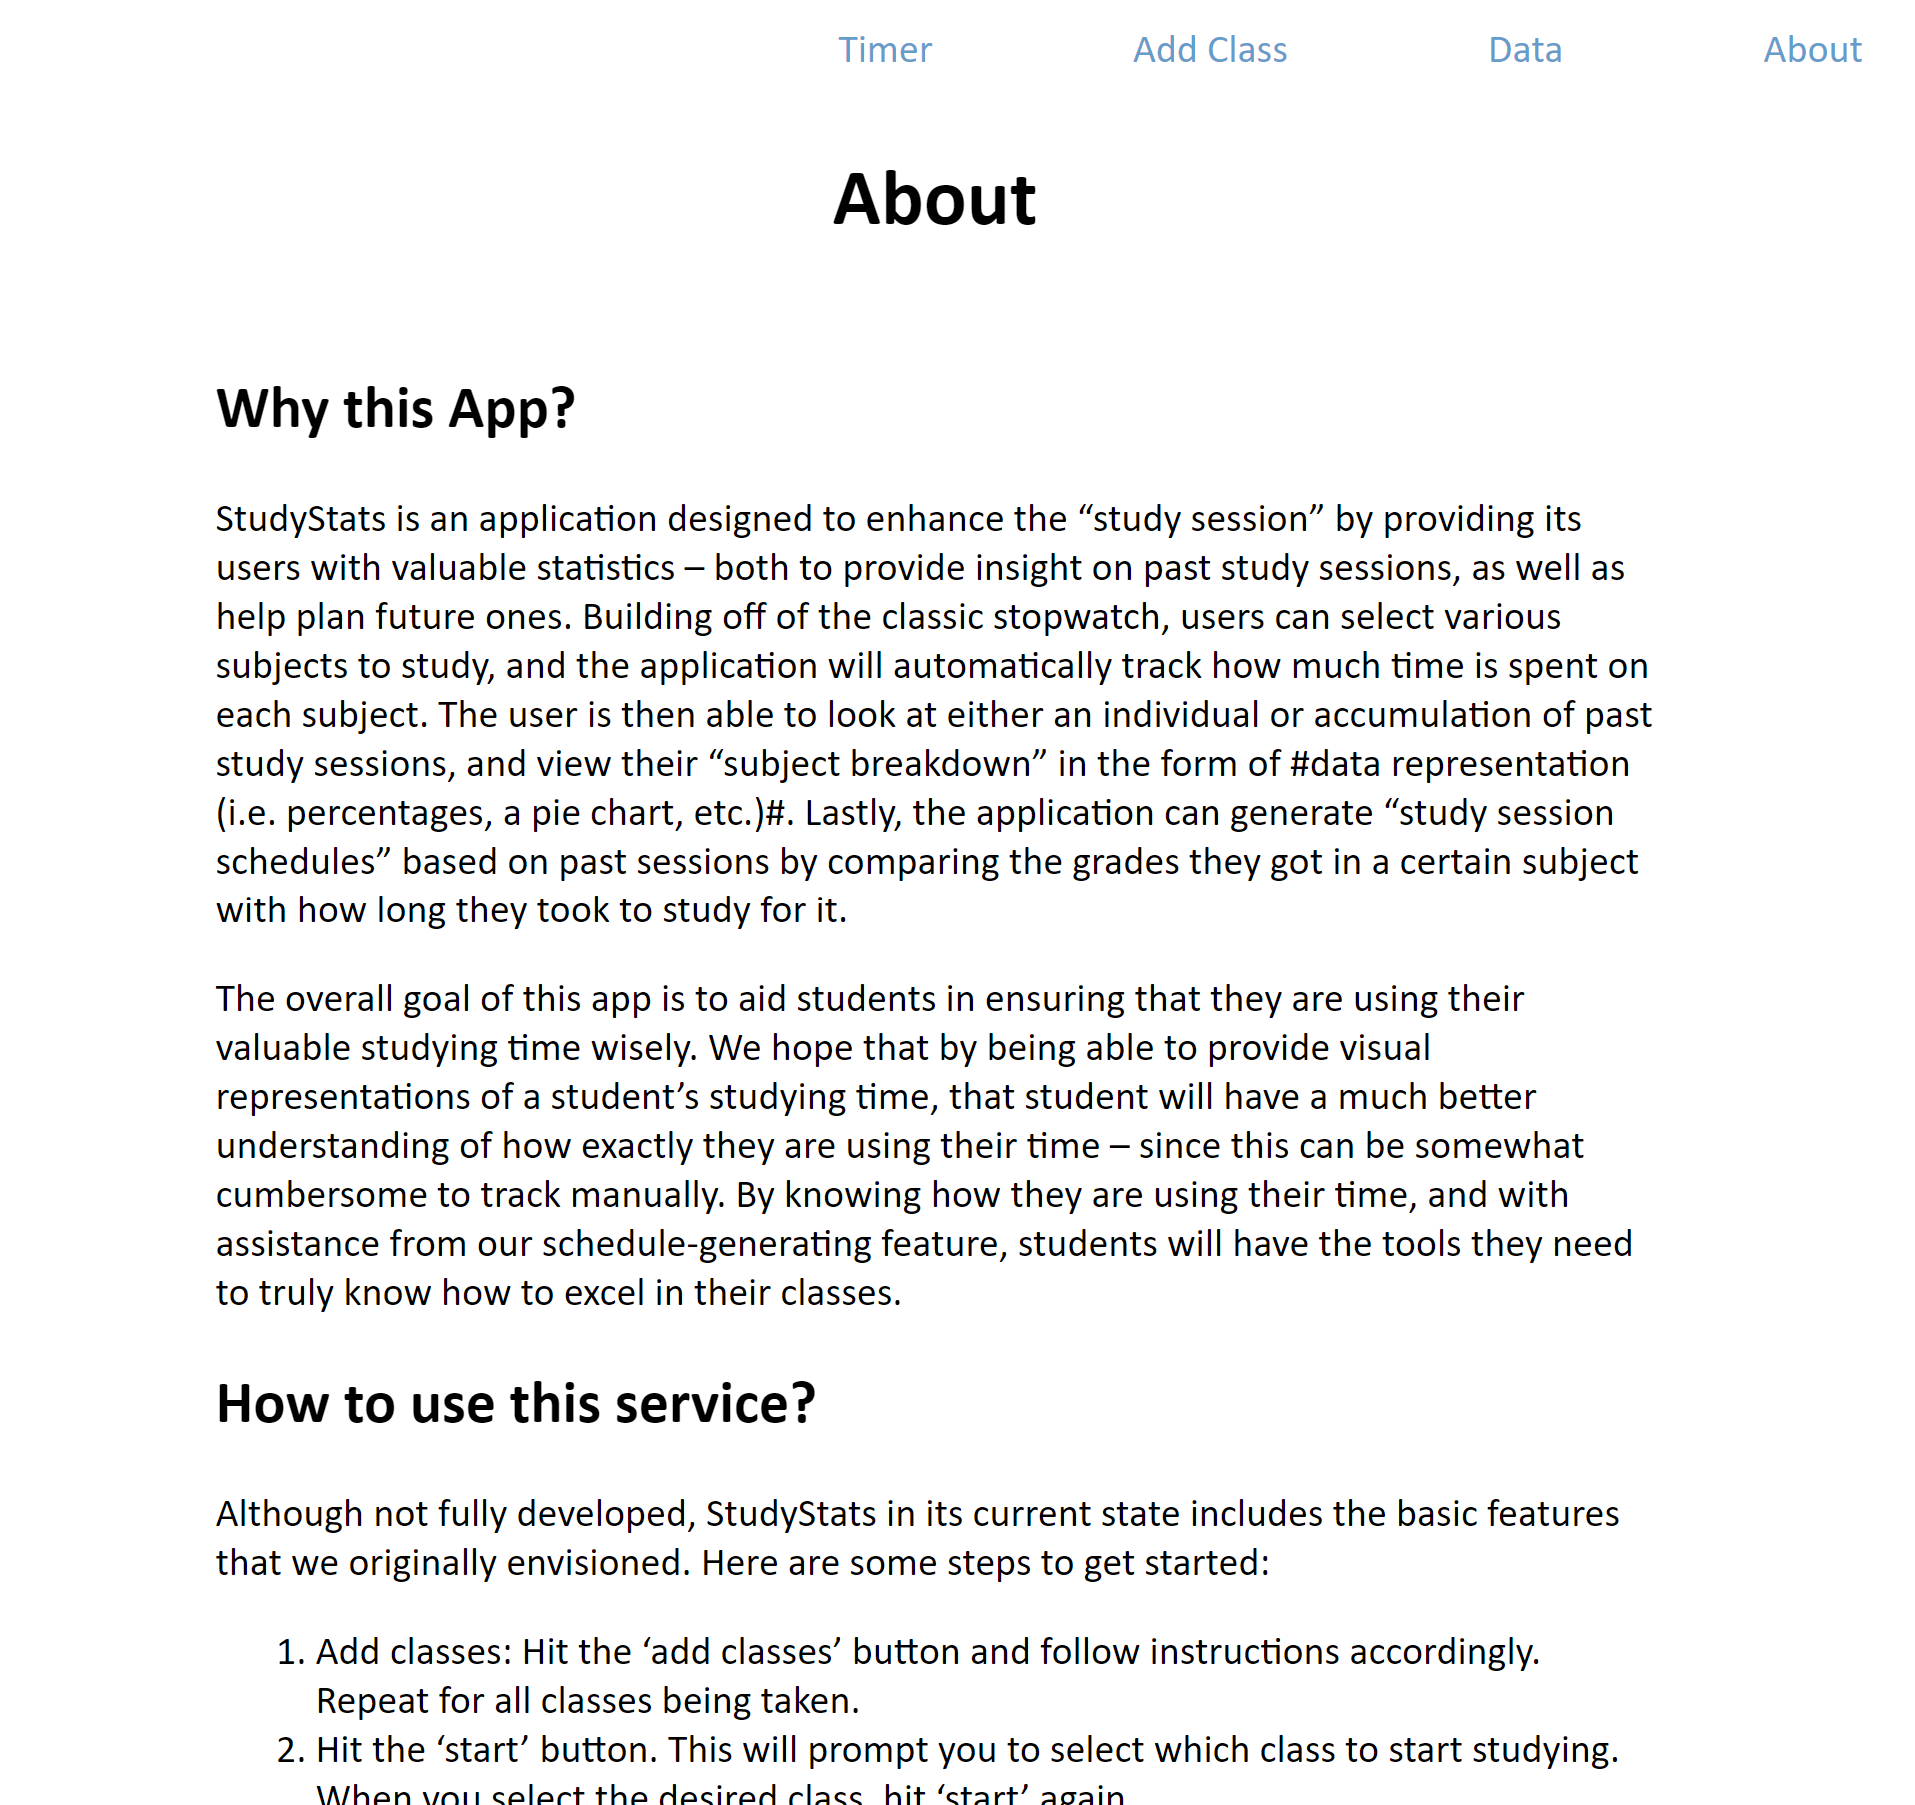
Instructions

What it does
StudyStats is an application designed to enhance the “study session” by providing its users with valuable statistics – both to provide insight on past study sessions, as well as help plan future ones. Building off of the classic stopwatch, users can select various subjects to study, and the application will automatically track how much time is spent on each subject. The user is then able to look at either an individual or accumulation of past study sessions, and view their “subject breakdown” in the form of a visual data representation. Lastly, the application can generate “study session schedules” based on past sessions by comparing the grades they got in a certain subject with how long they took to study for it.
—
How we built it
StudyStats was built using a combination of HTML, CSS, JS, and Python. HTML, CSS, and JS were used for frontend processes, while JS and Python were used for our backend. JS was used for the stopwatch process, which kept track of time as the user studied, while Python was used for processing the raw data and presenting its interpretations of the data to the user. Information was transferred between our JS source file and our Python script using Flask.
—
Challenges we ran into
We did not have much experience linking the frontend and backend of an application together – getting Flask to work properly was one of our largest struggles. We also attempted to implement CockroachDB, then MongoDB into our application, but both were not working as intended.
—
Accomplishments that we're proud of
After a lot of struggle and contemplation, we finally realized how to properly use Flask to get data retrieved by JS to work as input in our Python script. Figuring this out was key to connecting our frontend and backend. This was significant since they were both written by different team members – some of us worked more heavily on the HTML/CSS, while some of us were writing methods and functions using JS and Python. Flask turned out to be the key to linking all of our work together, and the results we got were akin to our original visions for the project.
—
What we learned
To better prepare for future hackathons, we learned that it may be helpful to get more experience developing full-stack applications, both to streamline the production process, but also to be able to best support each other as team members. Since some of us were writing frontend code while some of us were writing backend, we found it helpful to write code in a way that could be easily put-together, like pieces of a puzzle. However, it would be helpful to dive deeper into frontend particularly, simply to have a better idea of how we can transfer our backend logic to something more user-friendly.
—
What's next for StudyStats
We envisioned more features for StudyStats than we were able to implement, but if we were to continue developing this app, here are some things we considered:
- As the application currently is, it can only process one ‘study session’ of various classes at a time. To further explain this, let’s say that I went to the library to study for two hours. During those two hours, I could tell the program which subject I am studying when, but after I leave the library and finish that “session”, the program wouldn’t be able to separate that from if I made another trip to the library tomorrow. All of the times from both days would be lumped into one big “study session” even though, in reality, there were two. In its final form, we would want the application to be able to track separate study sessions to allow for more accurate and detailed data representations. Users would then also be able to view data based on individual sessions, or a cumulation of certain past sessions (such as, to answer the question, “over the past week, what percentage of my total studying time accounts for Calculus?”)
- While the user would be able to view their data from a variety of chosen perspectives, it would be helpful for the application to automatically generate ‘reports’ of data it deems relevant. For example, if the program notices that you have a low grade in Biology, and that over the past week you have not put as much time into Biology compared to other subjects, this feature could have the ability to automatically raise this concern to the student, suggesting him/her to consider studying more in that class. This concern could be in the form of a specific data visualization that would best emphasize this concern, as well as a generated ‘alert’ to convey this even more clearly to the user.
- Users would be able to make accounts and log in, to track their statistics online, including…
- …on their mobile devices. An app could be developed to help carry out these features for a more ‘on-the-go’ experience where using the app on a laptop/PC is not practical.

Log in or sign up for Devpost to join the conversation.