-
-

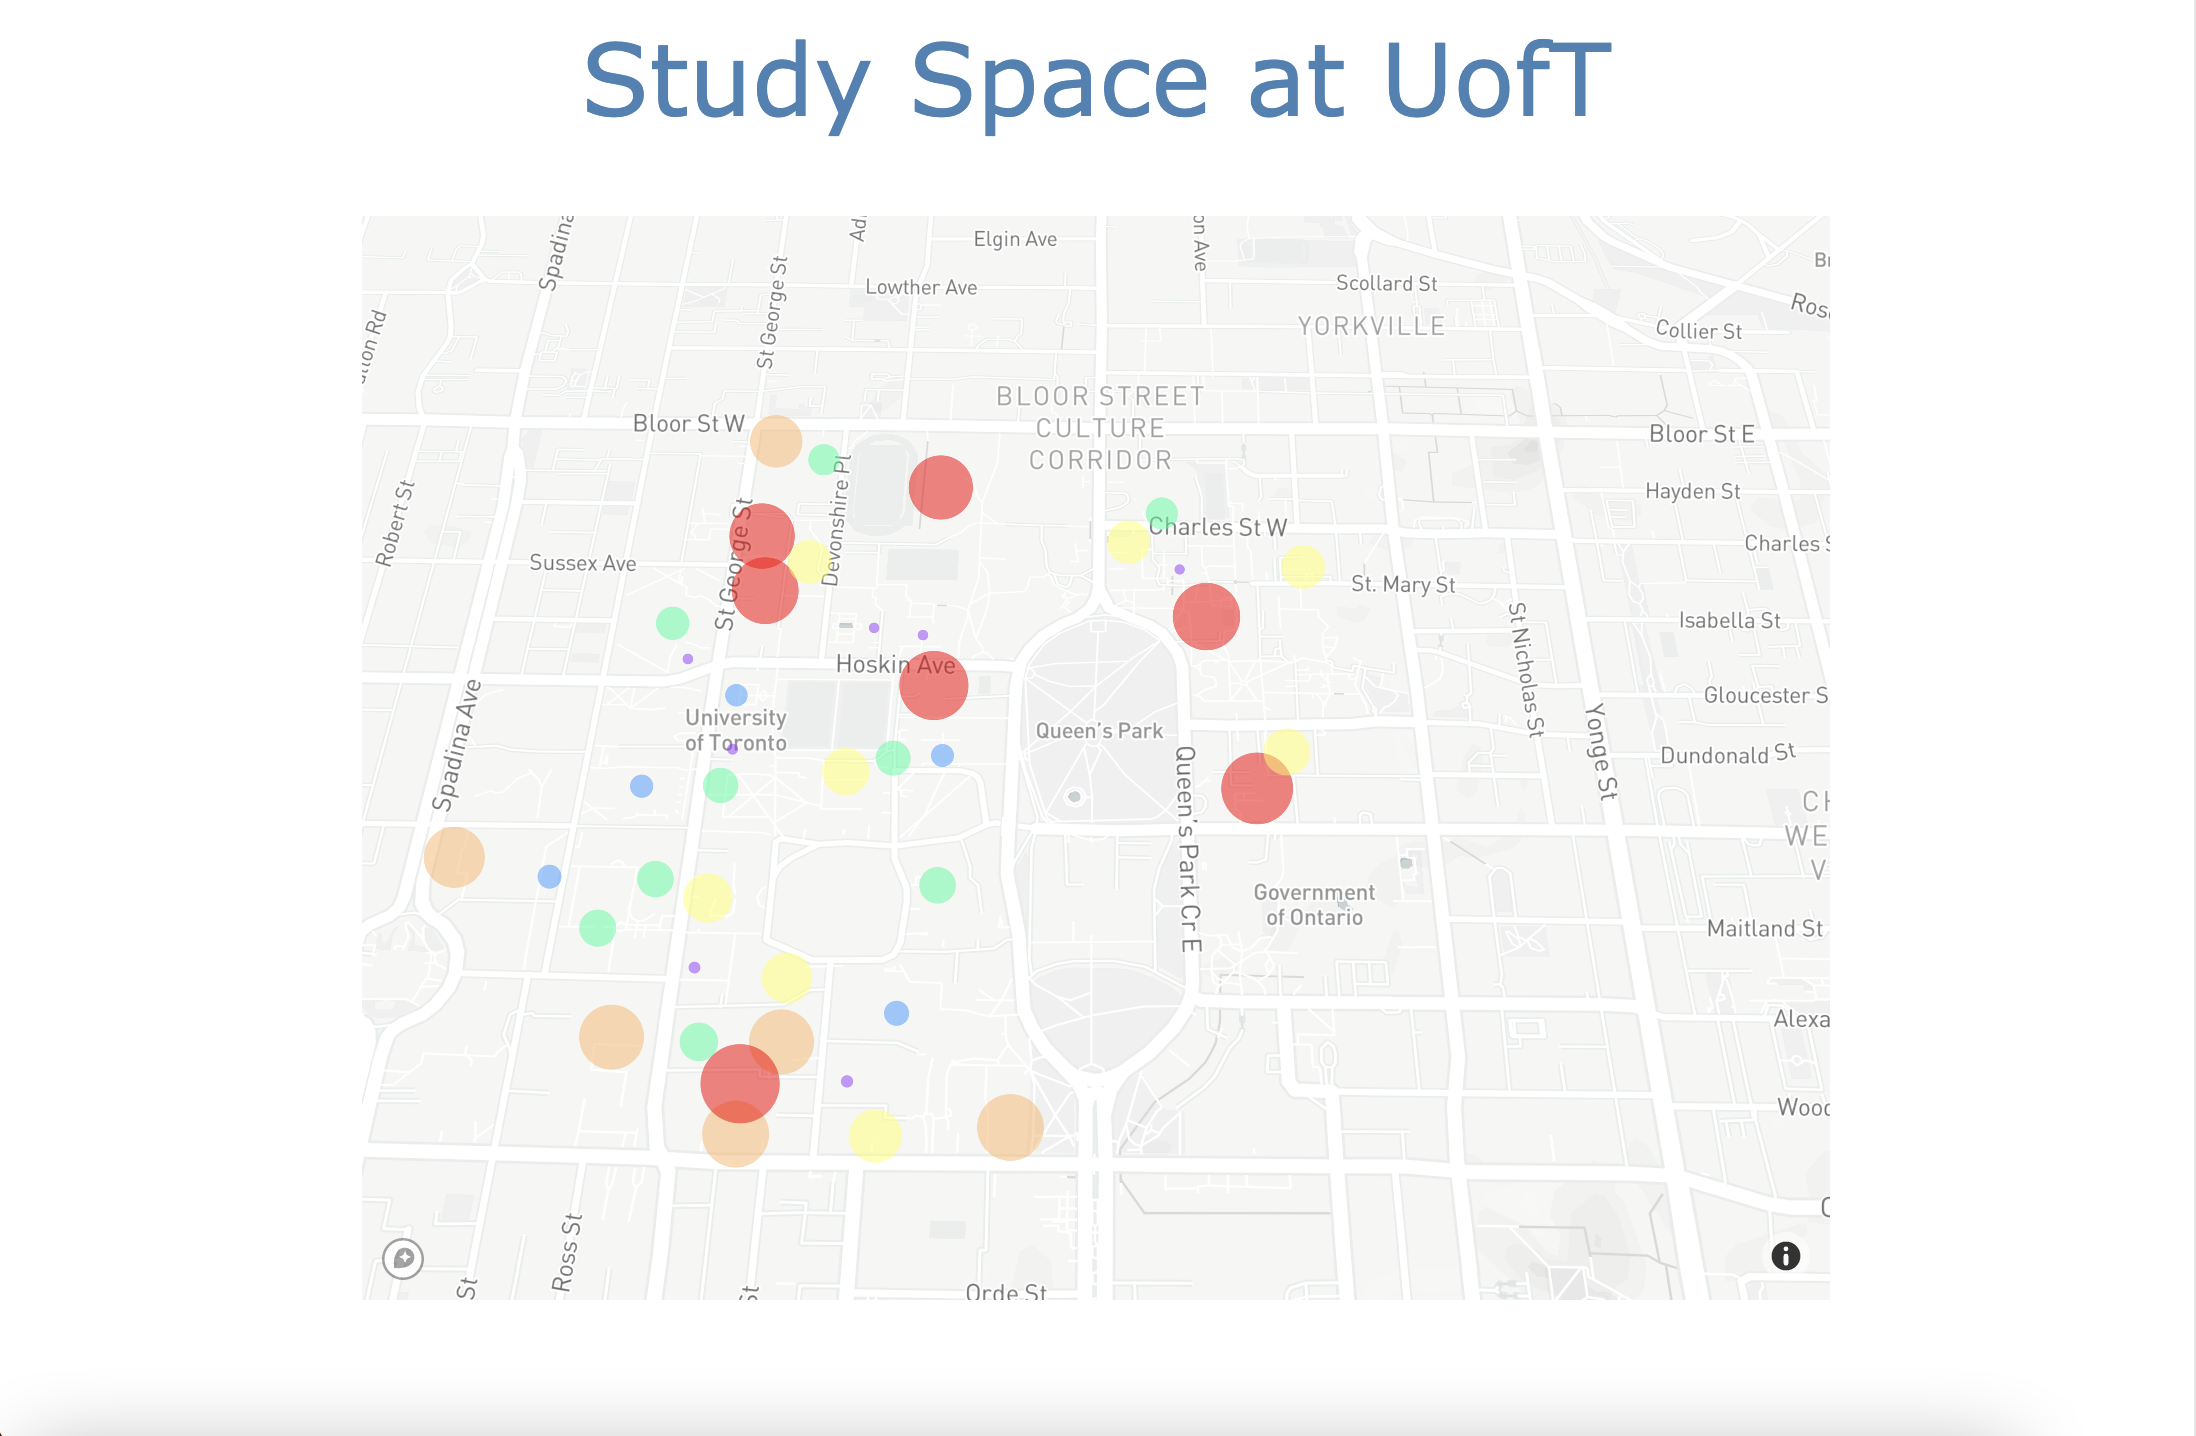
The Studyspace Finder Homepage displaying crowdedness of buildings using plots.
-
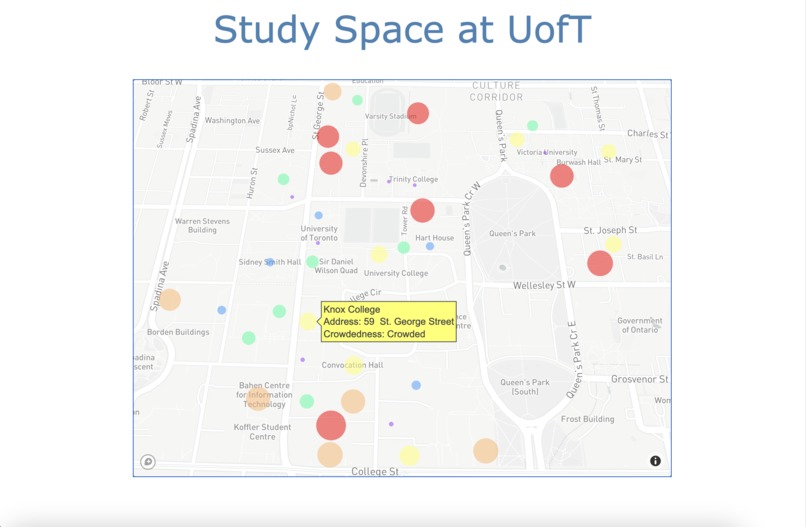
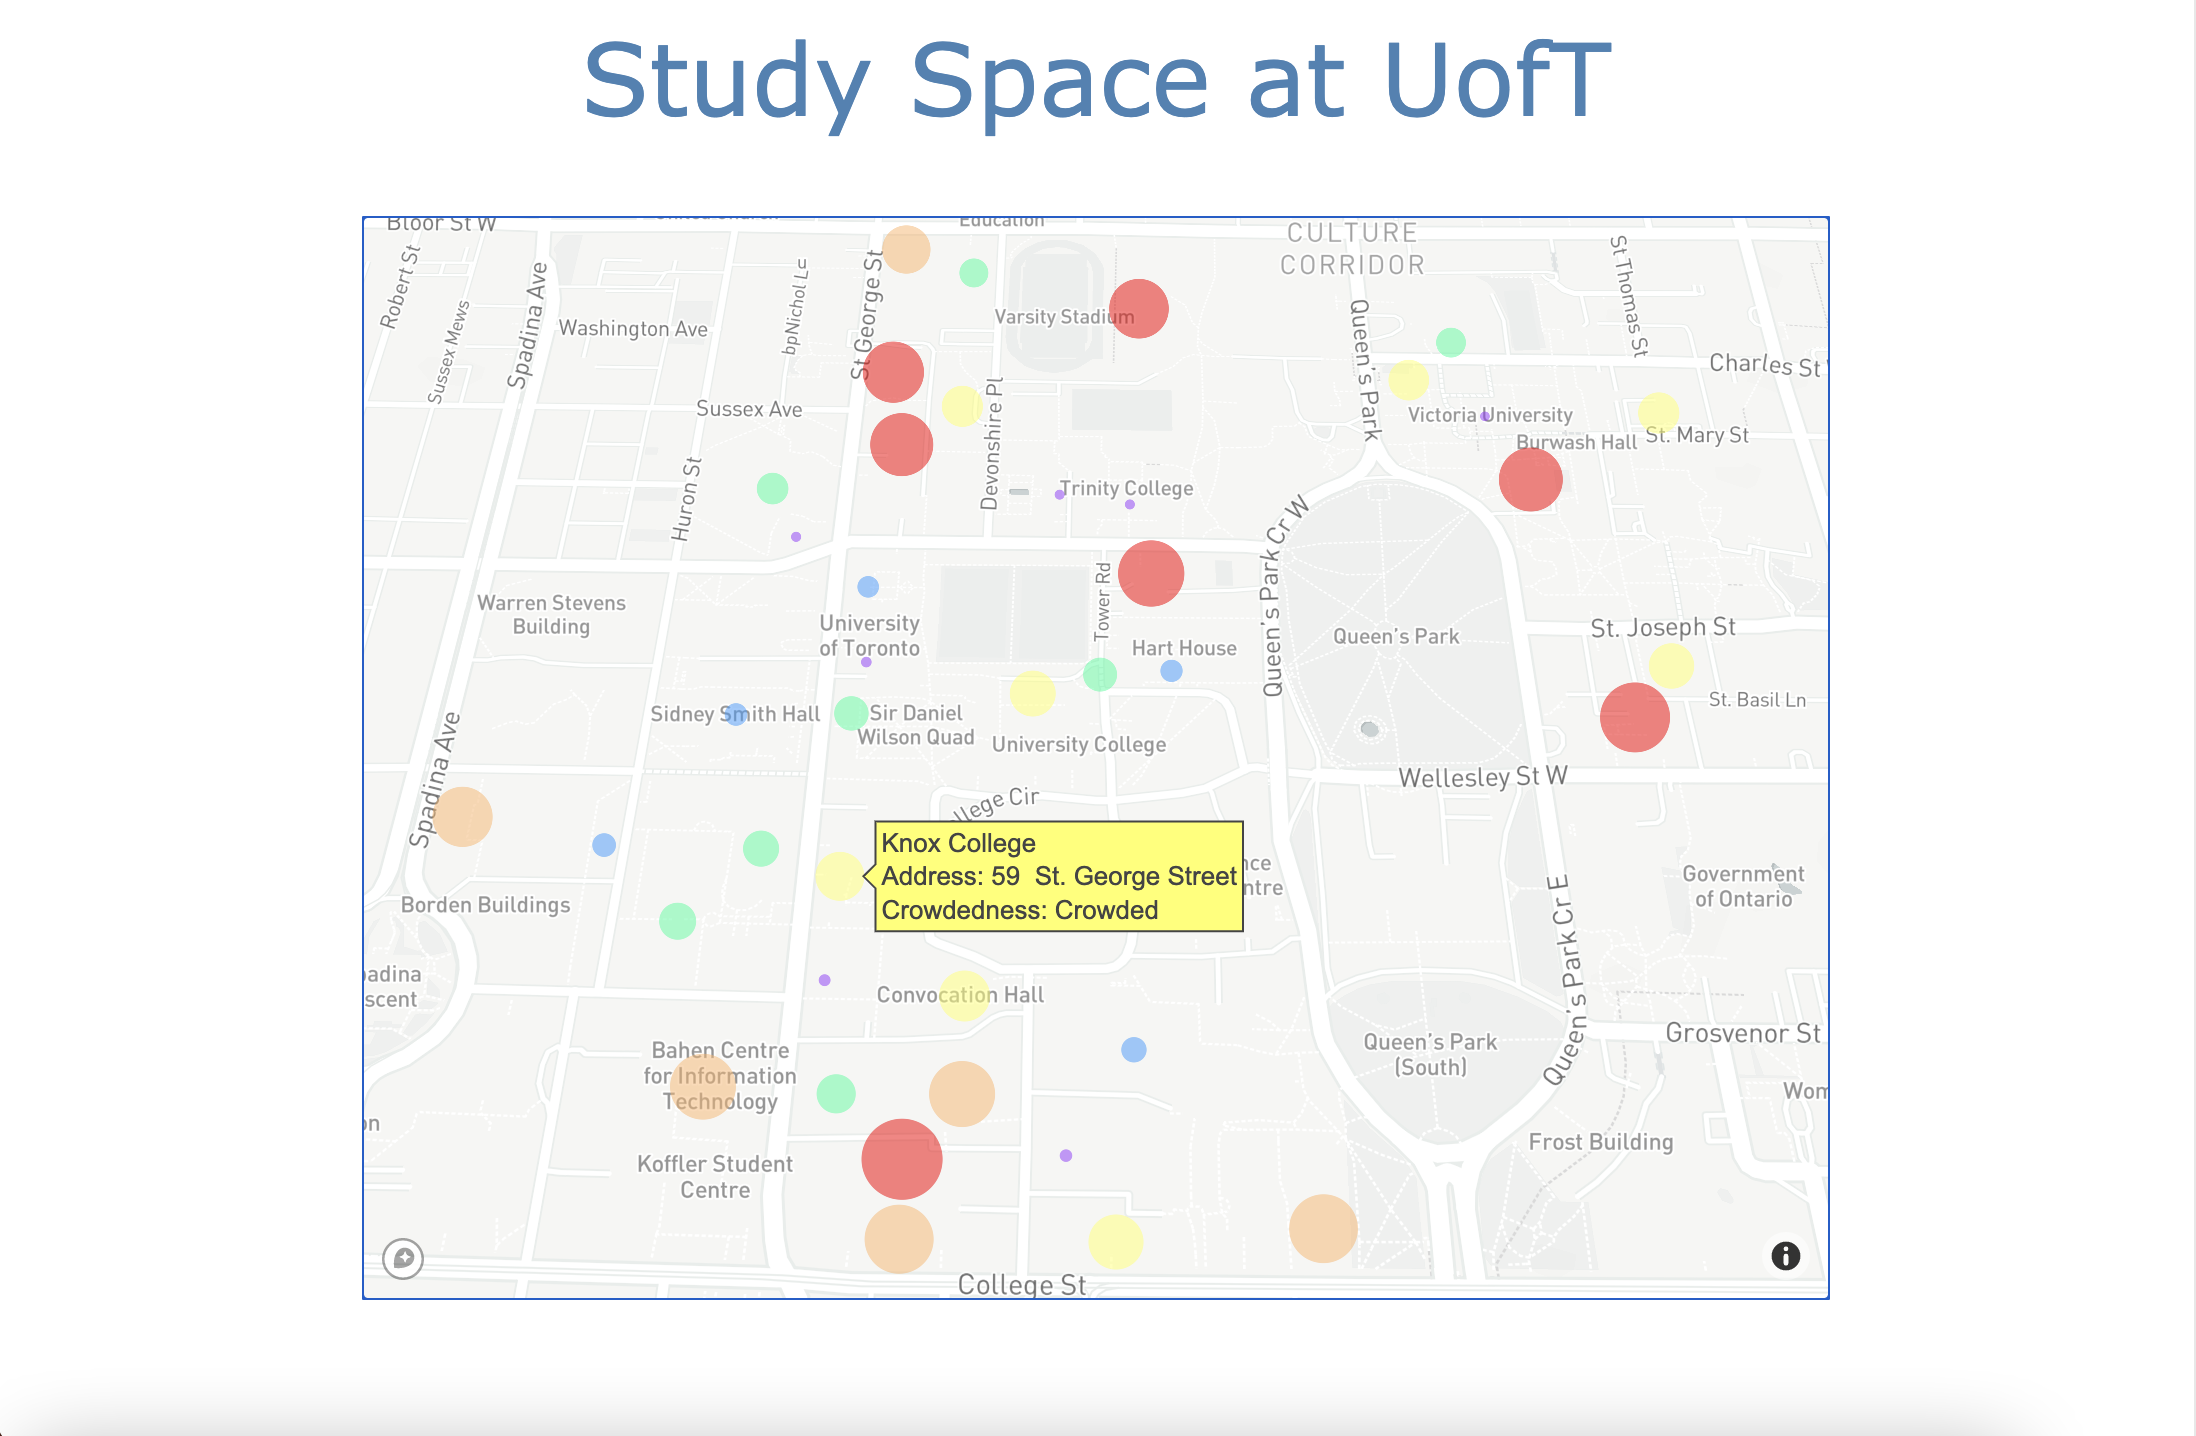
Details of a building is displayed when mouse is hovering over a plot.
-
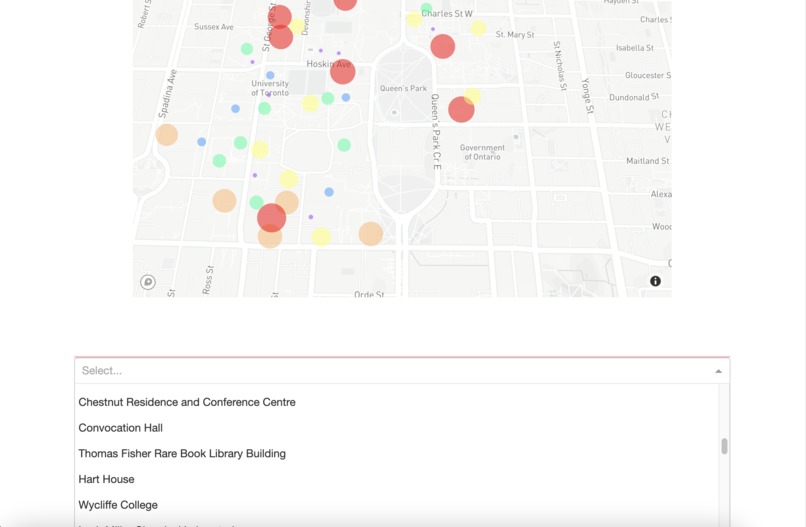
Check-in and Check-out options so that users can indicate which building they are in.

Inspiration
As UofT students, we have discovered a critical discrepancy between the number of students who wish to study and the number of study spaces on campus. Our observations showed that students leave study spaces dissatisfied right after arrival due to the fact that they were full. These scenarios would be less realized had the students known the crowdedness at the study locations they were about to travel to.
What it does
Studyspace Finder displays the density of people per study location at the University of Toronto St. George campus on an interactive map. The density of people per location is tracked by a “check-in and check-out” system inputted by the users. The density of a study location is communicated to the user by the marker size, colour, and a label that ranges from “Empty” to “Extremely packed.” With the functionality that this application provides, the user can choose whether to study at a busier or a quieter location on campus by observing the map.
How we built it
Studyspace Finder is a Flask app designed using the Dash Plotly API in python. By aggregating the university buildings data and selecting key popular choices of students, we were able to plot the busyness of each building determined through user-input. The data were stored and pulled through the Google Spreadsheets API, and linked it to Plotly.
Challenges we ran into
The biggest challenge in developing Studyspace Finder was customizing the map to represent the density data in an intuitive way. For instance, determining the contents of what each label should present was a careful process: should it be presented in wait time, number of people, or number of empty seats? Then, it was the method of presentation: the colors, the size of plots, and the distance between them had to all synergize into an intuitive plot.
Accomplishments that we're proud of
We were proud that we were able to turn lines of code into visual, informational, and useful data for the University of Toronto students so that they can make productive decisions. Our career goals as aspiring software engineers are to build pragmatic software solutions to benefit the users in the most efficient way possible.
What we learned
From the development of the user-experience standpoint, we learned the value of data visualization and how quickly it can communicate useful information. From the technical development standpoint, we learned how to utilize Google API’s and a new Python library called Plotly.
What's next for Studyspace Finder
The next steps for Studyspace Finder are for it to be developed into a prototype mobile application and to be tested within the University of Toronto community. Once it is deemed to be successful, the application can be expanded to other universities. Although Studyspace Finder is a small and simple application, it is a small step towards improving the academic lives of students at UofT little by little everyday.

Log in or sign up for Devpost to join the conversation.