Studio Incident Copilot
Inspiration
I work in Diamond-tier enterprise support a Cloudinary, where diagnosing a media pipeline incident often means digging through logs across multiple systems to find a root cause that's hiding several steps away from where the symptom actually shows up. A CDN error spike, for example, can look like a CDN problem — when the real cause is a bad encoding job upstream. That gap between "something's wrong" and "here's the actual cause, with evidence" is where most of the time gets lost. Studio Incident Copilot is my attempt to automate that specific step.
What it does
Studio Incident Copilot is a Gemini-powered agent that investigates media pipeline incidents the way a support engineer would:
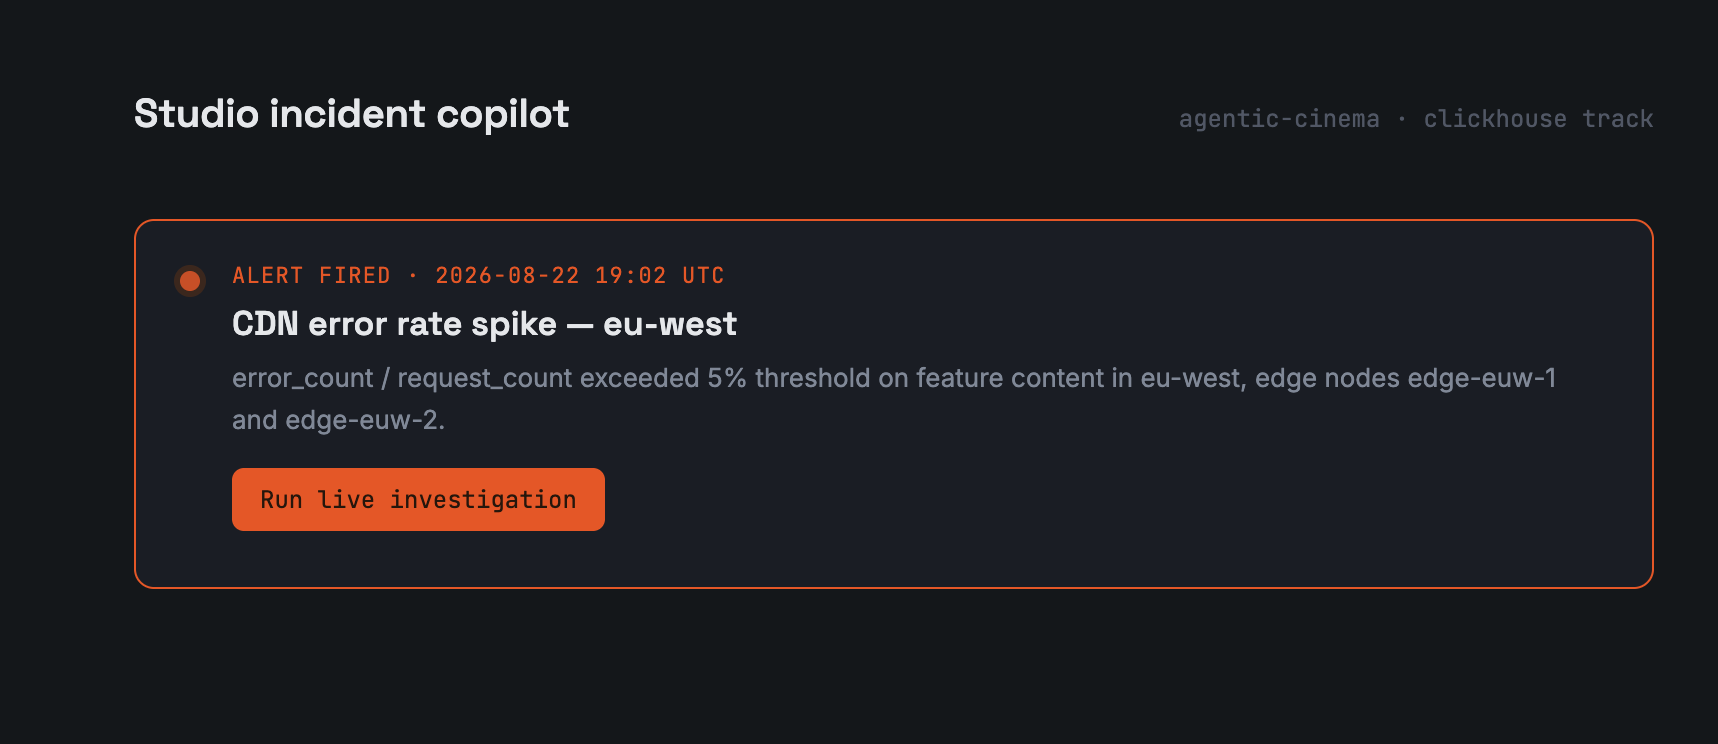
- Detects — queries CDN telemetry to find where and when error rates spiked
- Investigates — queries encoding pipeline telemetry for that exact region/content type/time window, specifically checking for failed or degraded jobs before considering any other explanation
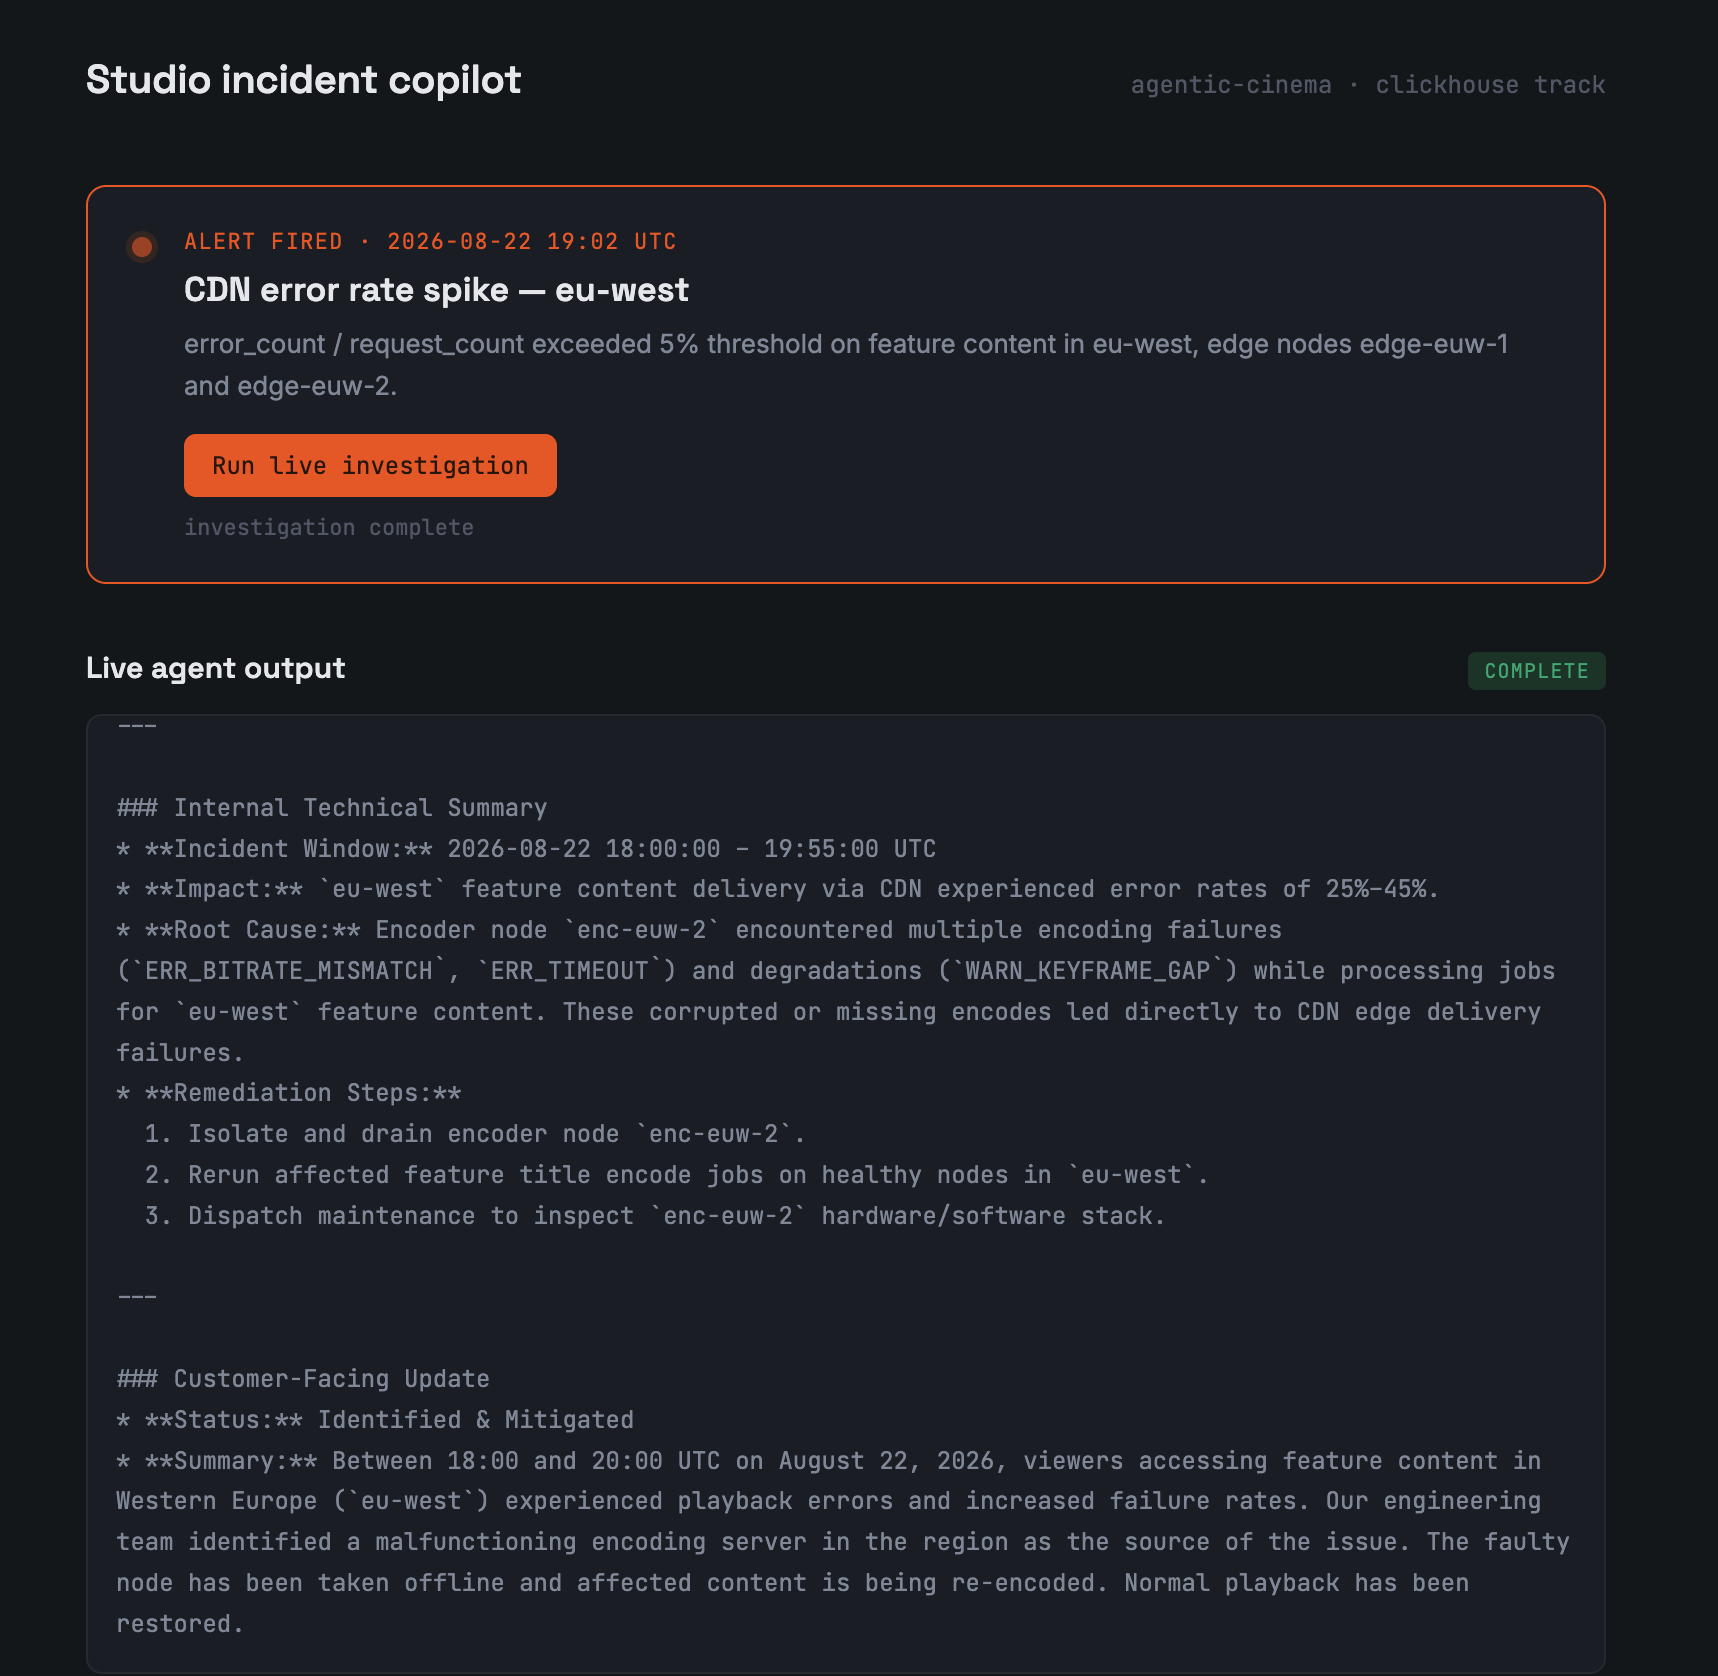
- Diagnoses — identifies the responsible component and confirms whether the fault is isolated or widespread
- Reports — produces two outputs from one investigation: an internal technical summary with evidence, and a plain-language customer-facing update
The agent shows its work — every SQL query it runs against ClickHouse is visible in the live investigation trace, not hidden behind a black-box verdict.
How I built it
- Google ADK (Agent Development Kit) powers the agent's reasoning loop, running on Gemini
- ClickHouse Cloud stores the pipeline telemetry (encode job logs, CDN delivery events), queried live at runtime through the official mcp-clickhouse MCP server
- A synthetic dataset (~13,000 rows across encoding and CDN events, generated in Python) simulates a real incident: a faulty encoder node producing corrupted output for one content type in one region, surfacing downstream as a CDN error spike
- The agent is deployed on Cloud Run, with a live incident-thread UI (hosted on GitHub Pages) that streams the investigation — tool calls, SQL queries, findings — directly from the running agent via ADK's REST API
Challenges we ran into
- Getting
McpToolsetto import correctly took some digging — apyenvshim was silently routing to a different Python environment than the one withmcp-clickhouseinstalled - The agent's investigation path wasn't reliable at first — a loosely worded instruction prompt let it occasionally skip checking the encoding pipeline and land on a plausible-but-wrong CDN explanation. Tightening the prompt to mandate a specific query before any conclusion fixed this consistently
- Deploying to Cloud Run surfaced a new issue: the MCP subprocess needed more time to start in that environment than locally, which meant increasing the session timeout
--set-env-varsreplaces rather than merges environment variables on Cloud Run — cost some time until switching to--update-env-vars
What's next
- Formal forced-function-calling instead of prompt-based enforcement, for stricter guarantees on the evidence-first investigation order
- Expanding the synthetic dataset to include more incident types (CDN-native issues, moderation pipeline backlogs) so the agent has to genuinely discriminate between root causes rather than always finding the same one
- A persistent incident history / dashboard view across multiple investigations
Built with
Google ADK, Gemini, ClickHouse Cloud, mcp-clickhouse (MCP), Google Cloud Run, Python, JavaScript.
Built With
- clickhouse
- gemini
- google-adk
- google-cloud-run
- html
- javascript
- mcp
- python

Log in or sign up for Devpost to join the conversation.