Autonomous Broadcast Reliability Agent — Built on Gemini Enterprise Agent Platform × Grafana Labs
Partner Track: Grafana Labs Core Stack: Gemini Enterprise Agent Platform · Gemini 3.6-flash · Cloud Run · Grafana Cloud MCP (Prometheus + Loki)
Partner Fit — Why Grafana Labs Studio Guardian doesn't bolt Grafana on as a dashboard — Grafana Cloud is the agent's nervous system. Every predictive score, every remediation decision, and every audit record is derived from live PromQL and LogQL queries issued through Grafana Cloud's Model Context Protocol (MCP) server. Without Grafana, the agent has no eyes on the infrastructure it protects. That's the integration depth this track is built to reward.
Inspiration
During global marquee broadcasts — a World Cup final, the Super Bowl, a headline concert livestream — operations run on a razor's edge. A 30-second stream freeze or a dropped SCTE-35 ad cue burns hundreds of thousands of dollars in ad revenue, triggers SLA penalties, and quietly destroys viewer trust.
Traditional monitoring stacks are reactive by design: alerts fire only after playback has already degraded for thousands of viewers. We asked a harder question — what if an autonomous operational supervisor could predict infrastructure saturation 5–15 minutes before customer impact, audit broadcast-specific signals like SCTE-35 drift and EBU R128 loudness, and execute mathematically verified, safe remediations on its own? Studio Guardian is our answer: a deterministic, multi-step agent that turns Grafana from a rear-view mirror into a windshield.
What it does
Studio Guardian is an autonomous multi-agent operational supervisor for high-concurrency live streaming pipelines, orchestrated on the Gemini Enterprise Agent Platform and running as containerized services on Cloud Run.
Dual-Mode Operational Engine A continuous Predictive Prevention Track scores saturation risk before degradation occurs, while a sub-500ms Reactive Fallback Track handles acute outages the moment they strike — with context handed off between the two tracks without loss of investigation state.
Specialized Media Sentinels Media-aware agents, reasoned by Gemini 3.6-flash for low-latency structured inference, continuously audit:
SCTE-35 ad timing drift relative to PTS, within ±200ms Splice alignment errors EBU R128 loudness deviation from the -24 LUFS broadcast target
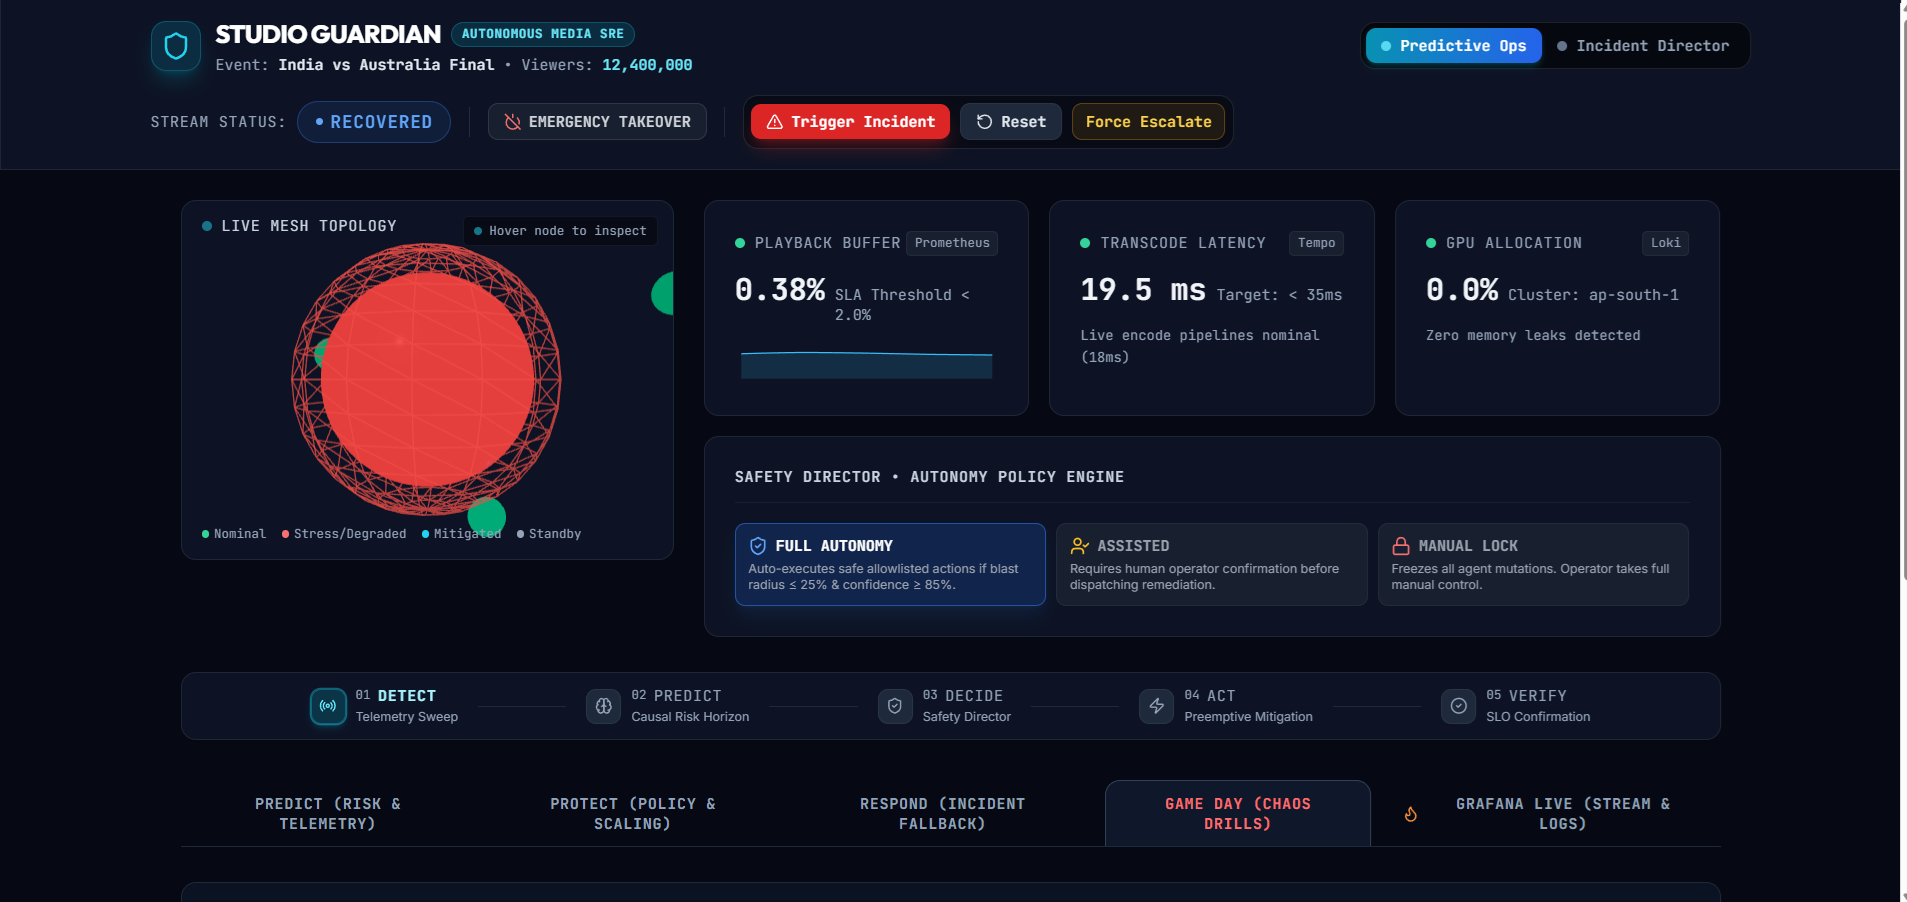
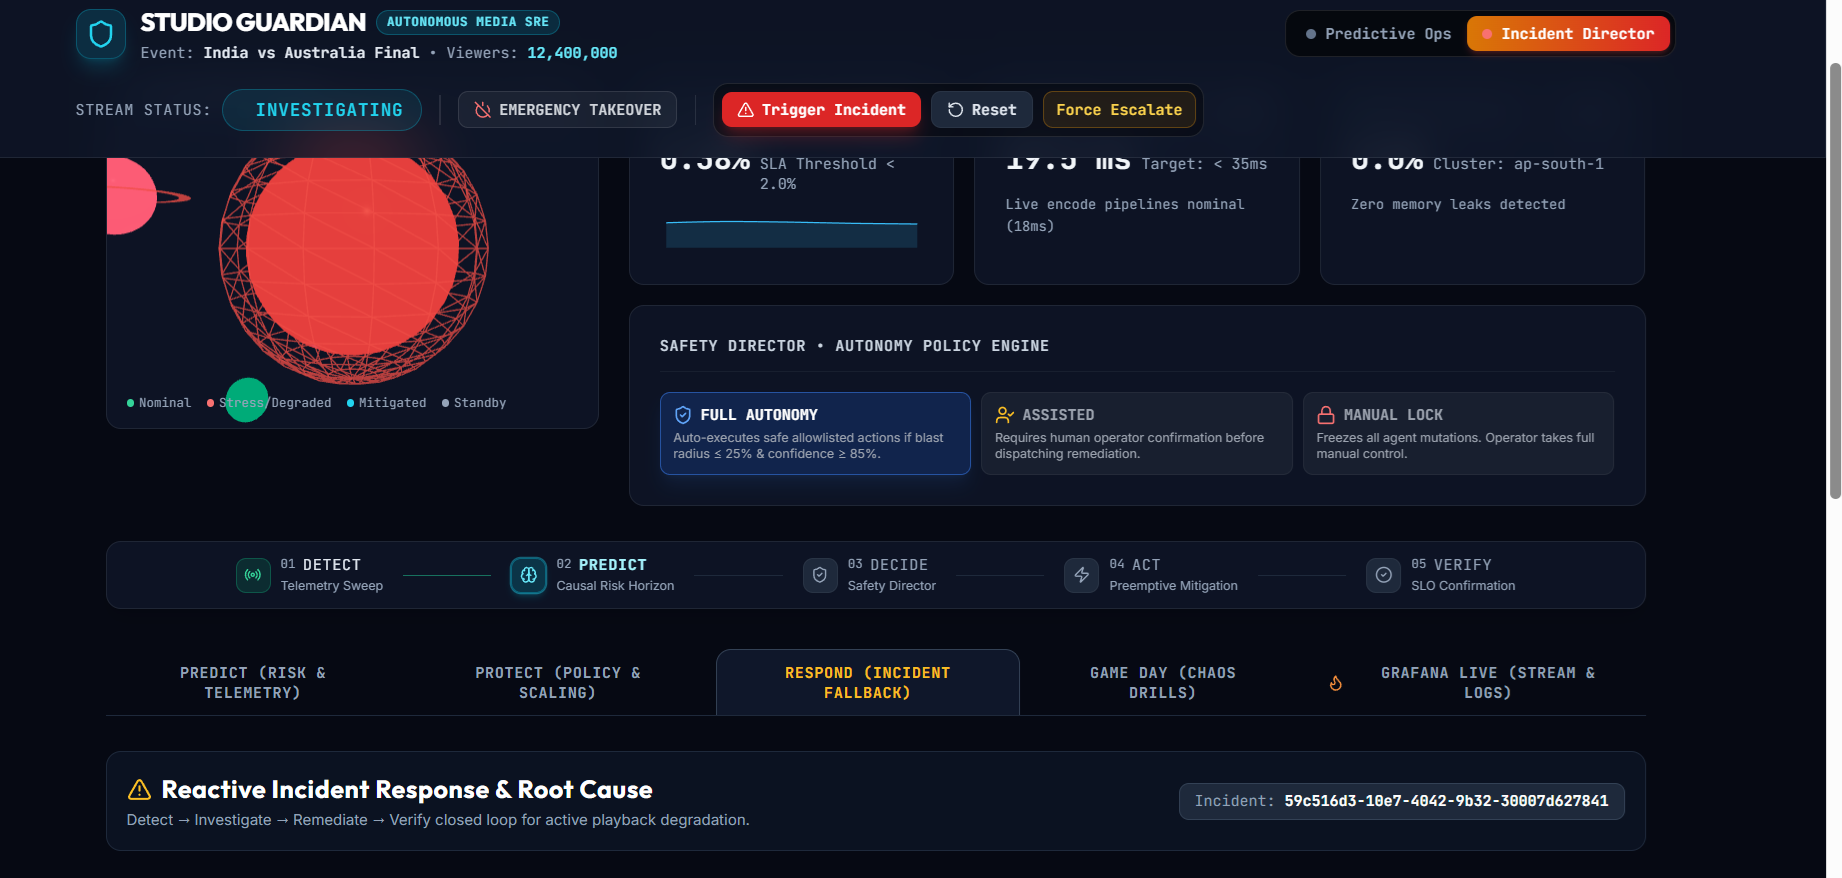
Deterministic Safety Director Every recommendation an agent makes passes through a non-probabilistic gate before it can touch production traffic:
Strict action allowlists An 85% minimum confidence threshold A hard 20% blast-radius ceiling on any traffic shift
Autonomous Remediation with Closed-Loop Verification On detecting risk, Studio Guardian dispatches load-balancing traffic shifts and worker pool scale-outs through live video proxies. A separate Verification Agent then re-queries Grafana Cloud (Prometheus, via MCP) to confirm the fix actually worked — targeting a GPU utilization reduction of ΔGPU ≤ -25% — before the incident is marked resolved. No agent is allowed to grade its own homework.
Cryptographic Mathematical Provenance Every predictive score and remediation decision is bound into a verifiable SHA-256 audit trail, queryable at /api/v1/predictive/provenance — giving enterprise operators a defensible record of exactly what the agent saw, decided, and did.
How we built it
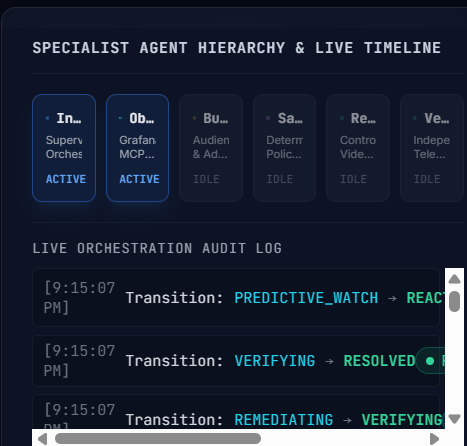
Gemini Enterprise Agent Platform — Orchestration Layer Eight specialized agents run under an Incident Commander supervisor state machine on the Gemini Enterprise Agent Platform, using Gemini 3.6-flash for structured reasoning, multi-signal log correlation, and root-cause diagnosis. The platform's managed agent lifecycle and tool-routing let us keep the reasoning layer strictly separated from the deterministic policy layer — agents propose, the Safety Director disposes.
Grafana Labs Integration — the Agent's Senses An MCP Client Adapter connects every agent directly to Grafana Cloud:
query_prometheus for real-time infrastructure and GPU telemetry query_loki_logs for correlated log evidence during root-cause investigation
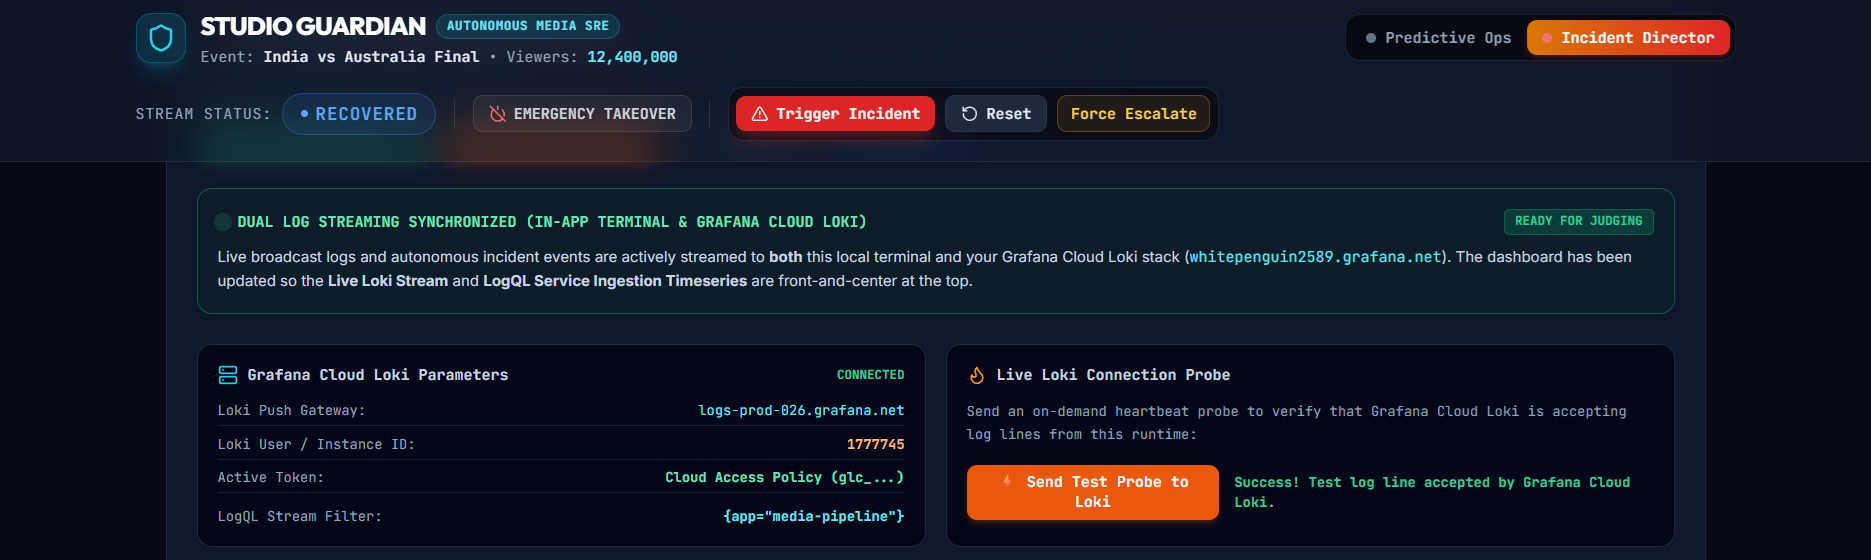
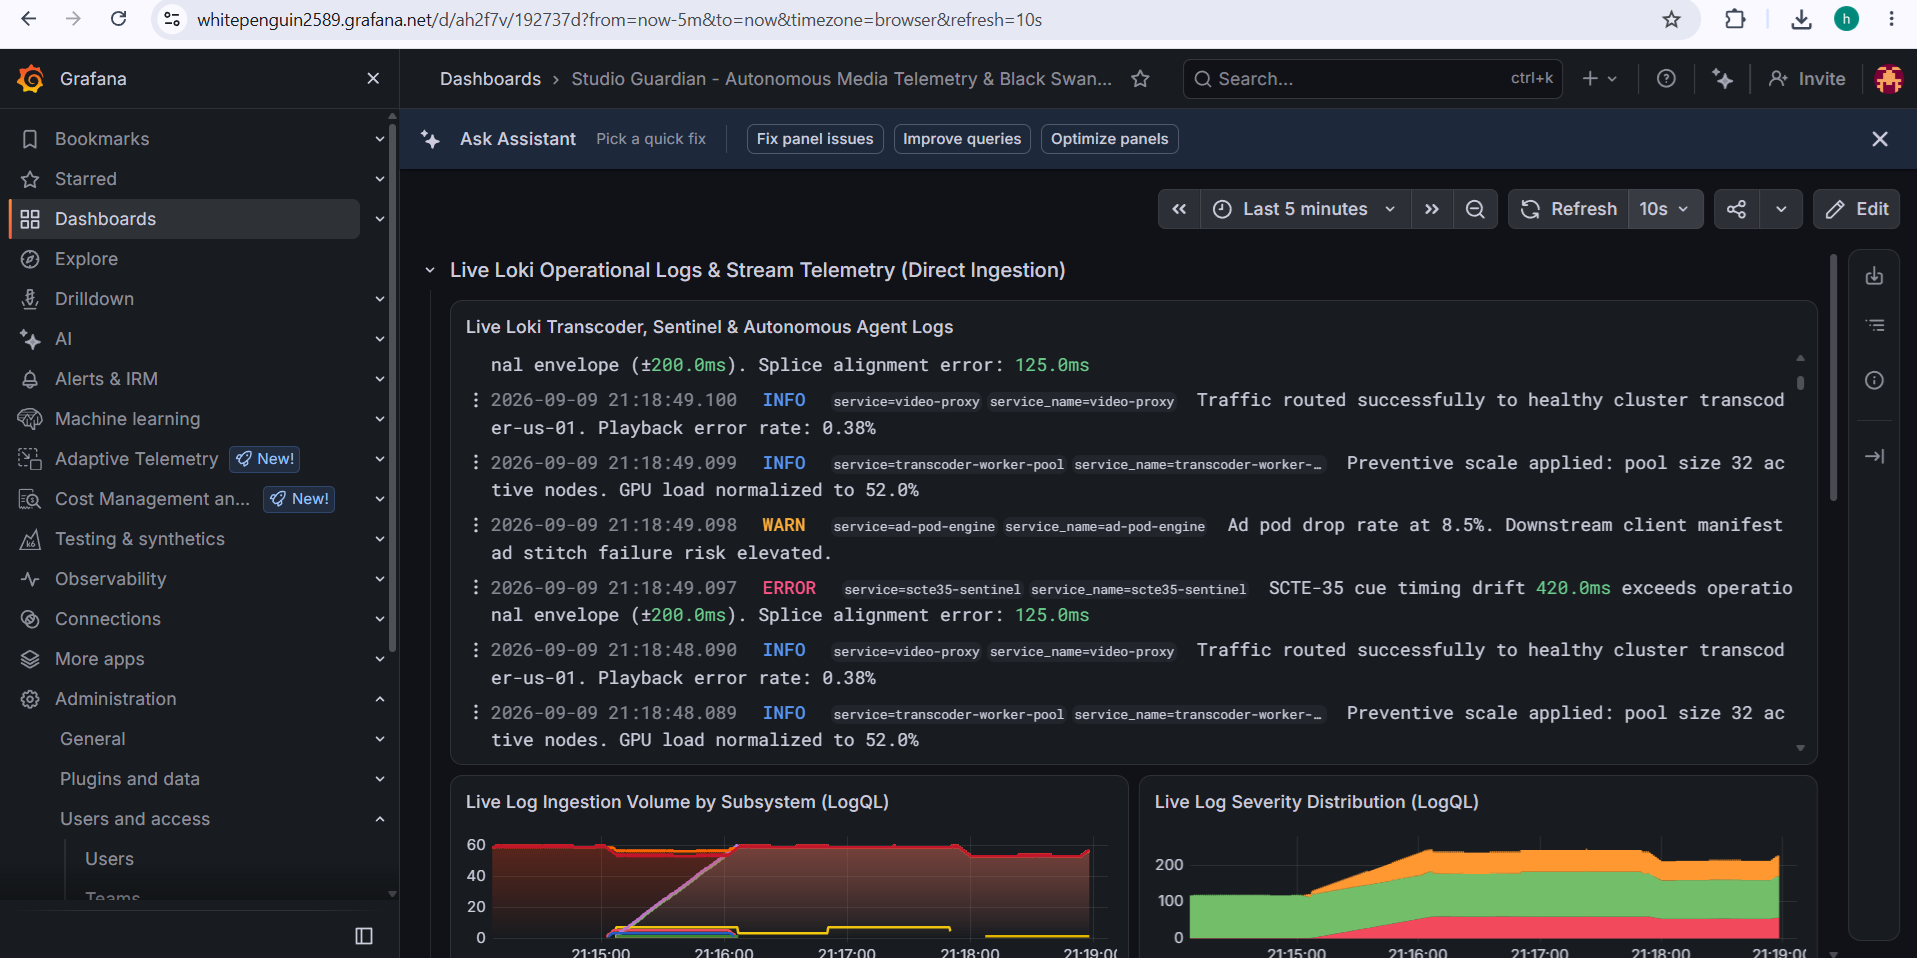
Access is scoped through Grafana Cloud Service Account tokens and Cloud Access Policies, so agents can only read the exact telemetry surface they're authorized for. Instead of streaming raw metrics into the model's context window, agents issue dynamic, time-windowed PromQL/LogQL aggregations through MCP — keeping reasoning fast and grounded in live Grafana data rather than stale snapshots.
Cloud Run — Deployment and Scaling The Incident Commander, the eight specialist agents, the Verification Agent, and the Regional Video Proxy all run as independently scalable Cloud Run services. This lets the Predictive Track run continuously at low cost while the Reactive Track — and the agents it depends on — scale instantly to zero-to-many under real incident load, which is exactly the traffic shape a live broadcast failure produces.
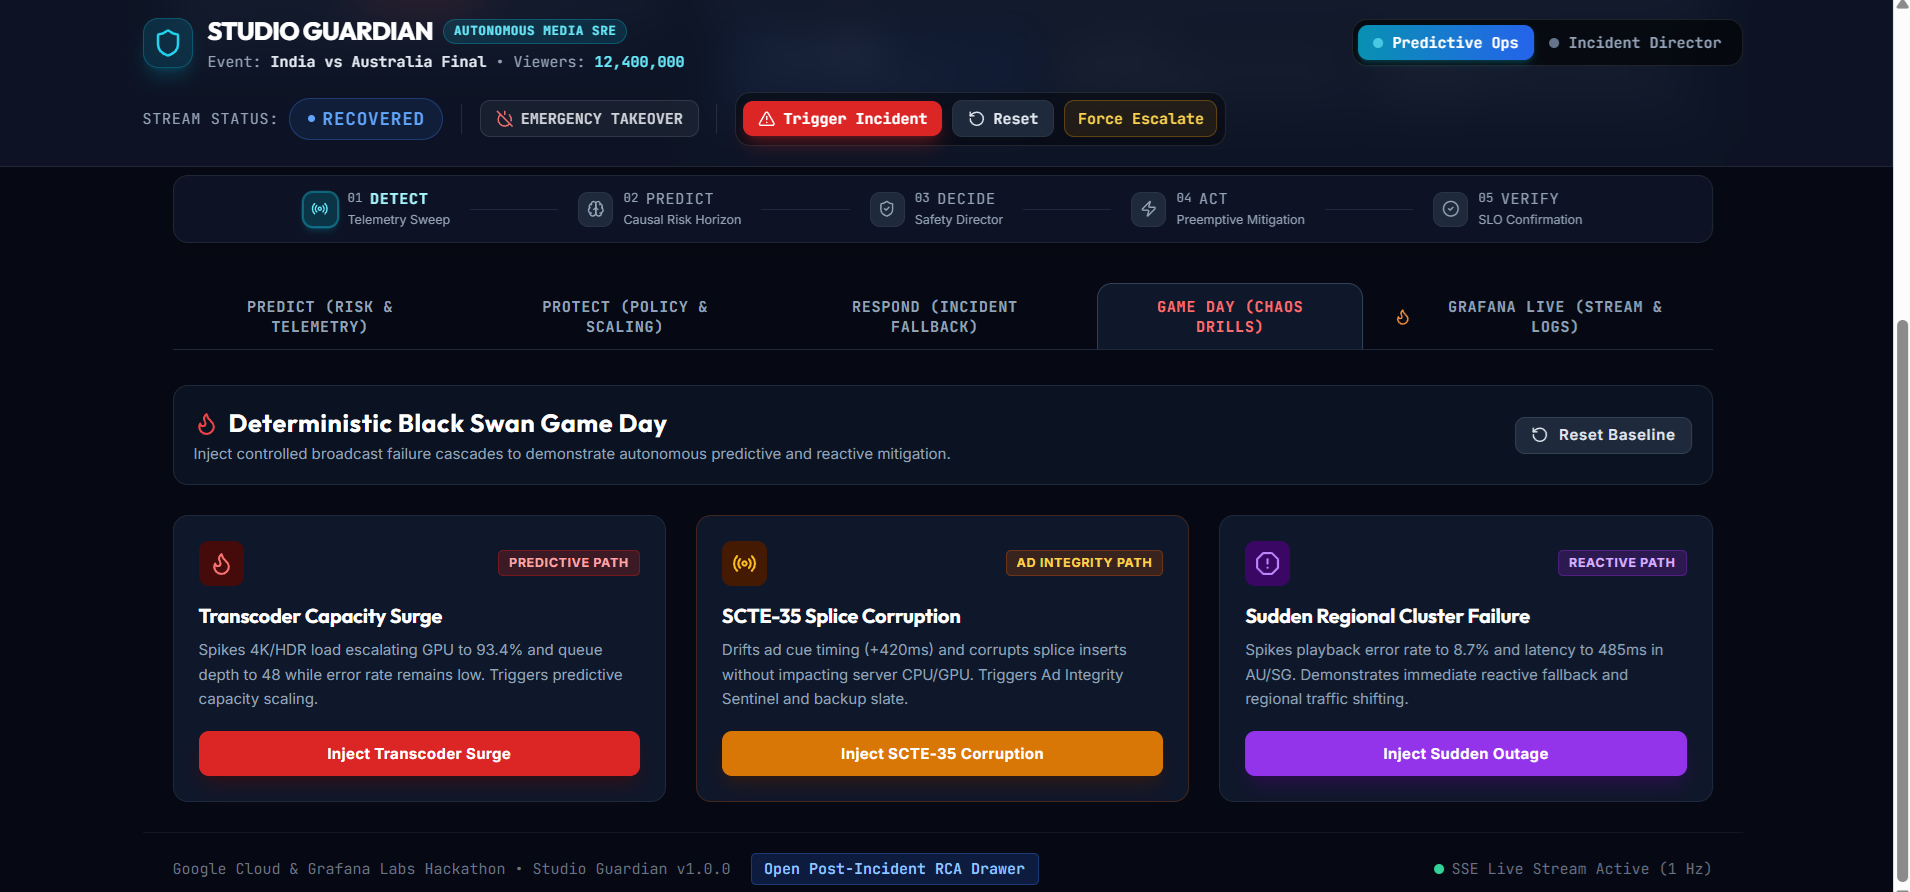
Live Media Simulation Environment A distributed testbed spanning Regional Video Proxy /route traffic control, transcoder clusters across Sydney, Singapore, and US-West, and a Black Swan Chaos Engine that injects SCTE-35 drift, load spikes, and cluster failures — so the agent experiences realistic live-streaming incidents without needing a production broadcast.
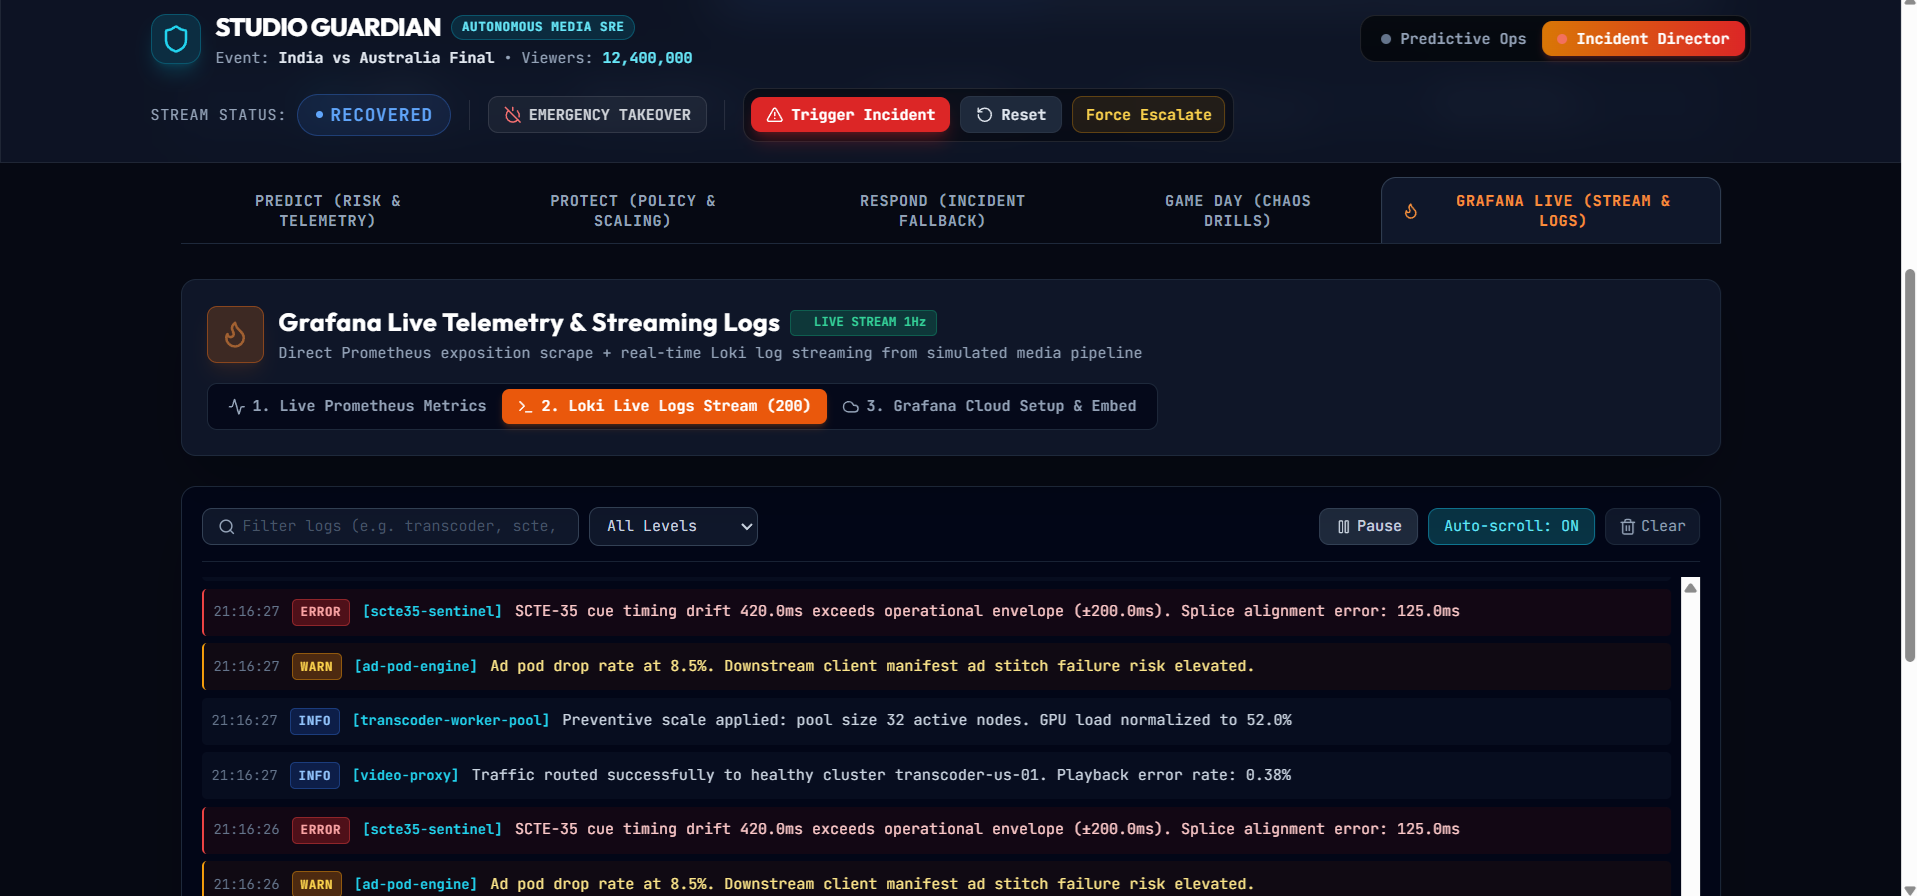
Frontend Command Center A five-view React operational console gives operators real-time visibility: 1 Hz telemetry over Server-Sent Events, in-console Loki log streaming, live Recharts performance visualizations, and live predictive risk / remediation status — all backed by the same Grafana MCP data the agents themselves reason over.
Whats Special about this solution? Deterministic, multi-step, not a chatbot demo. Detect → Predict → Recommend → Gate → Execute → Verify → Audit is a fixed pipeline with a hard safety gate at step 4, not a single LLM call. Real enterprise friction, real dollar amount. SLA penalties and lost ad revenue from broadcast outages are quantifiable, board-level problems — not a toy use case. Grafana is load-bearing, not decorative. Prediction, remediation, and verification all fail closed if the MCP connection to Grafana Cloud goes down — that's how deep the dependency runs. Independent verification closes the loop. The agent that acts is never the agent that certifies success, which is exactly the kind of guardrail enterprise buyers ask for before granting autonomy.
Challenges we ran into
Reconciling Probabilistic AI with Zero-Tolerance Broadcasting — LLMs can hallucinate causes or recommend unsafe actions under pressure. We solved this by hard-separating operational reasoning (Gemini 3.6-flash agents) from deterministic policy enforcement (the Safety Director). Agents investigate and recommend; only the safety-gating engine can authorize execution.
Telemetry Latency vs. Model Context Windows — High-frequency telemetry can quickly overwhelm a model's context. We addressed this with dynamic PromQL/LogQL aggregation tools exposed through MCP, so agents request targeted, time-windowed slices of Grafana data instead of ingesting a raw firehose.
Multi-Agent State Synchronization — The Predictive Risk Agent and Reactive Investigator need to hand off without losing context or double-triggering during sudden traffic surges. We implemented sub-500ms context promotion between the two tracks on the Gemini Enterprise Agent Platform.
Accomplishments that we're proud of
Sub-second reactive fallback — predictive-to-reactive handoff in under 500ms with full hypothesis and context preservation. Closed-loop independent verification — remediations are only marked resolved after the Verification Agent independently re-samples live Grafana telemetry. A mathematical provenance engine — an immutable, SHA-256-bound audit ledger tying every PromQL snapshot to the decision it produced.
What we learned
Autonomous systems in mission-critical environments need guardrailed autonomy: generative reasoning is powerful for investigation and prediction, but deterministic bounding rules are non-negotiable once an agent can touch production infrastructure. We also learned that MCP is the right shape for this problem — it turns Grafana from a passive dashboard into an active operational participant that agents can query, reason over, and be held accountable to.
What's next for Studio Guardian
Deeper Grafana Labs integration — add Tempo trace correlation and Grafana alerting/annotation write-back, so remediation events appear natively in operators' existing Grafana dashboards. Multi-CDN autonomous steering — extend proxy control to dynamically steer traffic across CDNs based on localized ISP peering quality and edge health. Real-time perceptual VMAF evaluation — integrate real-time VMAF scoring into the Perceptual Sentinel agent to catch visual quality degradation that infra metrics alone miss. One-click incident post-mortems — auto-generate executive SLA breach reports, incident timelines, root-cause summaries, and archived Grafana snapshots.

Log in or sign up for Devpost to join the conversation.