-

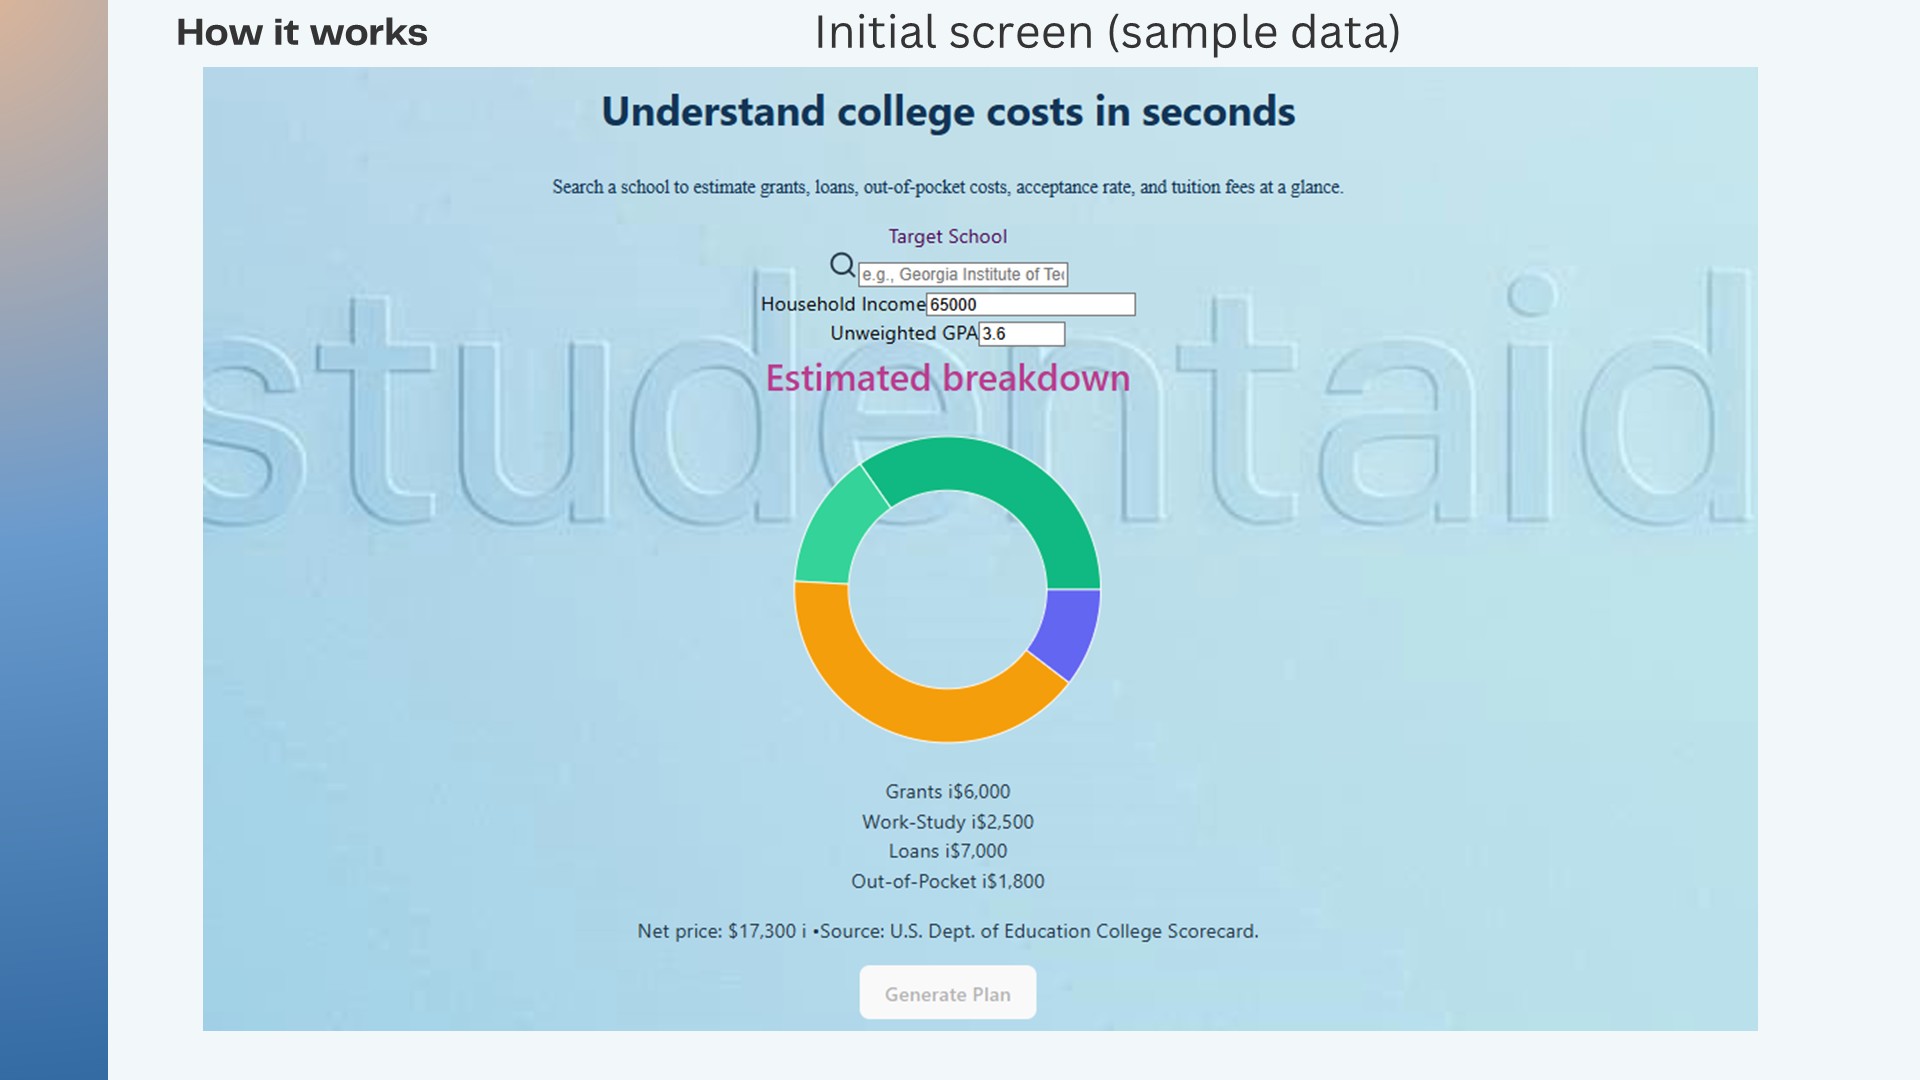
1. Initial Screen
-
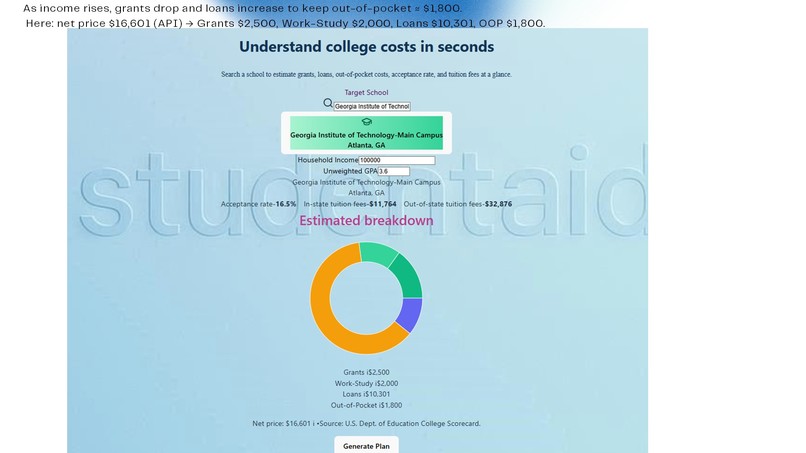
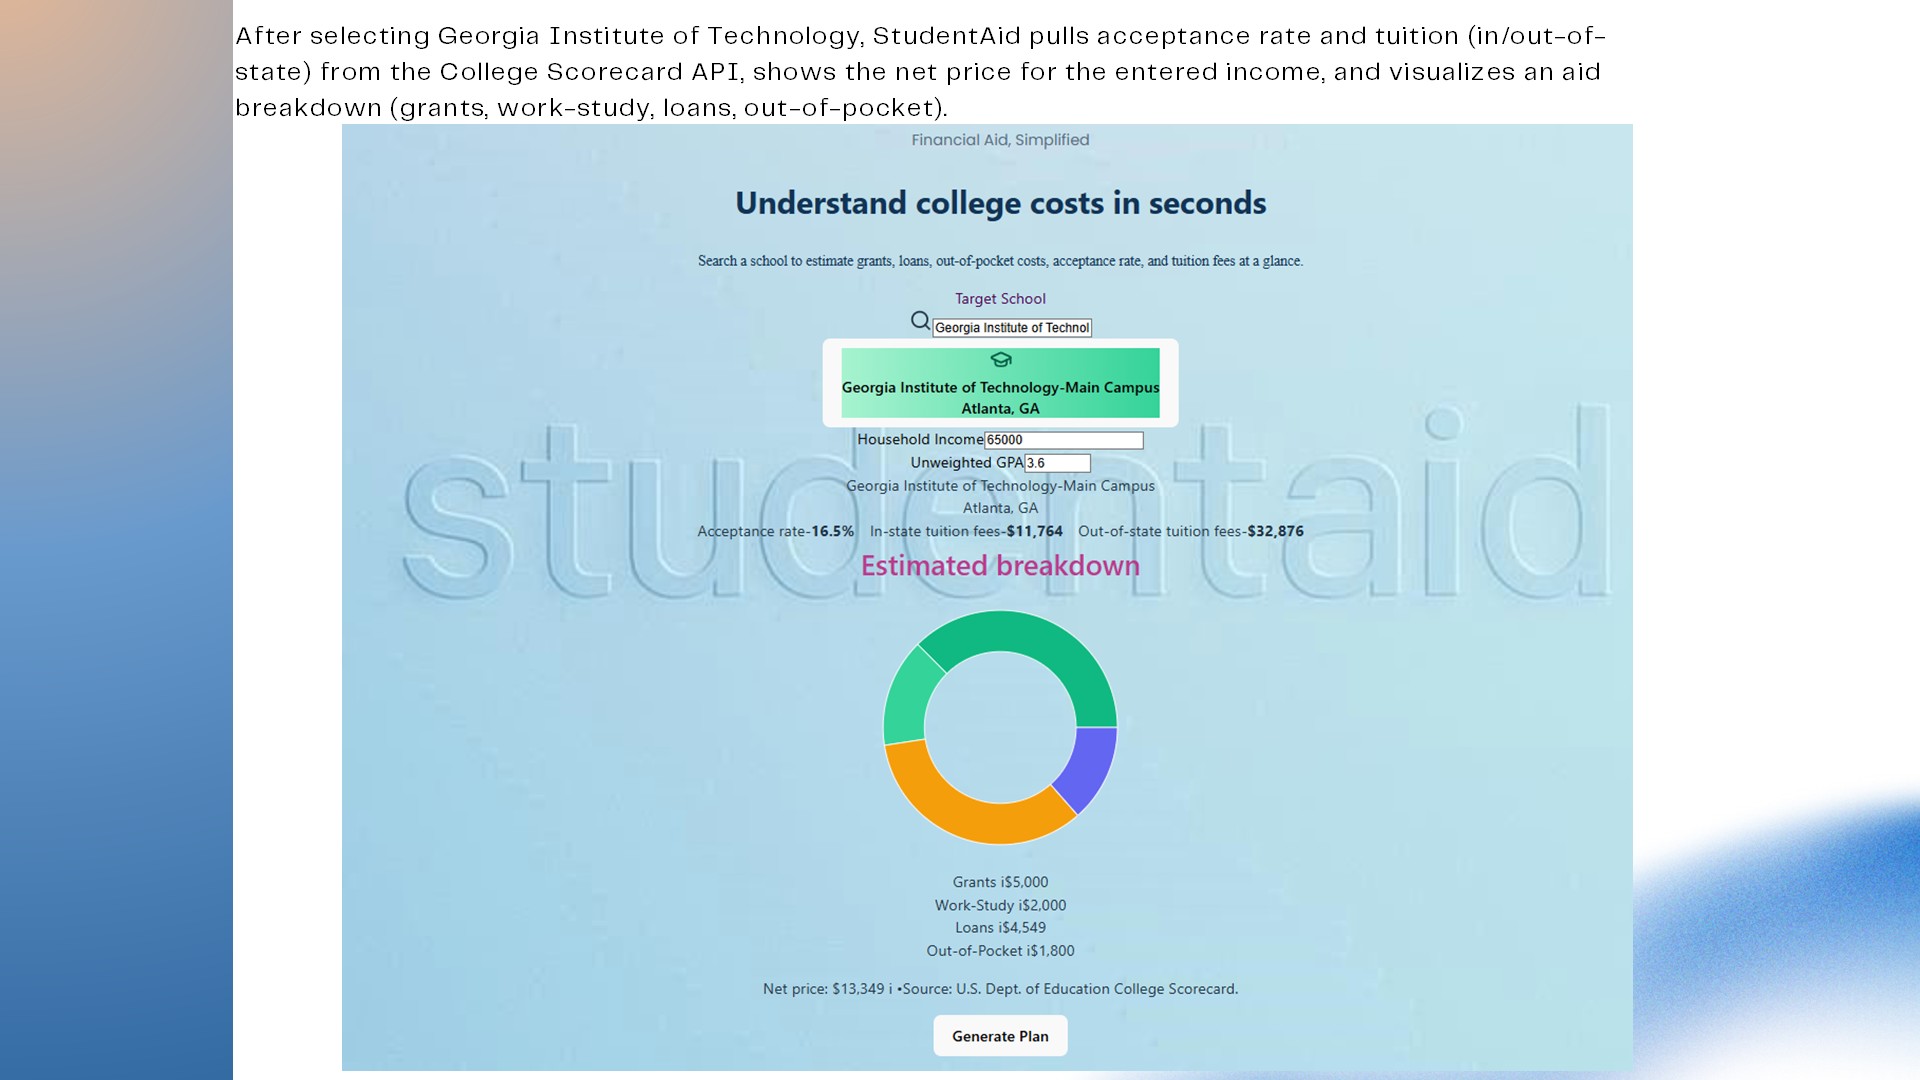
3. Selected School Info
-
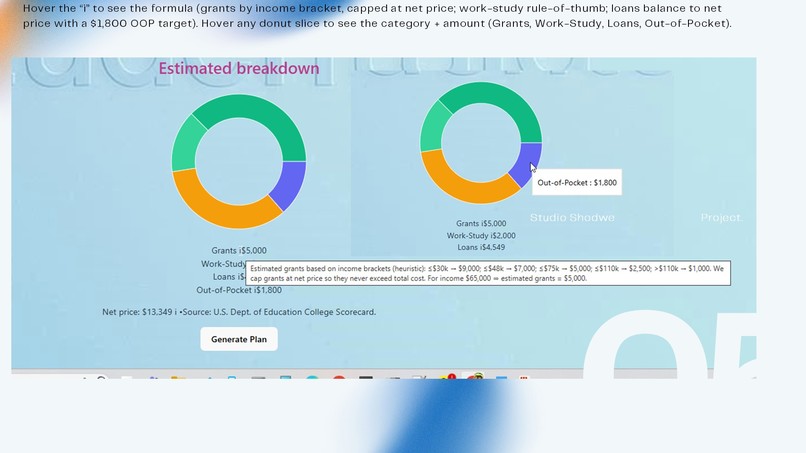
5. Tool tip to understand Donut data
-

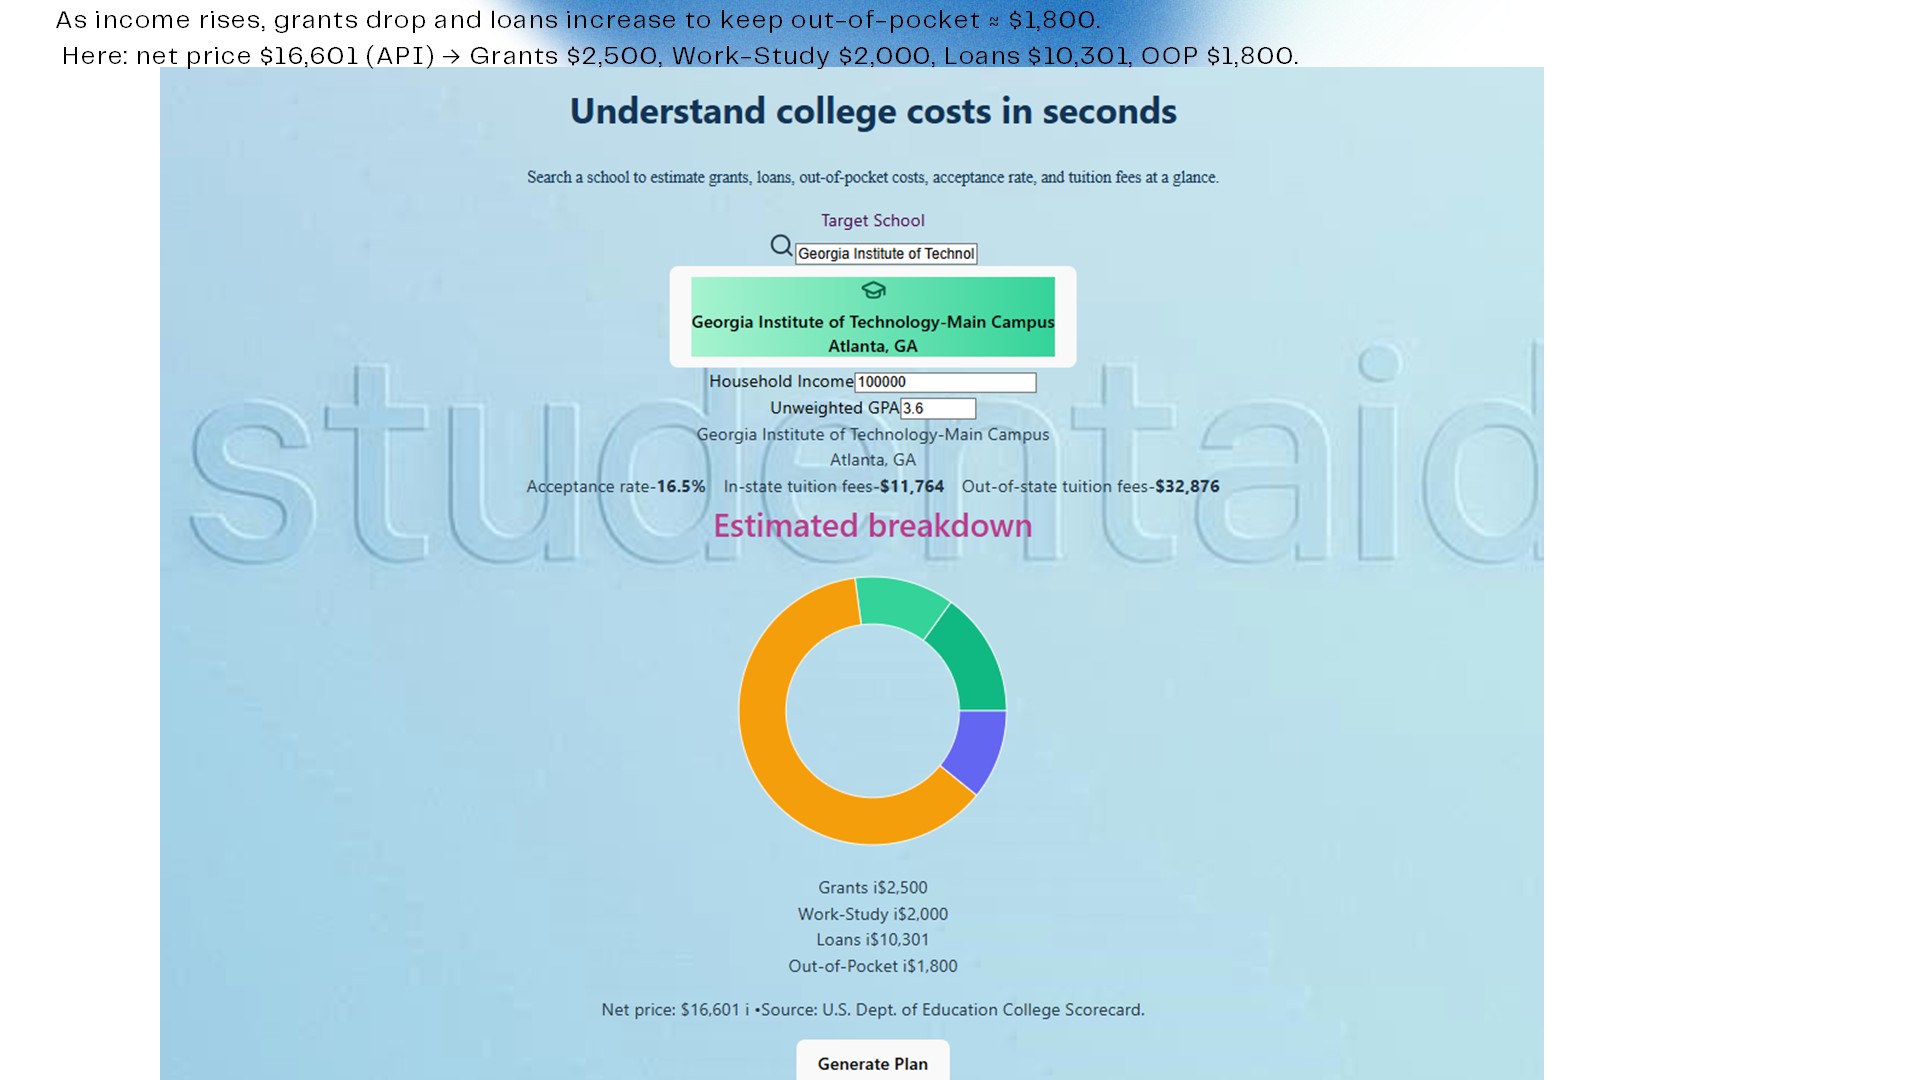
4. Selected School Info with different income
-
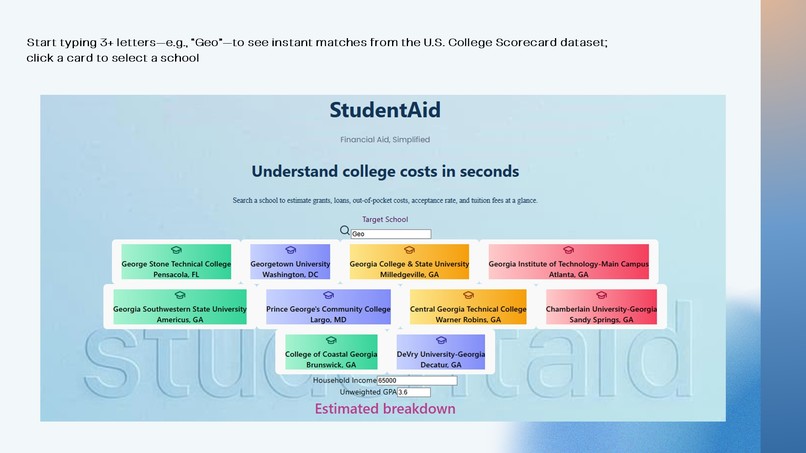
2. Search School


Inspiration
College pricing is confusing—sticker price isn’t what families actually pay. First-gen and low-income students are asked to make life-changing decisions with opaque numbers. We wanted a simple, transparent way to see the real cost in seconds.
What it does
StudentAid lets you search a school and instantly see:
- Net price (from the U.S. Dept. of Education’s College Scorecard API)
- Tuition (in-state & out-of-state)
- Acceptance rate
- A clear donut chart showing grants, work-study, loans, and out-of-pocket
- Tooltips that explain what’s from the API vs. modeled and the formulas used
How we built it
- Frontend: React + TypeScript, Tailwind CSS, Recharts
- Backend: Node.js + Express (with a small in-memory cache)
- Data: College Scorecard API (schools, acceptance, tuition, net price by income bracket)
- Explainability: Inline tooltips so the model isn’t a black box
We request net price by income bracket; if a value is missing, we fall back to tuition so users still get an estimate.
Challenges we ran into
- Data gaps & schema quirks: Some schools don’t report net price for every bracket; Scorecard uses flattened field names.
- Realism vs. clarity: We needed an explainable model within hackathon time, not a full aid calculator.
- UX under time pressure: Getting search, responsive layout, and readable tooltips to feel smooth.
Accomplishments that we’re proud of
- A fast, clean UI that turns confusing costs into a single visual.
- Transparent tooltips so judges/users can see exactly how numbers are computed.
- Graceful fallbacks so the app stays useful even when an API field is missing.
What we learned
- Open data is powerful—and messy. Good fallbacks matter.
- Trust = clarity. Showing formulas and sources increases confidence.
- Small UX details (search-as-you-type, tabular numbers, tooltips) make complex info understandable.
What’s next for StudentAid: College Cost & Aid Estimator
- FAFSA/StudentAid.gov integration (real award letters)
- Program-level outcomes (earnings, completion) to pair cost with value
- Scholarship suggestions & Pell eligibility hints
- Multi-school compare view and export/share (PDF)
- Accessibility/i18n and mobile PWA
The (simple) math we show to users
Let (N)=net price, (G)=grants, (W)=work-study, (L)=loans, and (C=\$1800).
$$ \begin{aligned} G &= \min{G^*(I),\, N},\quad G^*(I)= \begin{cases} 9000 & I \le 30000\ 7000 & 30001 \le I \le 48000\ 5000 & 48001 \le I \le 75000\ 2500 & 75001 \le I \le 110000\ 1000 & I \ge 110001 \end{cases} \end{aligned} $$
$$ W= \begin{cases} 2000 & I \le 110000\ 1500 & I > 110000 \end{cases} $$
$$ L=\max{0,\, N-G-W-C},\quad C=1800 $$
$$ \mathrm{OOP}=\max{0,\, N-G-W-L} $$
Built With
- college-scorecard-api-(u.s.-dept.-of-education)
- css3
- express.js
- fetch-api-/-node-fetch
- git
- html5
- node.js
- react
- recharts
- tailwind-css
- typescript
- vite


Log in or sign up for Devpost to join the conversation.