-
-
mental heaalth self assesment tool
Inspiration
University life can be overwhelming. Many students silently struggle with stress, anxiety, and academic pressure without fully understanding their mental health condition.
After analyzing a real-world student mental health dataset, I realized there was an opportunity to go beyond simple data visualization and create something practical — a tool students could actually use.
This project was inspired by the idea of combining data analytics with a real-time self-assessment system to help students better understand and manage their stress levels.
What it does
This project is a web-based mental health assessment application designed for students.
It has two main components:
📊 Data Analytics Dashboard
- Visualizes trends in depression, anxiety, panic attacks, and CGPA
- Explores relationships between academic performance and mental health
- Visualizes trends in depression, anxiety, panic attacks, and CGPA
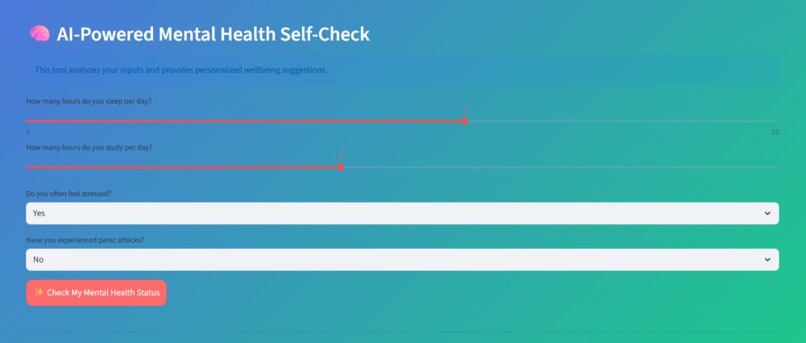
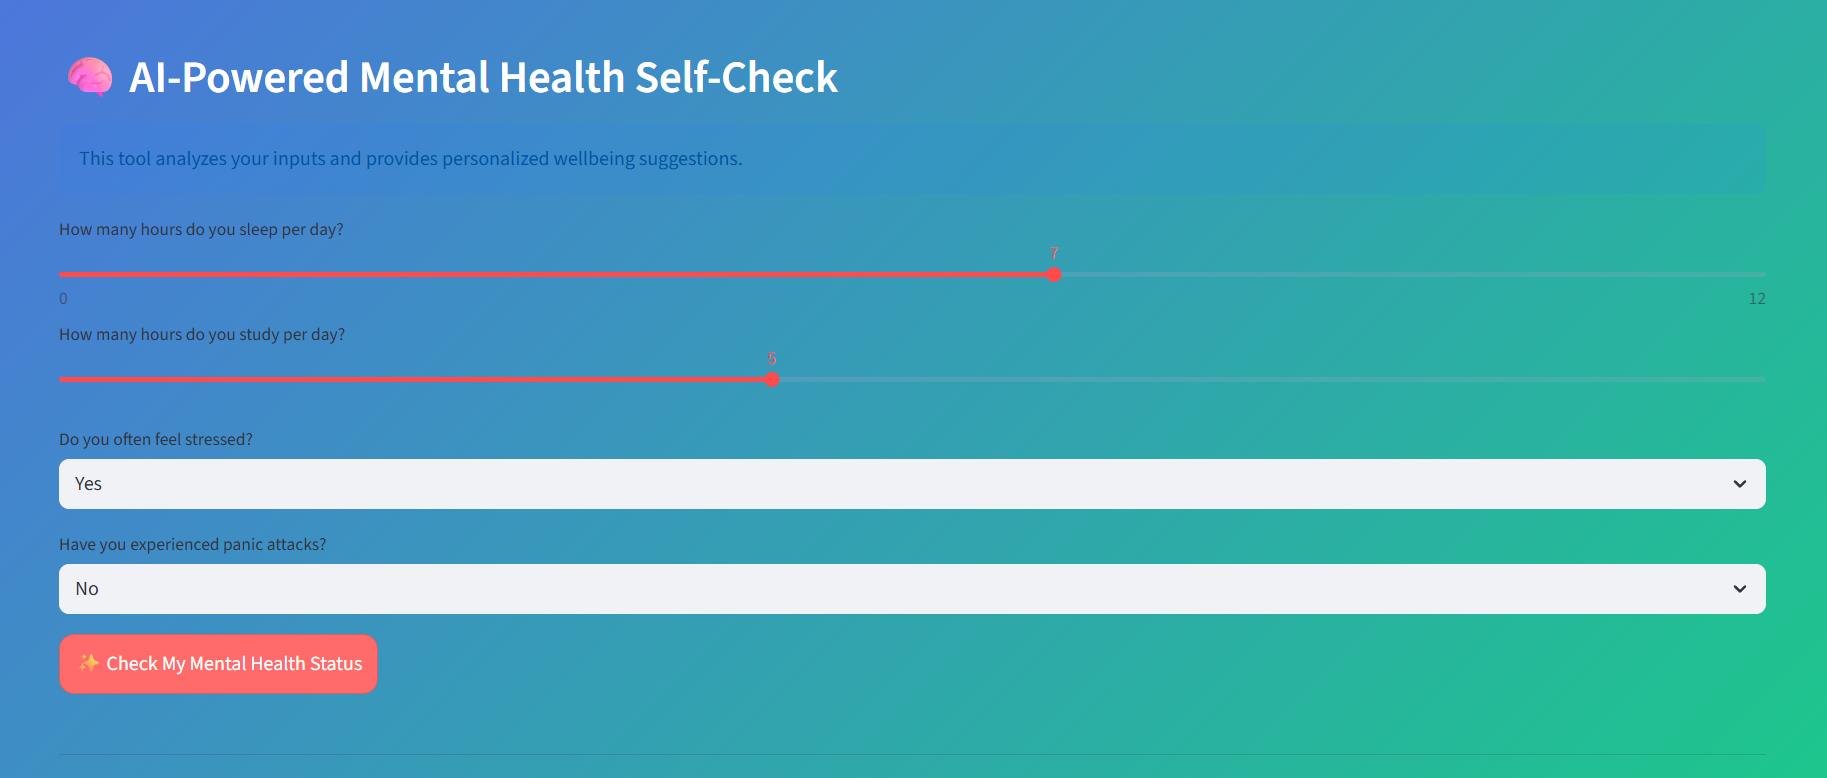
🧠 Self-Assessment Tool
- Allows students to answer simple lifestyle and stress-related questions
- Calculates a stress risk score
- Displays a visual pie chart representation
- Provides personalized well-being recommendations
- Allows students to answer simple lifestyle and stress-related questions
The goal is not to replace professional help, but to provide awareness and early self-reflection.
How I built it
The project was developed using:
- Python
- Streamlit for building the interactive web app
- Pandas for data analysis
- Matplotlib for visualizations
The dataset was cleaned and analyzed to extract meaningful insights.
Then, I designed a simple stress scoring logic system:
- Poor sleep increases risk
- Excessive study hours increase risk
- Reported stress and panic attacks increase risk
The total score determines whether a student falls into Low, Moderate, or High stress category.
Challenges we ran into
- Learning how to convert data analysis into a usable application
- Understanding how to deploy and structure a Streamlit app
- Designing a scoring logic that is simple but meaningful
- Making the interface user-friendly and intuitive
This project helped me understand how data science can move from analysis to real-world application.
What I've learned
- How to build and structure a complete web application
- How to integrate data analytics with user interaction
- How to transform raw datasets into actionable insights
- The importance of designing technology with empathy
What's next for Student Wellbeing Self-Assessment Tool
- Add AI-based recommendation engine
- Deploy the application publicly
- Add anonymous result tracking for research insights
- Integrate chatbot-style mental health assistant
- Improve UI/UX design for better engagement

Log in or sign up for Devpost to join the conversation.