-
-
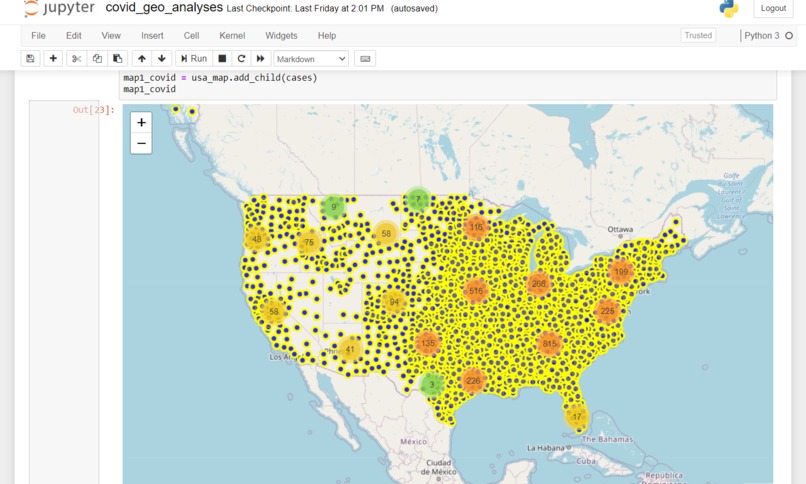
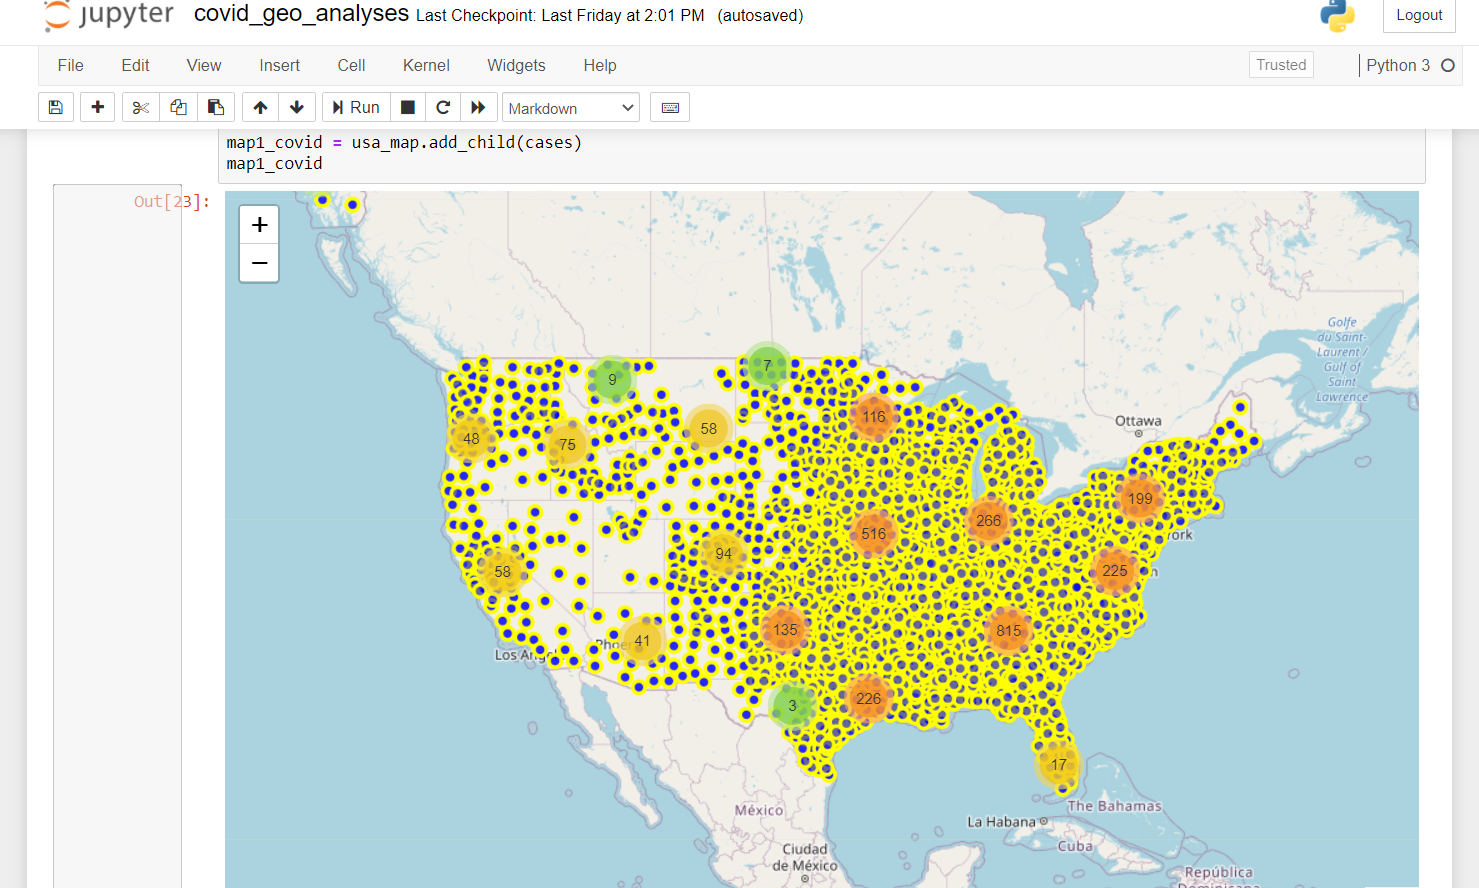
Tis is a screen-short of the visual analysis.
Inspiration
With the covid-9 outbreak, it has been difficult for people to view the number of cases across the region. So here is an analysis that Visually represents the cases.
What it does
This data-set is dated 21/05/2020 and the analysis was also done on this date. This is a type of geospatial analysis where I have used folium library to plot that data onto the usa map.
How we built it
Using Folium library and pandas.
Challenges we ran into
merging the dataset with the map.
Accomplishments that we're proud of
I was able to build an interactive map
What we learned
I learned how to use folium library, although it's a very simple project, I recommend checking it.
What's next for Covid-19-analysis
Creating a proper Dashboard for it and updating it regulary.

Log in or sign up for Devpost to join the conversation.