Inspiration
Inspiration
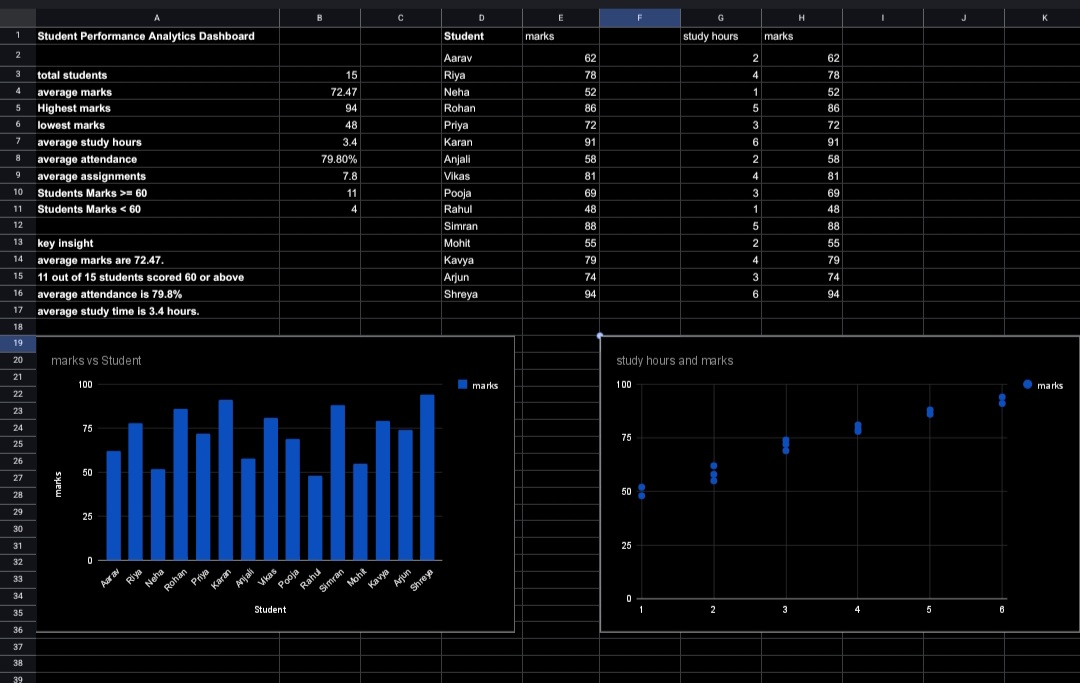
Students often have difficulty understanding their academic performance from marks alone. I wanted to create a simple dashboard that turns student marks into useful and easy-to-understand insights.
What I learned
I learned how to organize student data, calculate basic statistics, and present information through charts and a dashboard.
How we built it
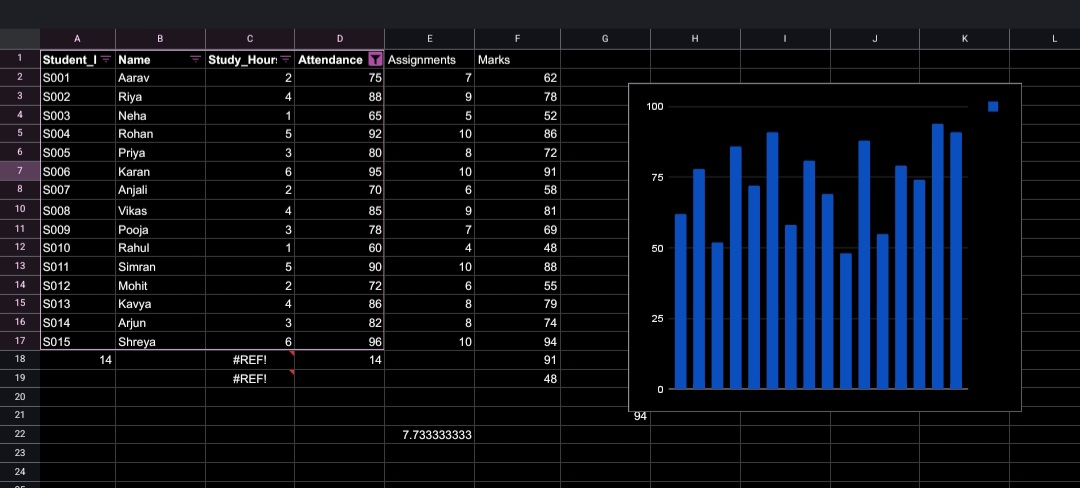
I created a student performance dataset containing study hours, attendance, assignments, and marks. I analyzed the data using Google Sheets and created a dashboard with statistics and visualizations.
Challenges
The main challenge was organizing the data and presenting it in a simple way that students can easily understand.
What it does
How we built it
Challenges we ran into
Accomplishments that we're proud of
What we learned
What's next for Student Performance Analytics Dashboard
Built With
- analysis
- data
- sheets

Log in or sign up for Devpost to join the conversation.