Inspiration
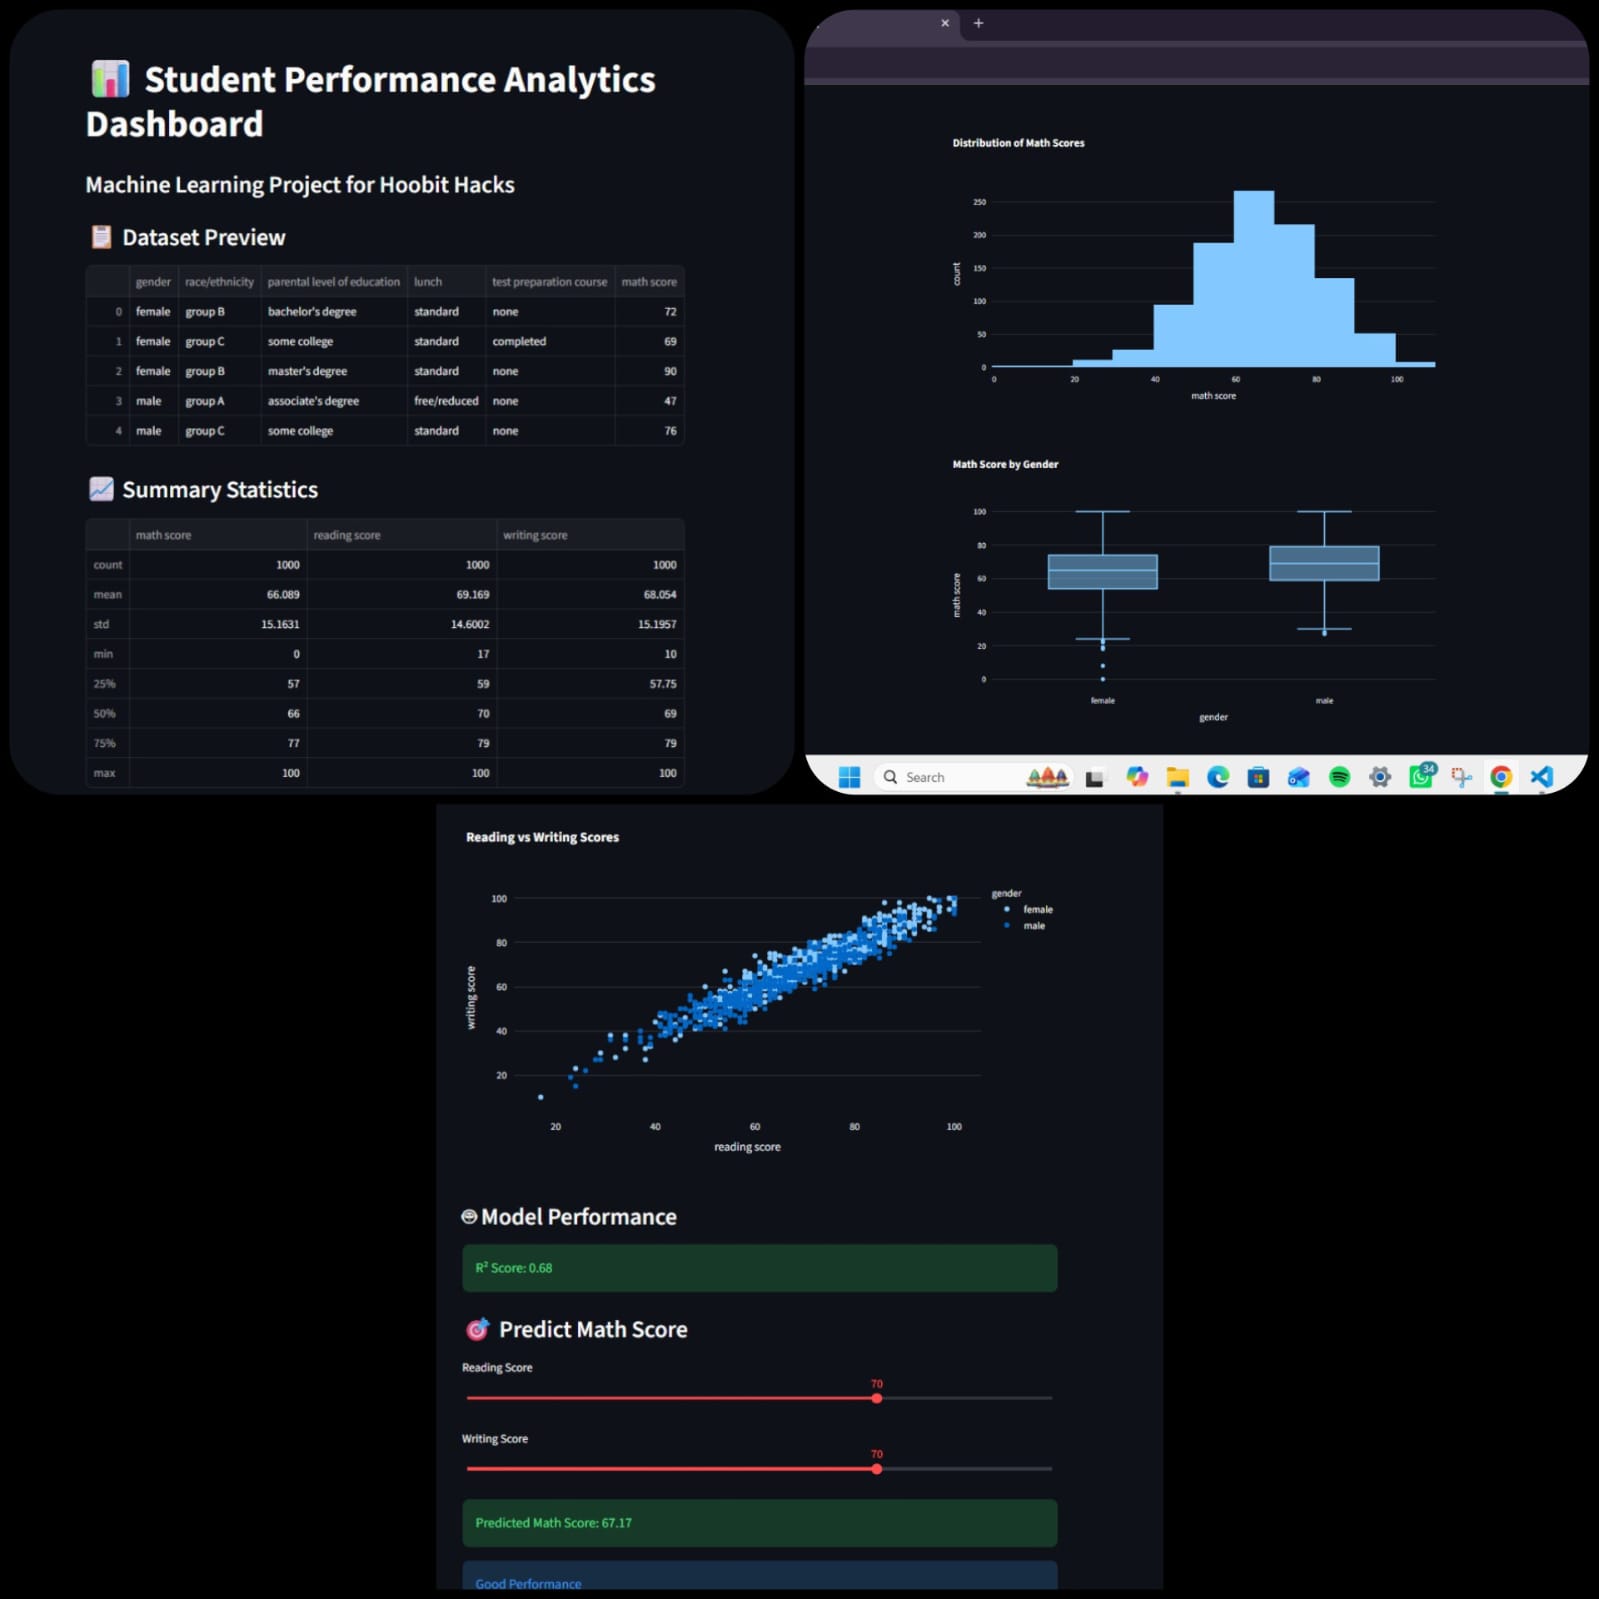
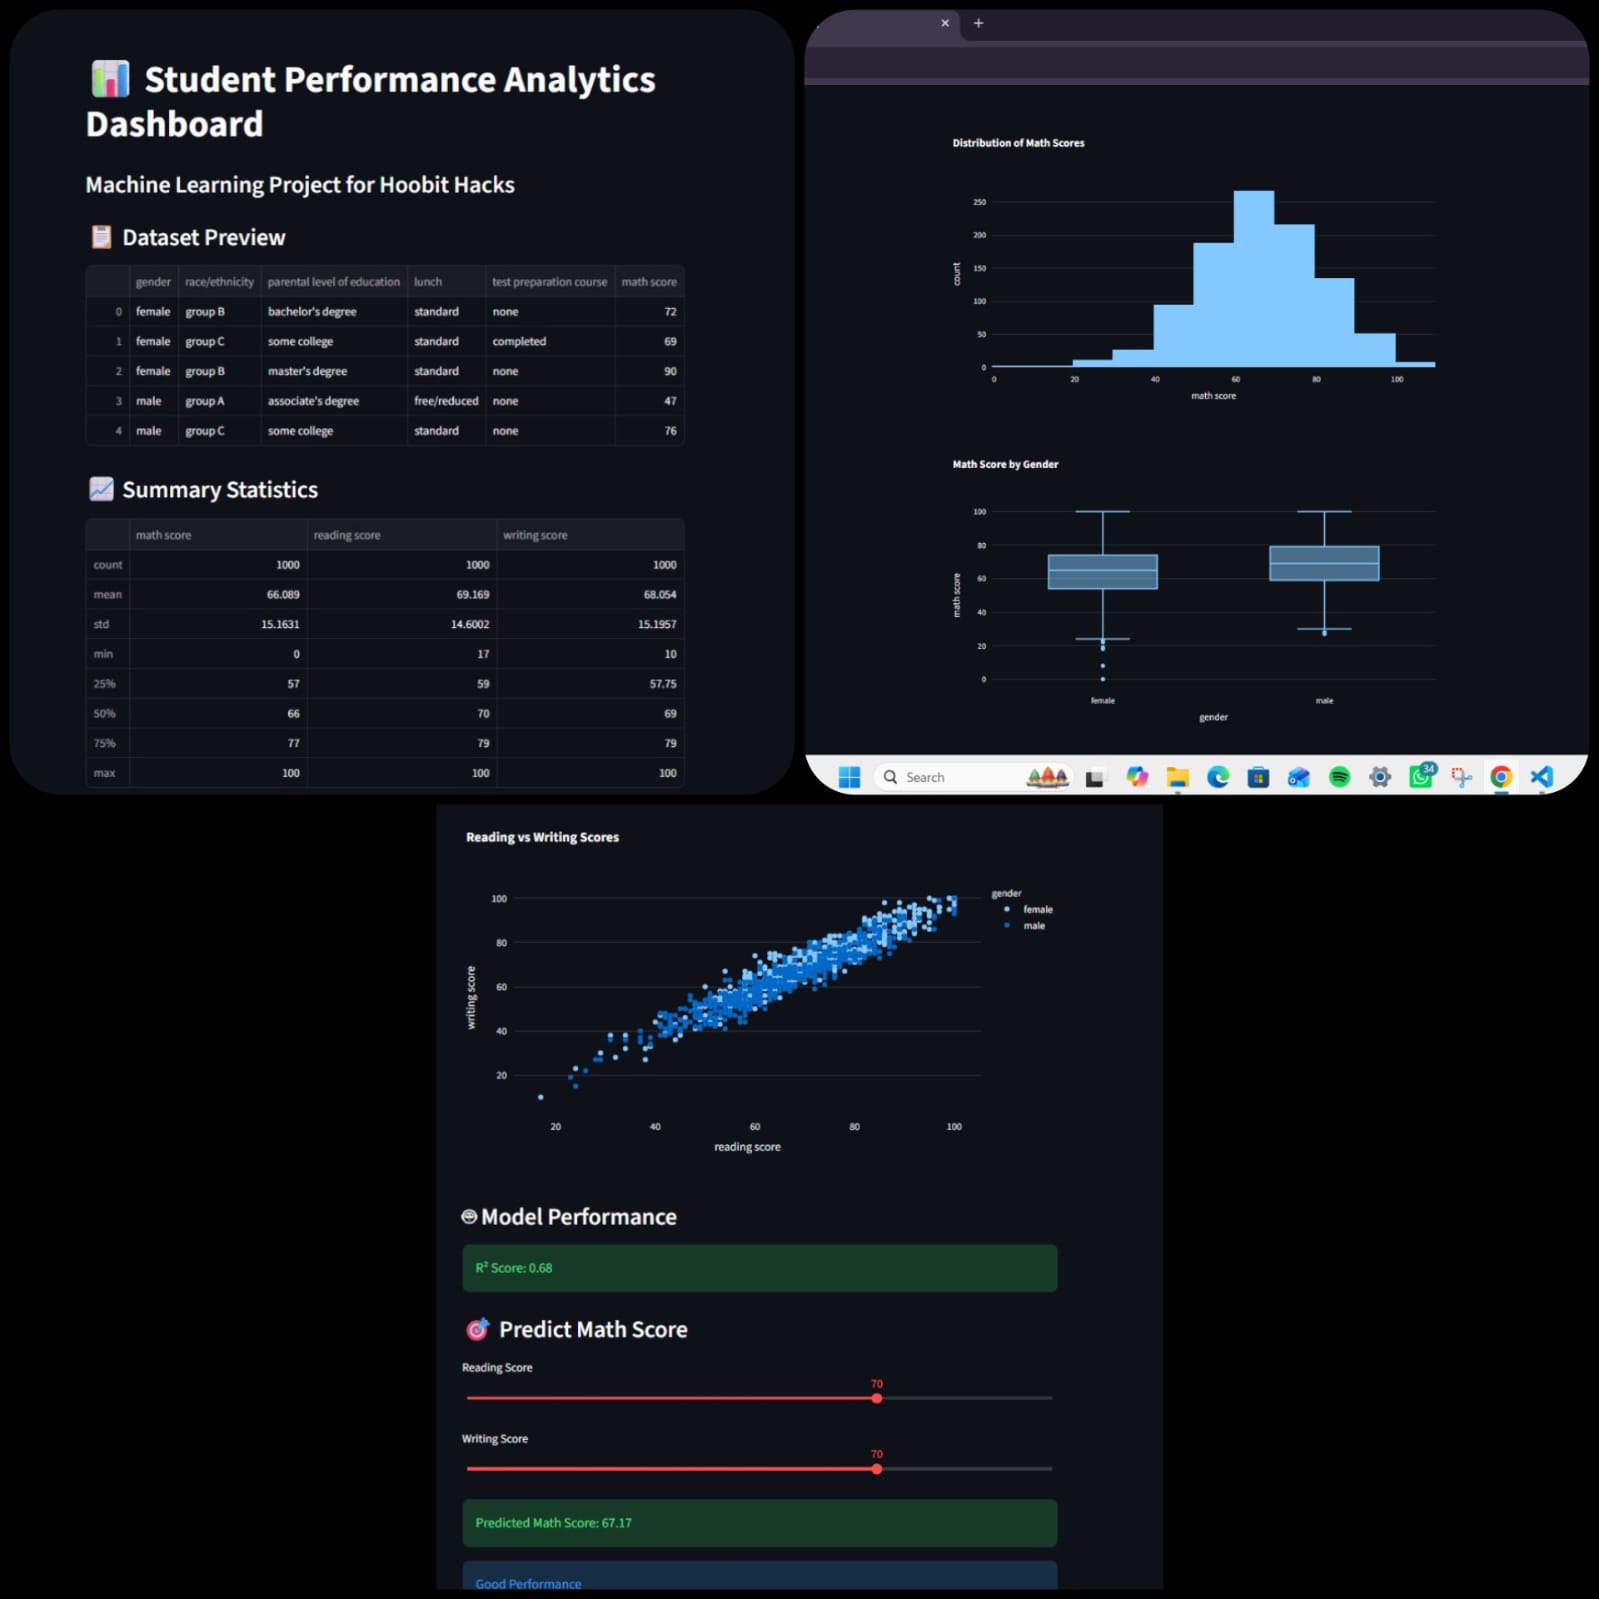
Our project analyzes student academic data to identify performance trends, attendance patterns, and subject-wise strengths. The dashboard provides visual insights and simple machine learning predictions to help improve student outcomes.
What it does
The Student Performance Analytics Dashboard analyzes student marks, attendance, and subject-wise performance. It provides visual insights through charts and predicts whether a student is likely to pass or fail using a machine learning model.
How we built it
We used Python for data processing, Pandas for data analysis, Matplotlib for visualization, and Scikit-learn for building a simple prediction model. The project was developed collaboratively by our team using GitHub.
Challenges we ran into
Handling missing values, cleaning inconsistent data, and selecting the right features for prediction were the main challenges during development.
Accomplishments that we're proud of
We successfully created an easy-to-understand analytics dashboard and implemented a basic machine learning prediction system that can assist in identifying student performance patterns.
What we learned
Through this project, we learned practical data cleaning techniques, data visualization methods, teamwork using GitHub, and the basics of machine learning model development.
What's next for Student Performance Analytics Dashboard
We plan to add real-time data updates, interactive dashboards, personalized recommendations for students, and more advanced prediction models in future versions.
Built With
- github
- matplotlib
- pandas
- python
- scikit-learn
