-
-
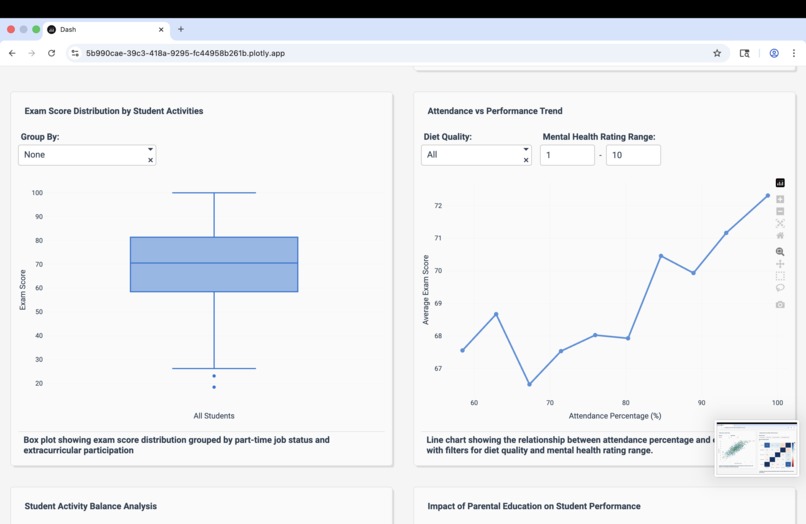
Box plot grouped on certain features and a line chart
-

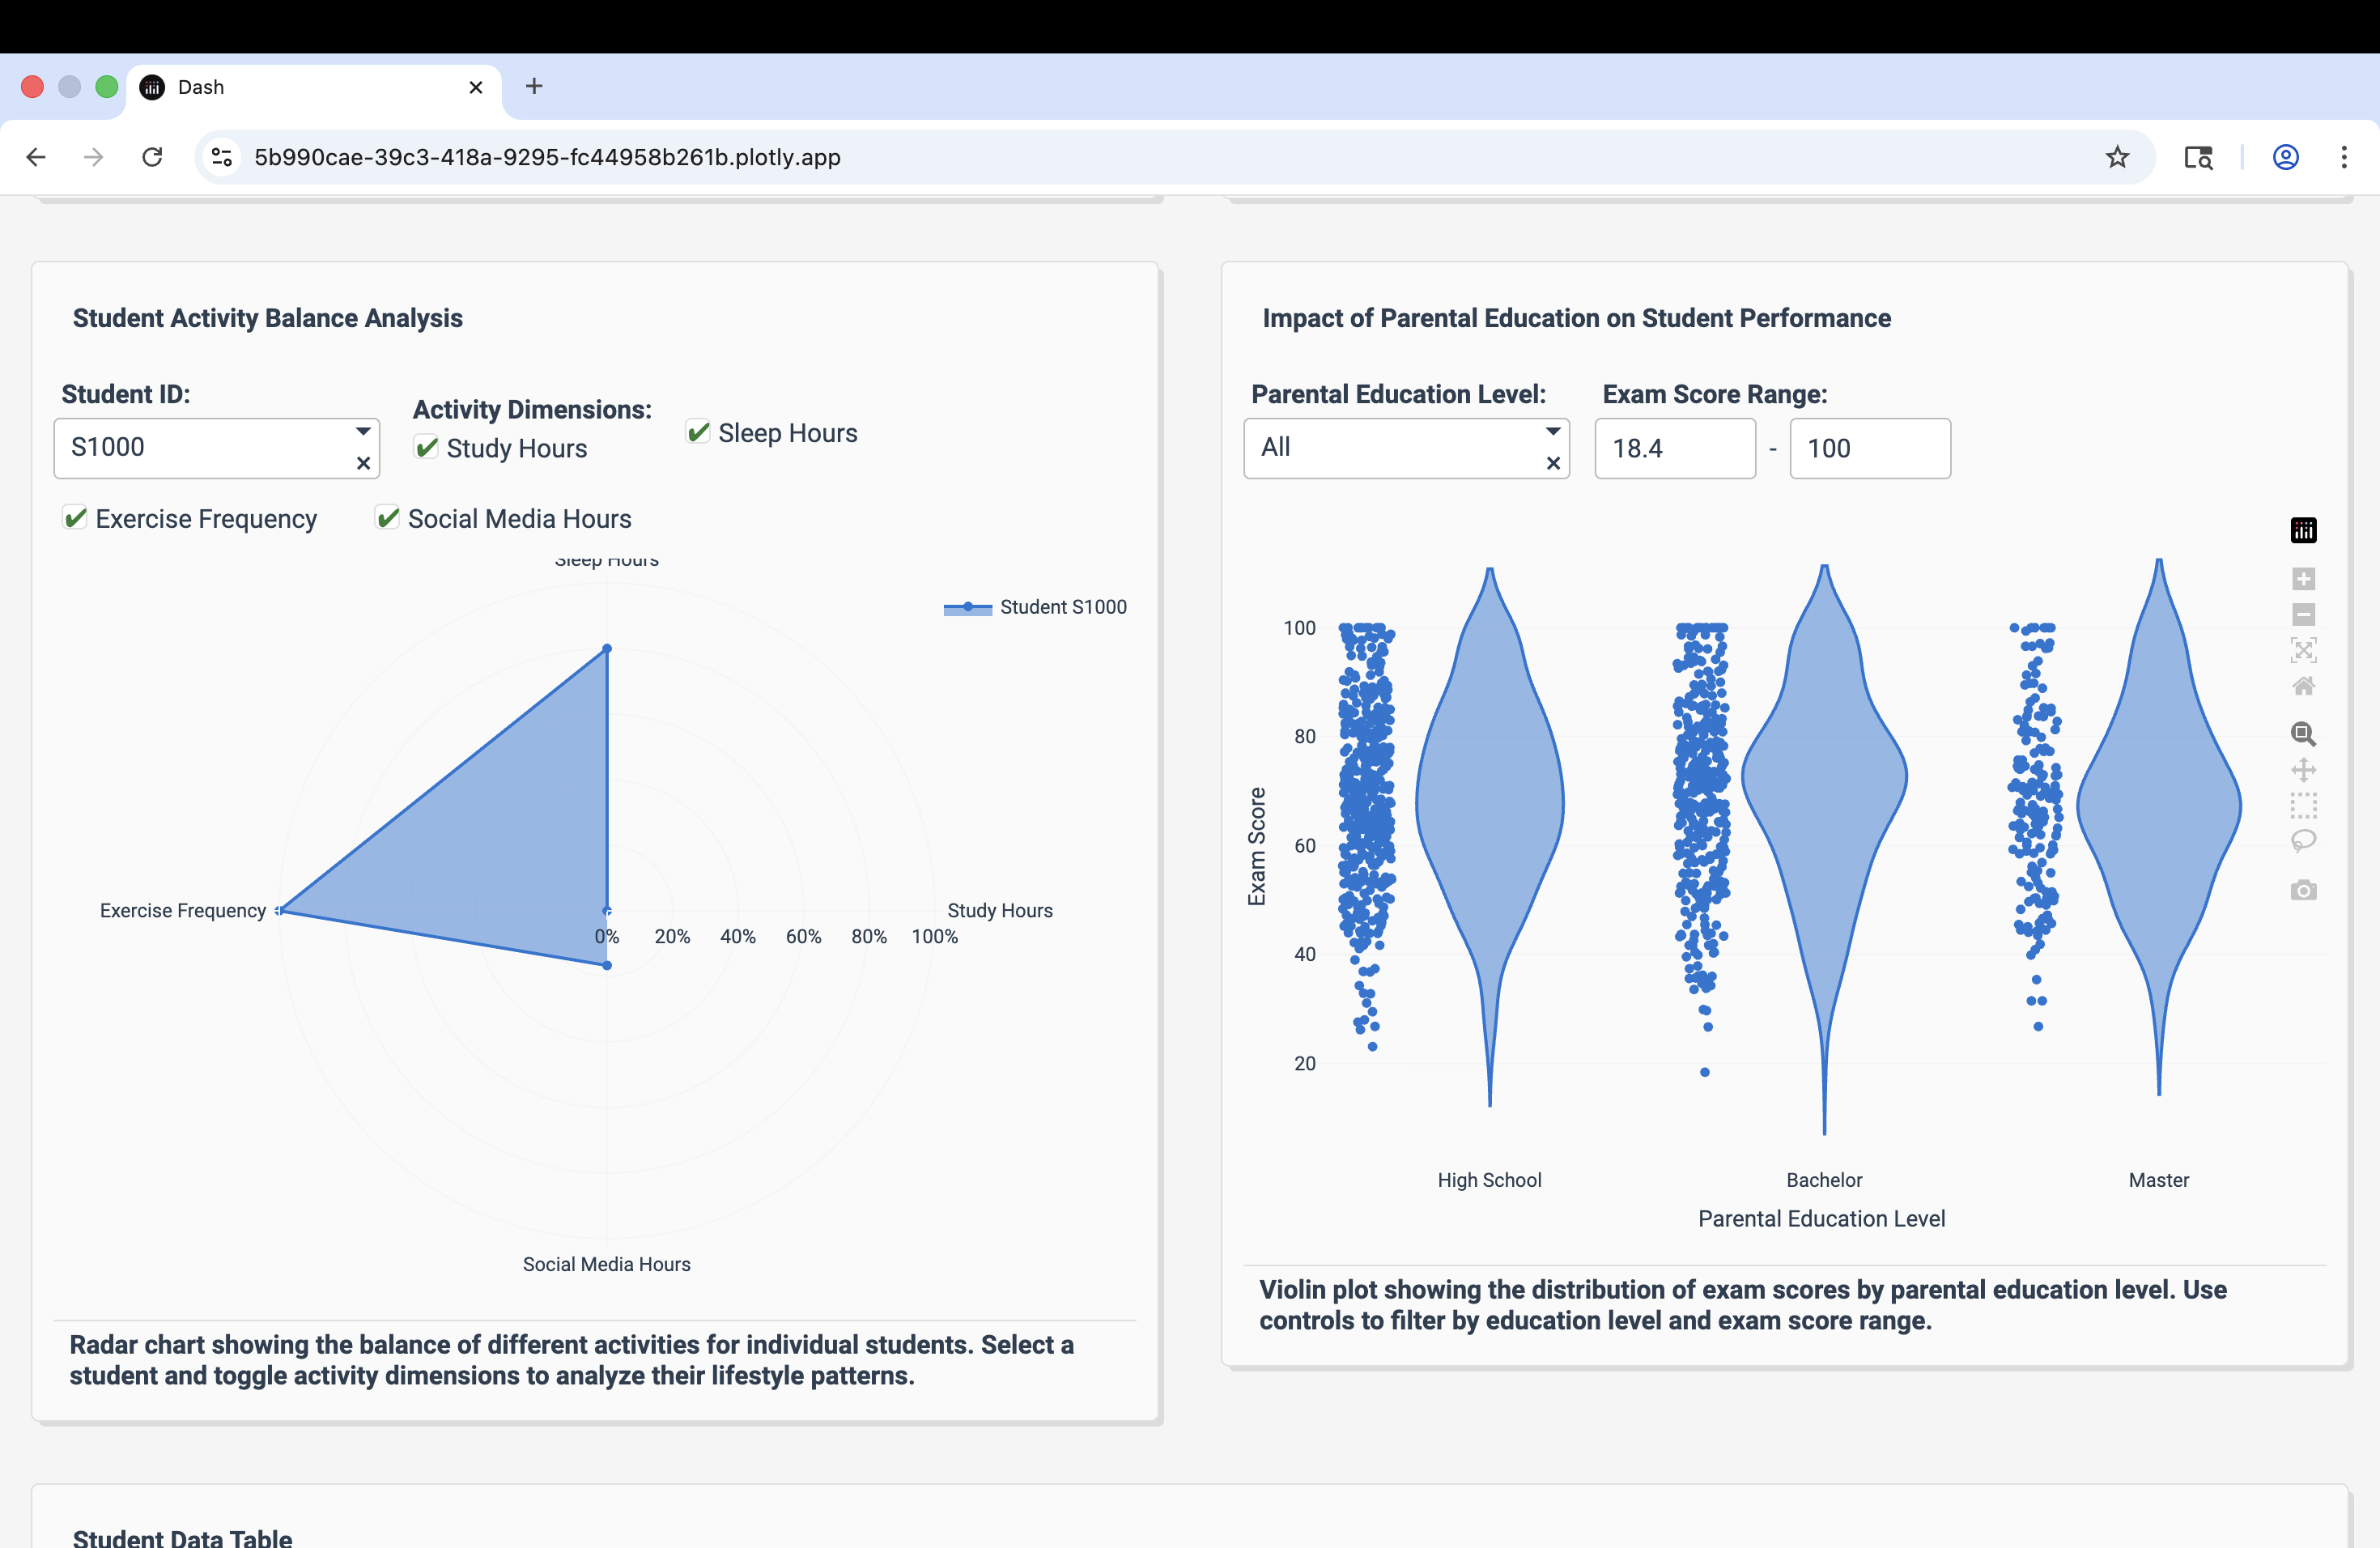
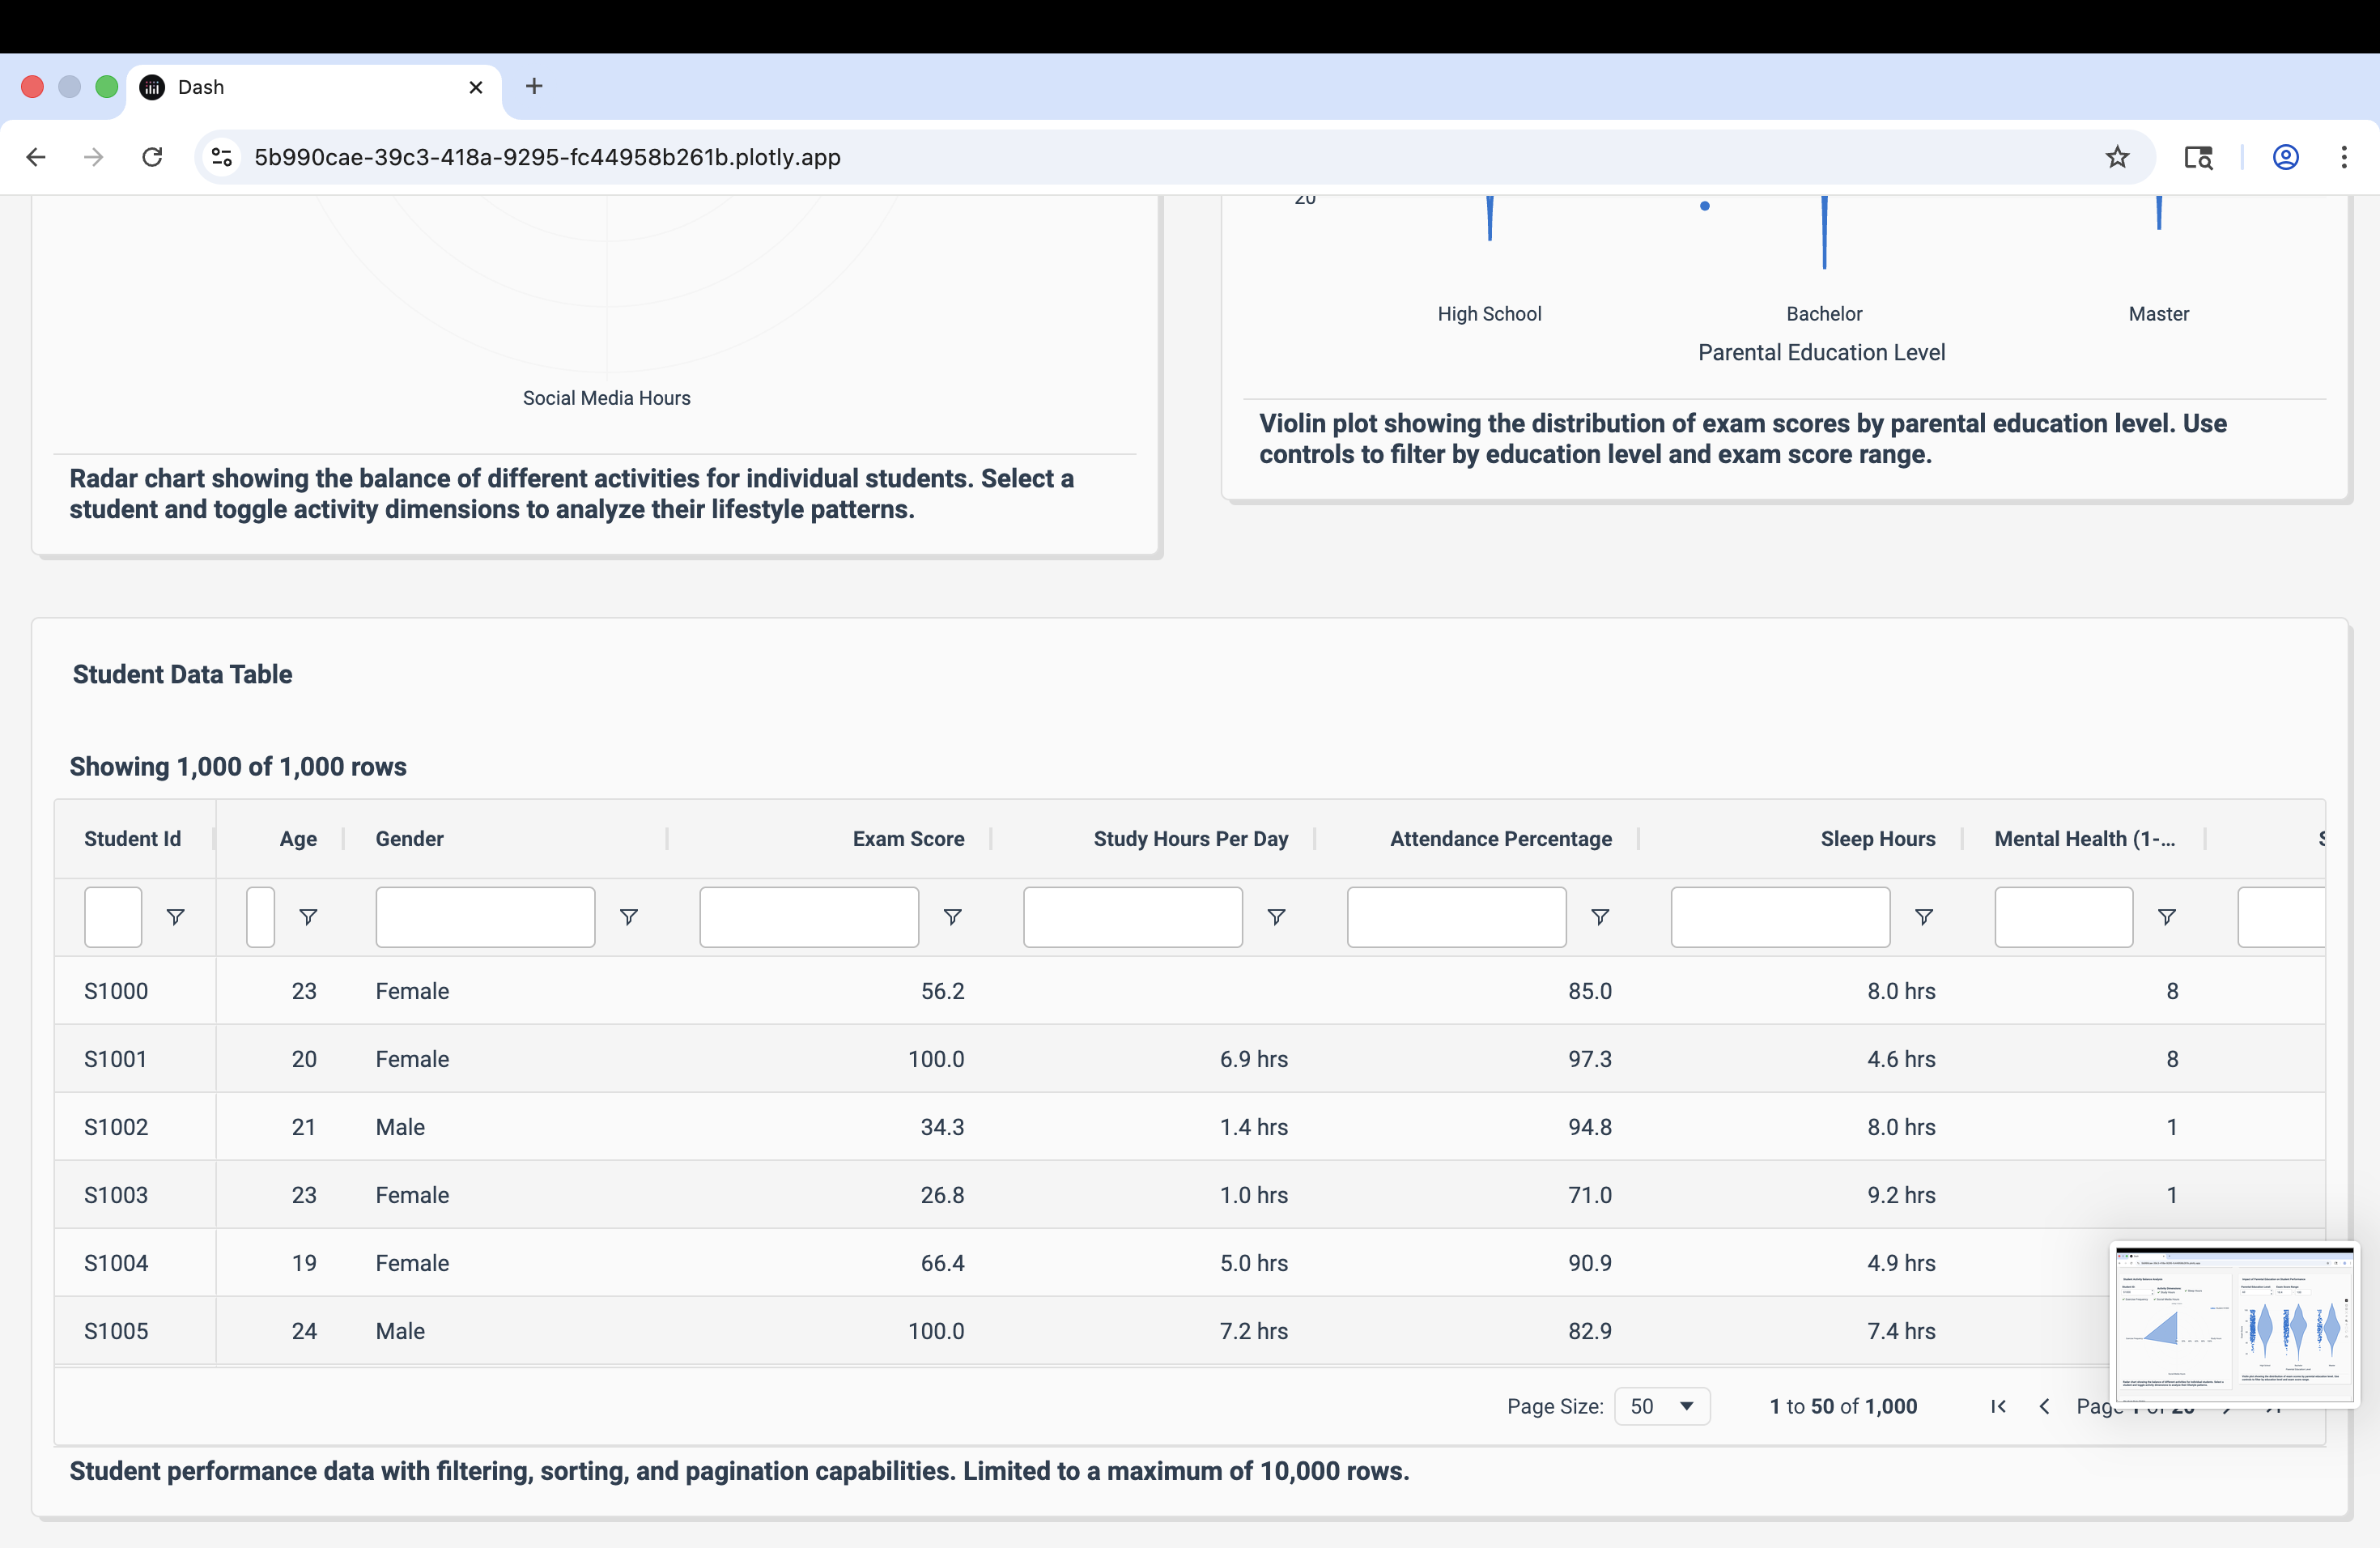
Radar chart for each student that describes their lifestyle activities and a violin plot
-
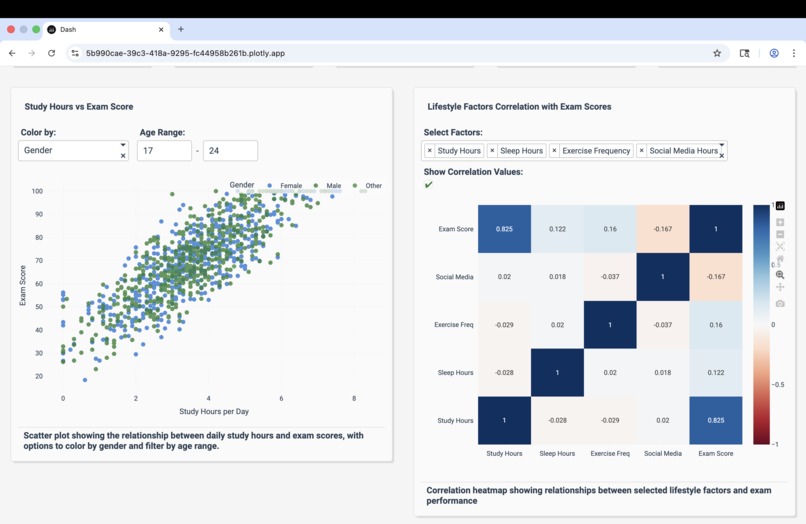
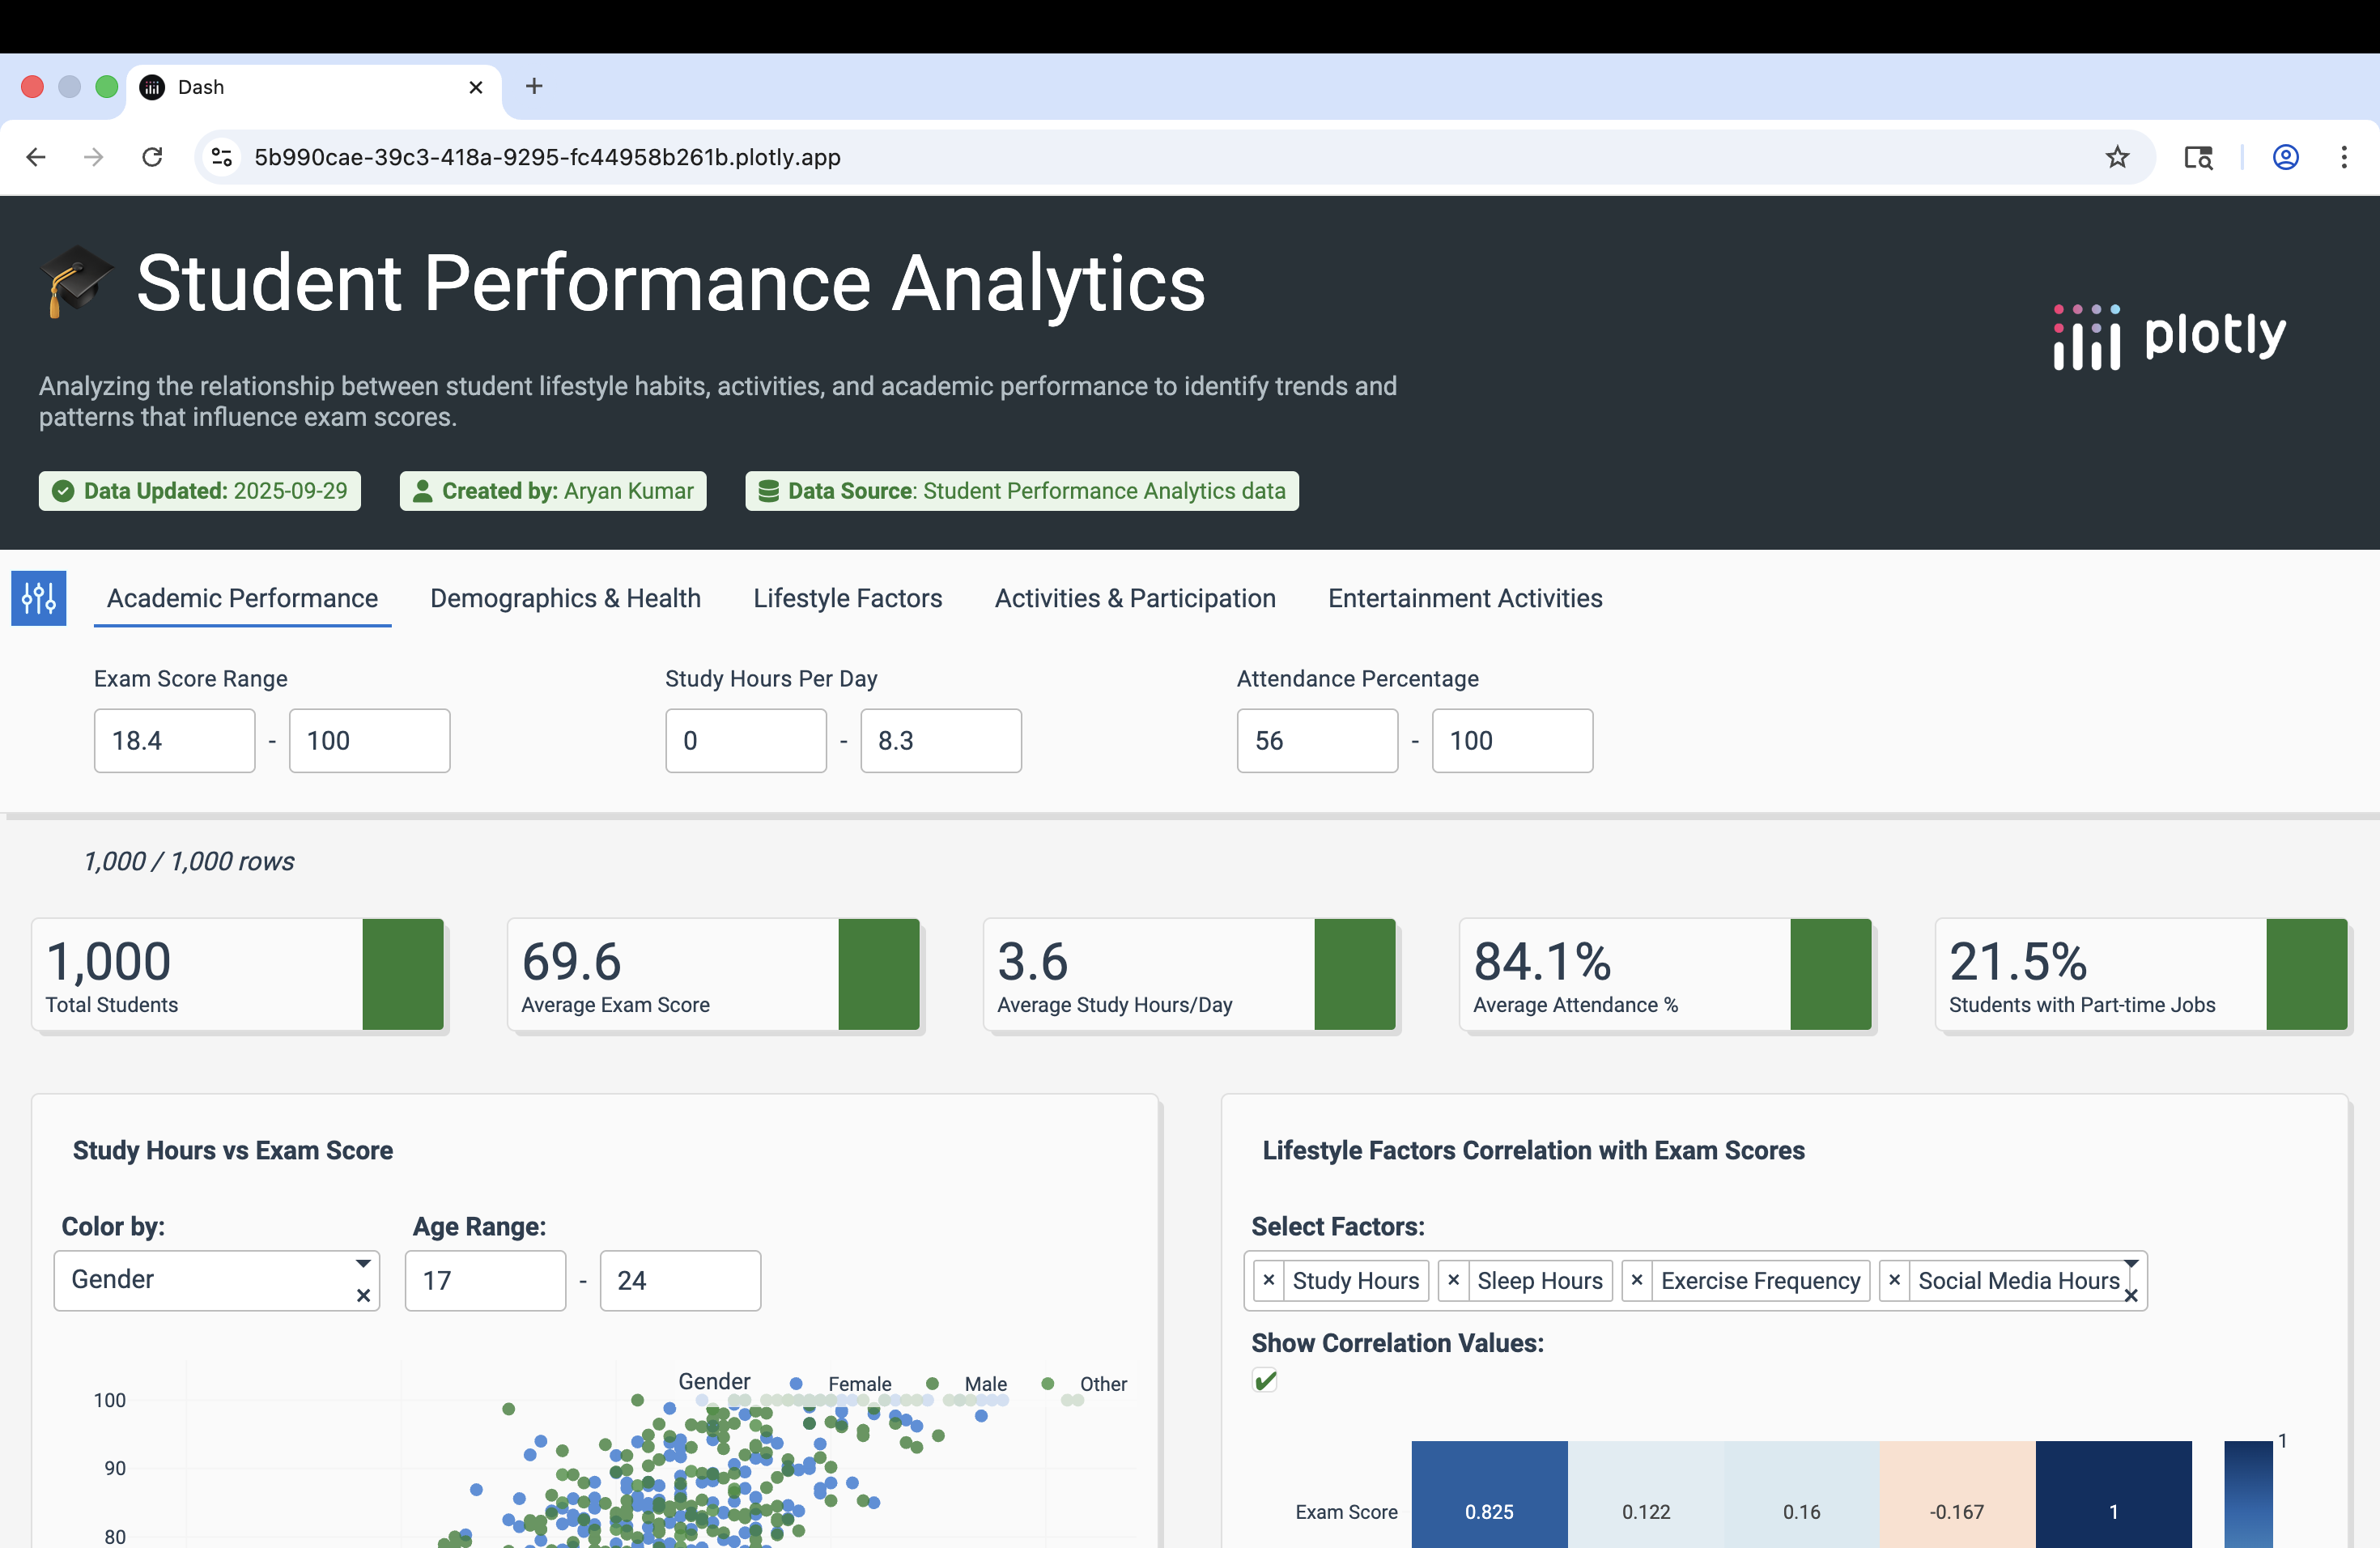
Scatter plot and correlation matrix
-
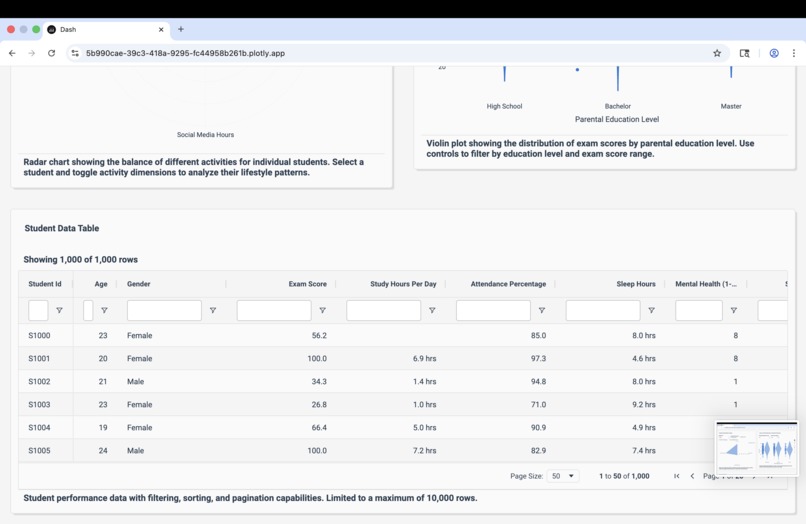
Student data basis on any filter
-

Filter with different categories


Inspiration
In today's digital world, there are a lot of factors that affect a student's academic performance.
What it does
This dashboard displays various graphs that explain relation between certain parameters.
How we built it
I acquired my dataset from Kaggle and used Plotly Studio to create the dashboard with custom prompts.
Challenges we ran into
I was not aware of the Plotly tool and its amazing features. I first read the documentation then proceeded with the dashboard which was then quite easy to use with such robust set of features.
Accomplishments that we're proud of
I am happy with the end result I obtained which would be useful for educators in real-world environment.
What we learned
I learnt about different student activities that affect their academics and also about Plotly.
What's next for Student Performance Analytics
This can be implemented in school to better handle student pressure


Log in or sign up for Devpost to join the conversation.