Inspiration
Educational institutions collect large amounts of student data, but turning that data into clear and timely decisions can be difficult. Teachers often need to manually review marks, attendance and performance records before identifying students who may require support.
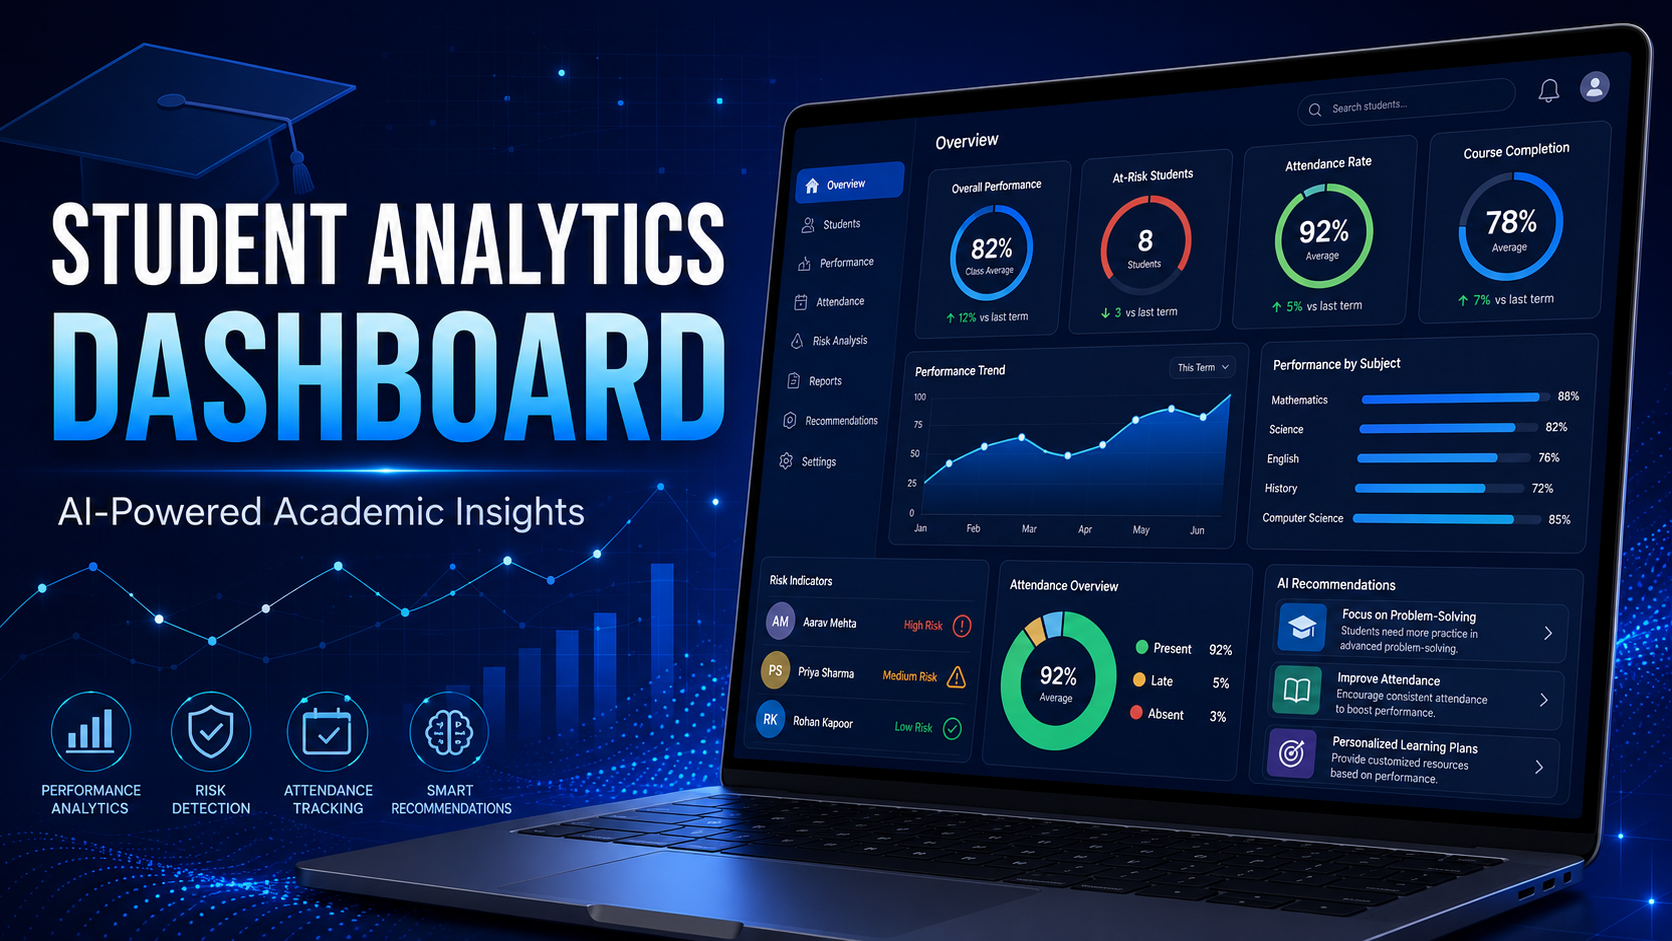
We created the Student Analytics Dashboard Generator to transform raw academic data into meaningful visual insights. Our goal was to help educators identify academic risks early, understand performance patterns and make informed decisions through one accessible dashboard.
What it does
The application allows users to upload their own student dataset and map its columns without relying on a fixed data format. It cleans and processes the data before generating an interactive analytics dashboard.
Its key features include:
- Custom student-data upload and column mapping
- Academic performance and attendance analytics
- Automated student risk identification
- Interactive charts and comparative analysis
- Data-driven recommendations and interventions
- Presentation-ready insights
- Exportable PDF reports
- Responsive and easy-to-use interface ## How we built it We built the application using React, TypeScript and Vite. Tailwind CSS was used to create a responsive interface, while Recharts powers the interactive data visualizations.
We used Zustand for application state management, SheetJS for spreadsheet processing and jsPDF for downloadable reports. The analytics engine applies statistical and machine-learning techniques to identify patterns, calculate risk levels and generate recommendations.
The application is deployed through GitHub Pages, with GitHub Actions automatically building and publishing every update.
Challenges we ran into
One major challenge was supporting datasets with different column names and structures. We solved this through a flexible column-mapping process.
We also faced challenges related to data cleaning, risk-score consistency, browser-based machine-learning dependencies and static hosting. We optimized the build process, adapted the routing for GitHub Pages and created an automated deployment workflow.
Another challenge was presenting complex academic information without overwhelming users. We addressed this by organizing the results into focused dashboards, clear indicators and actionable recommendations.
Accomplishments that we're proud of
We are proud that the application works with user-provided datasets instead of a single hardcoded dataset. It combines data preparation, visualization, risk detection, recommendations and reporting within one browser-based platform.
We also created a fully automated and free deployment pipeline, making the project accessible without requiring users to install any software.
What we learned
This project strengthened our understanding of data cleaning, flexible schema mapping, interactive visualization, state management and client-side analytics. We also learned how important usability and clear communication are when designing decision-support tools for non-technical users.
What's next for student-analytics-dashboard
Future improvements may include:
- Secure user accounts and saved projects
- Cloud database integration
- More advanced predictive models
- Explainable risk scores
- Institution-level benchmarking
- Real-time collaboration
- Additional report templates
- Integration with learning-management systems
Our long-term vision is to develop the project into a complete academic intelligence platform that helps institutions move from reactive reporting to early, data-informed student support.
Built With
- analysis
- brain.js
- css
- css3
- data
- github
- html5
- javascript
- jspdf
- karein:
- learning
- machine
- pages
- react
- recharts
- sheetjs
- tailwind
- typescript
- visualization
- vite
- zustand

Log in or sign up for Devpost to join the conversation.