
Inspiration
Good striking technique is invisible. You can see where the ball goes, but not where your foot met it, how long it stayed on your boot, or how much spin you put on it. Coaches and labs measure that with high-speed cameras and expensive equipment. We wanted the measurement to live inside the ball, so anyone with a ball and a laptop can get the feedback. The "Code for the Cup" theme gave us the excuse to build it.
What it does
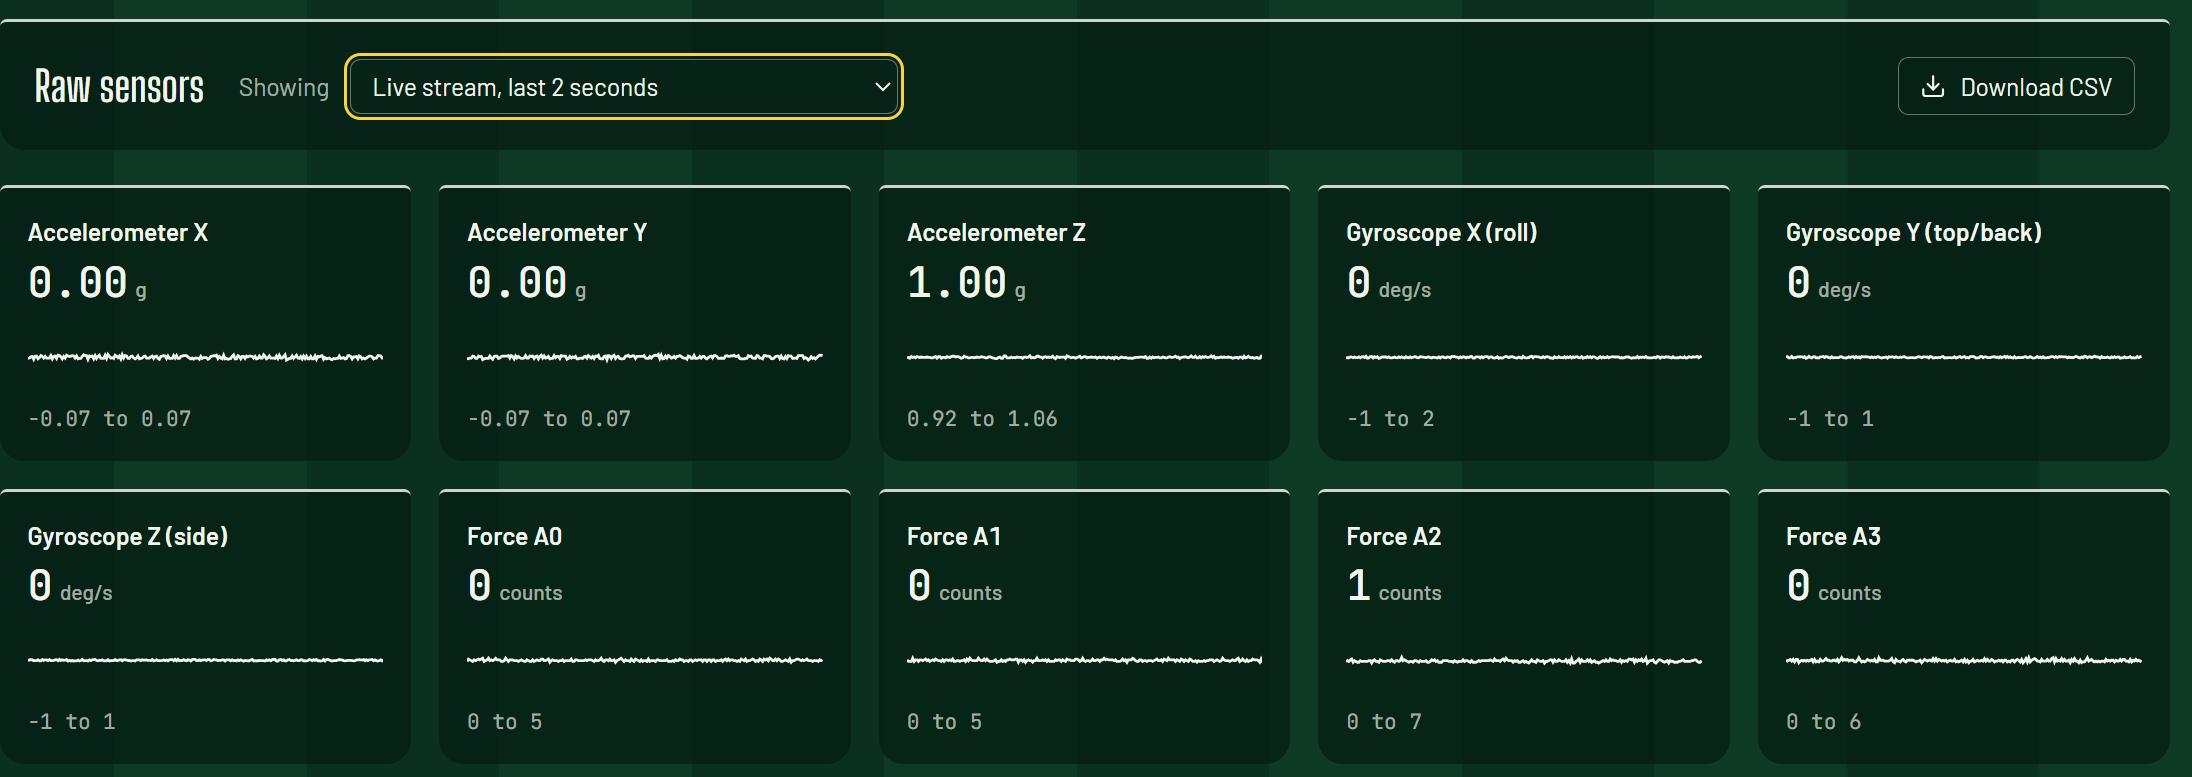
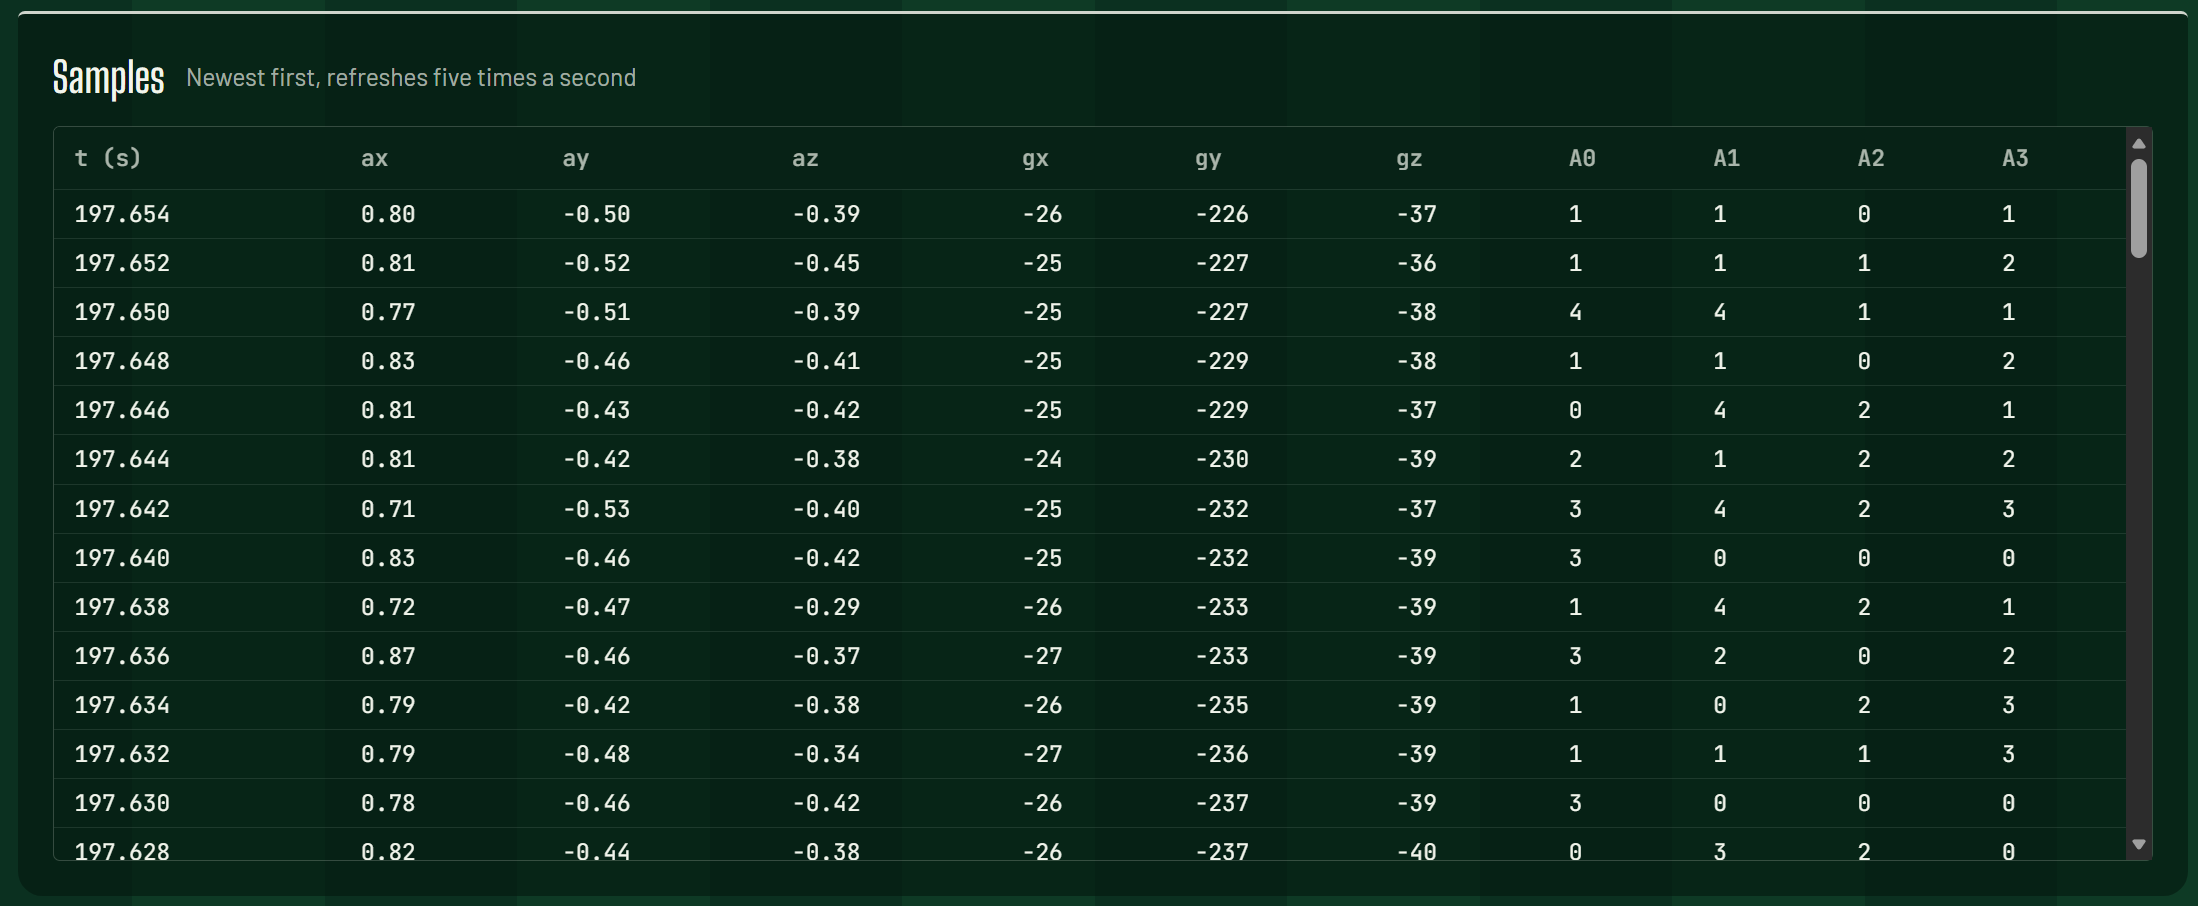
StrikeSense is a sensor ball plus a coaching dashboard. An IMU at the ball's center and four piezo force sensors on the inside of the shell stream data at 500 Hz. The software then:
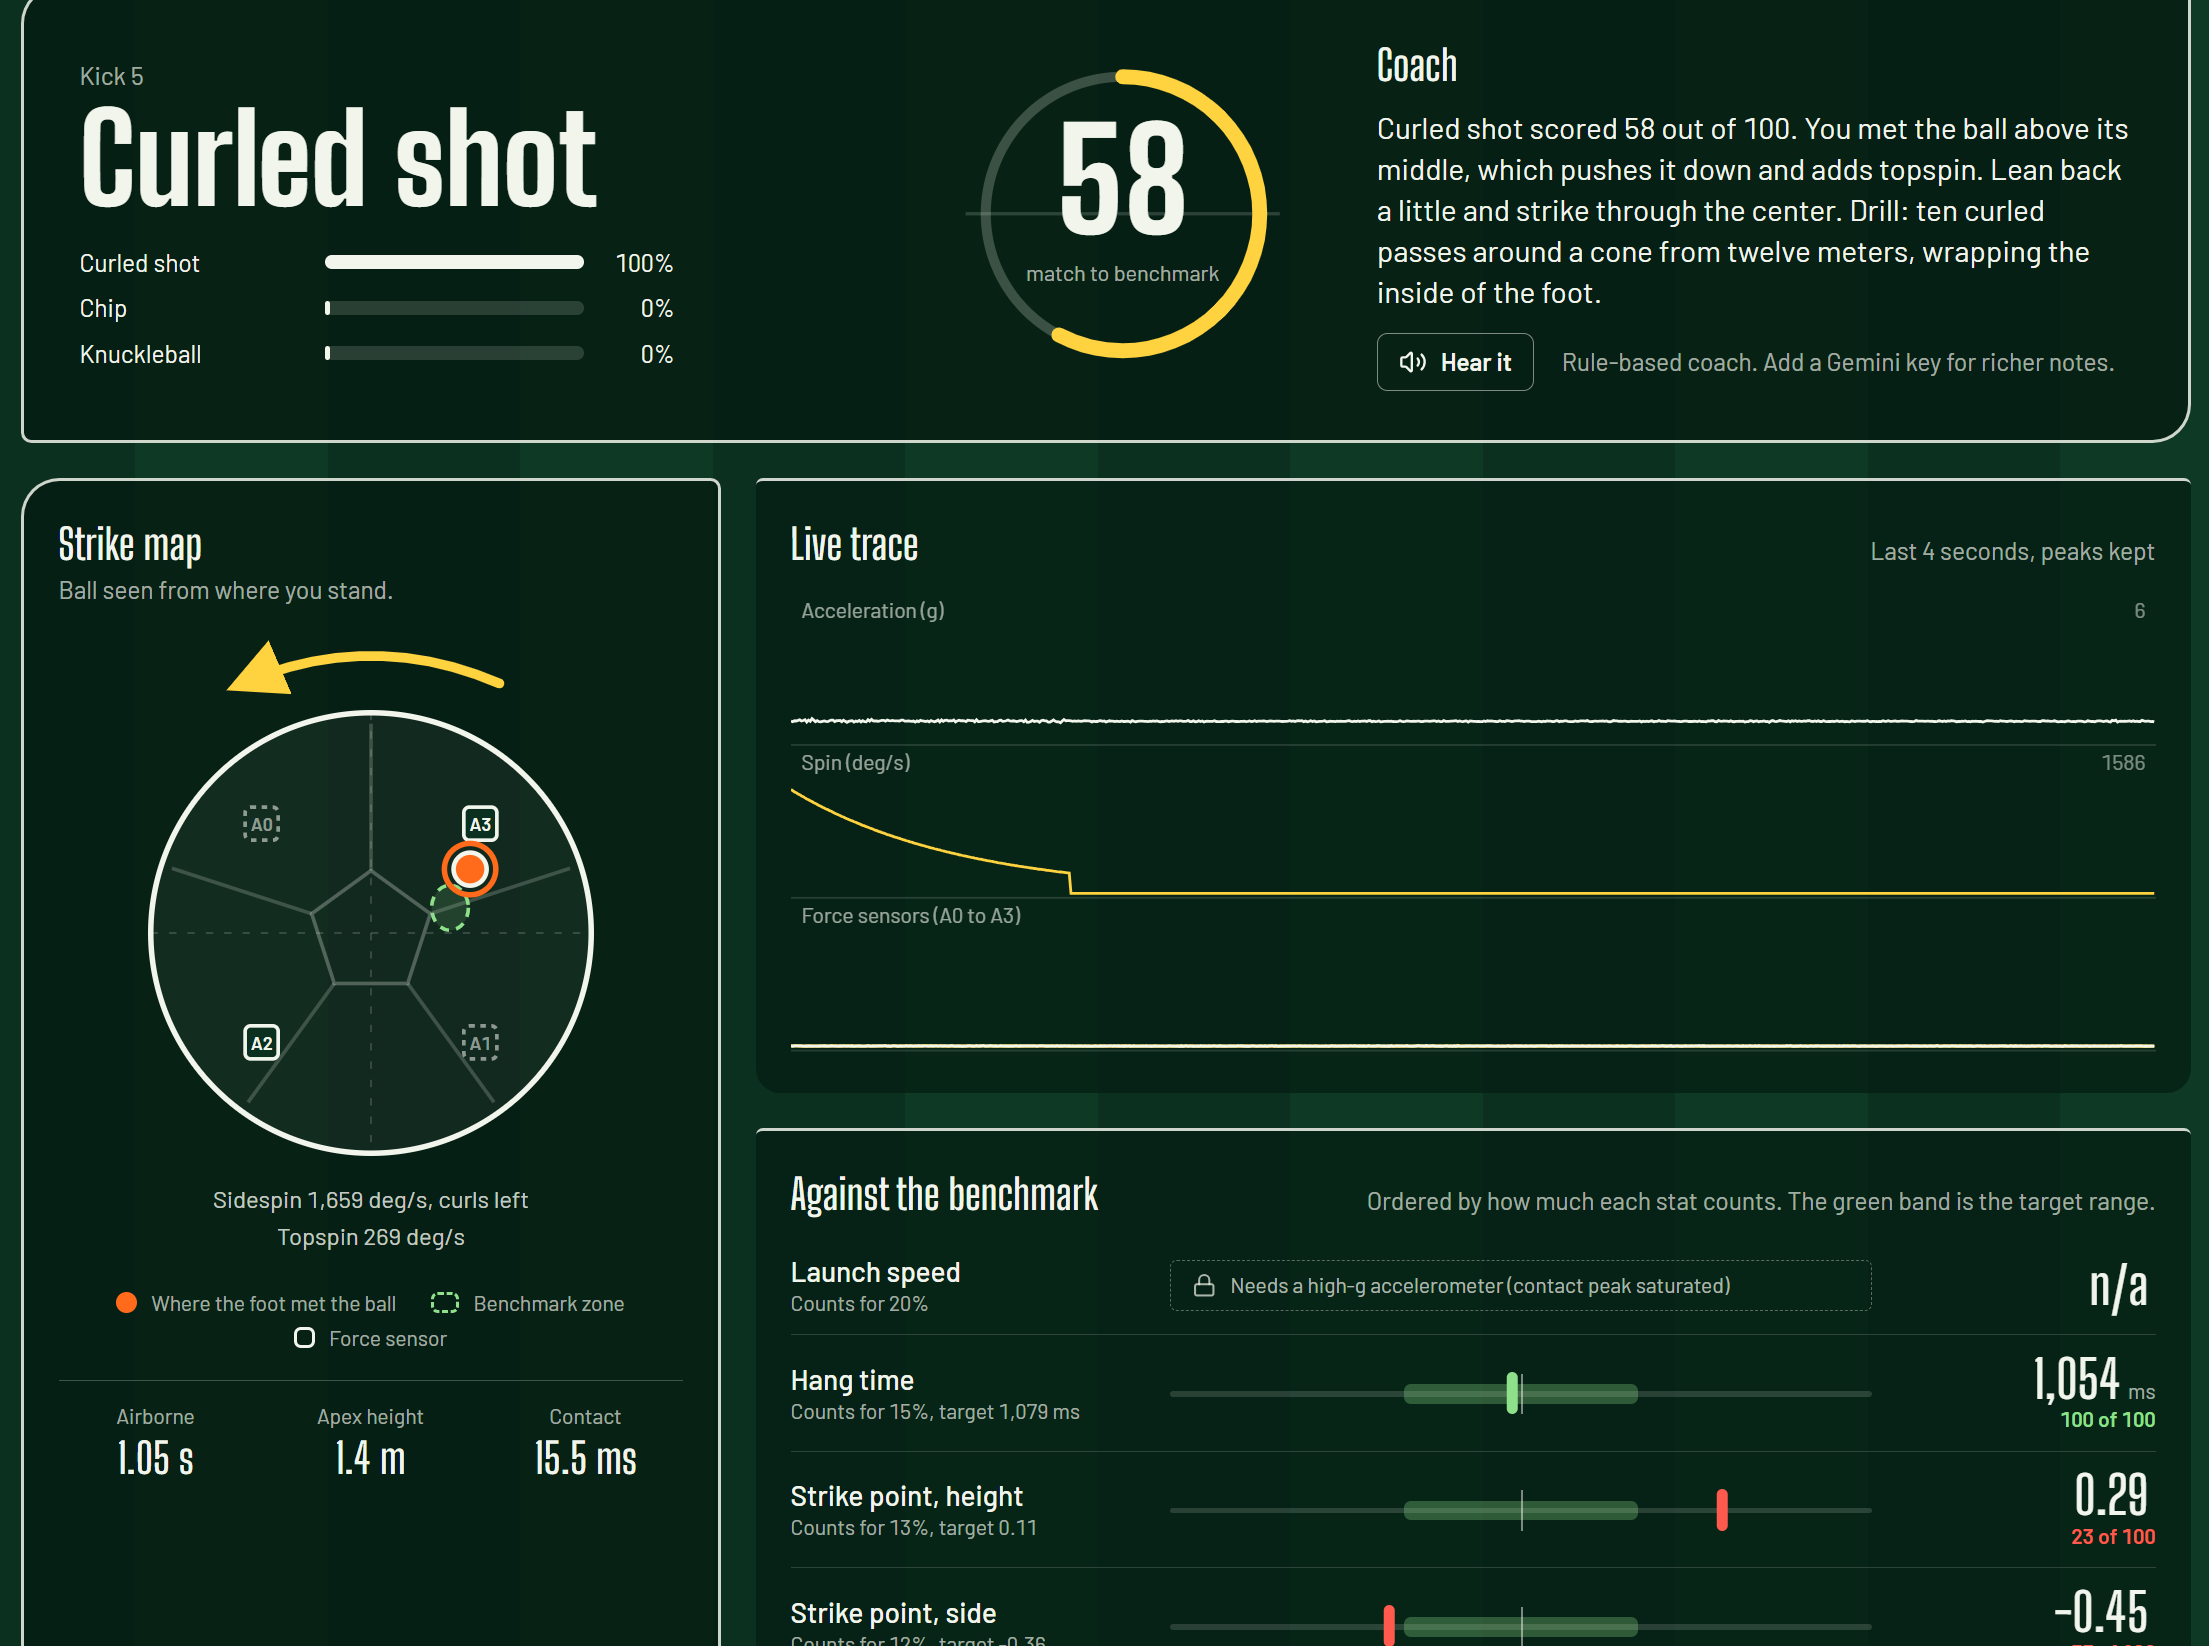
- detects each kick and extracts contact time, spin (top, side and total), hang time, apex height, and the point on the ball where the foot made contact,
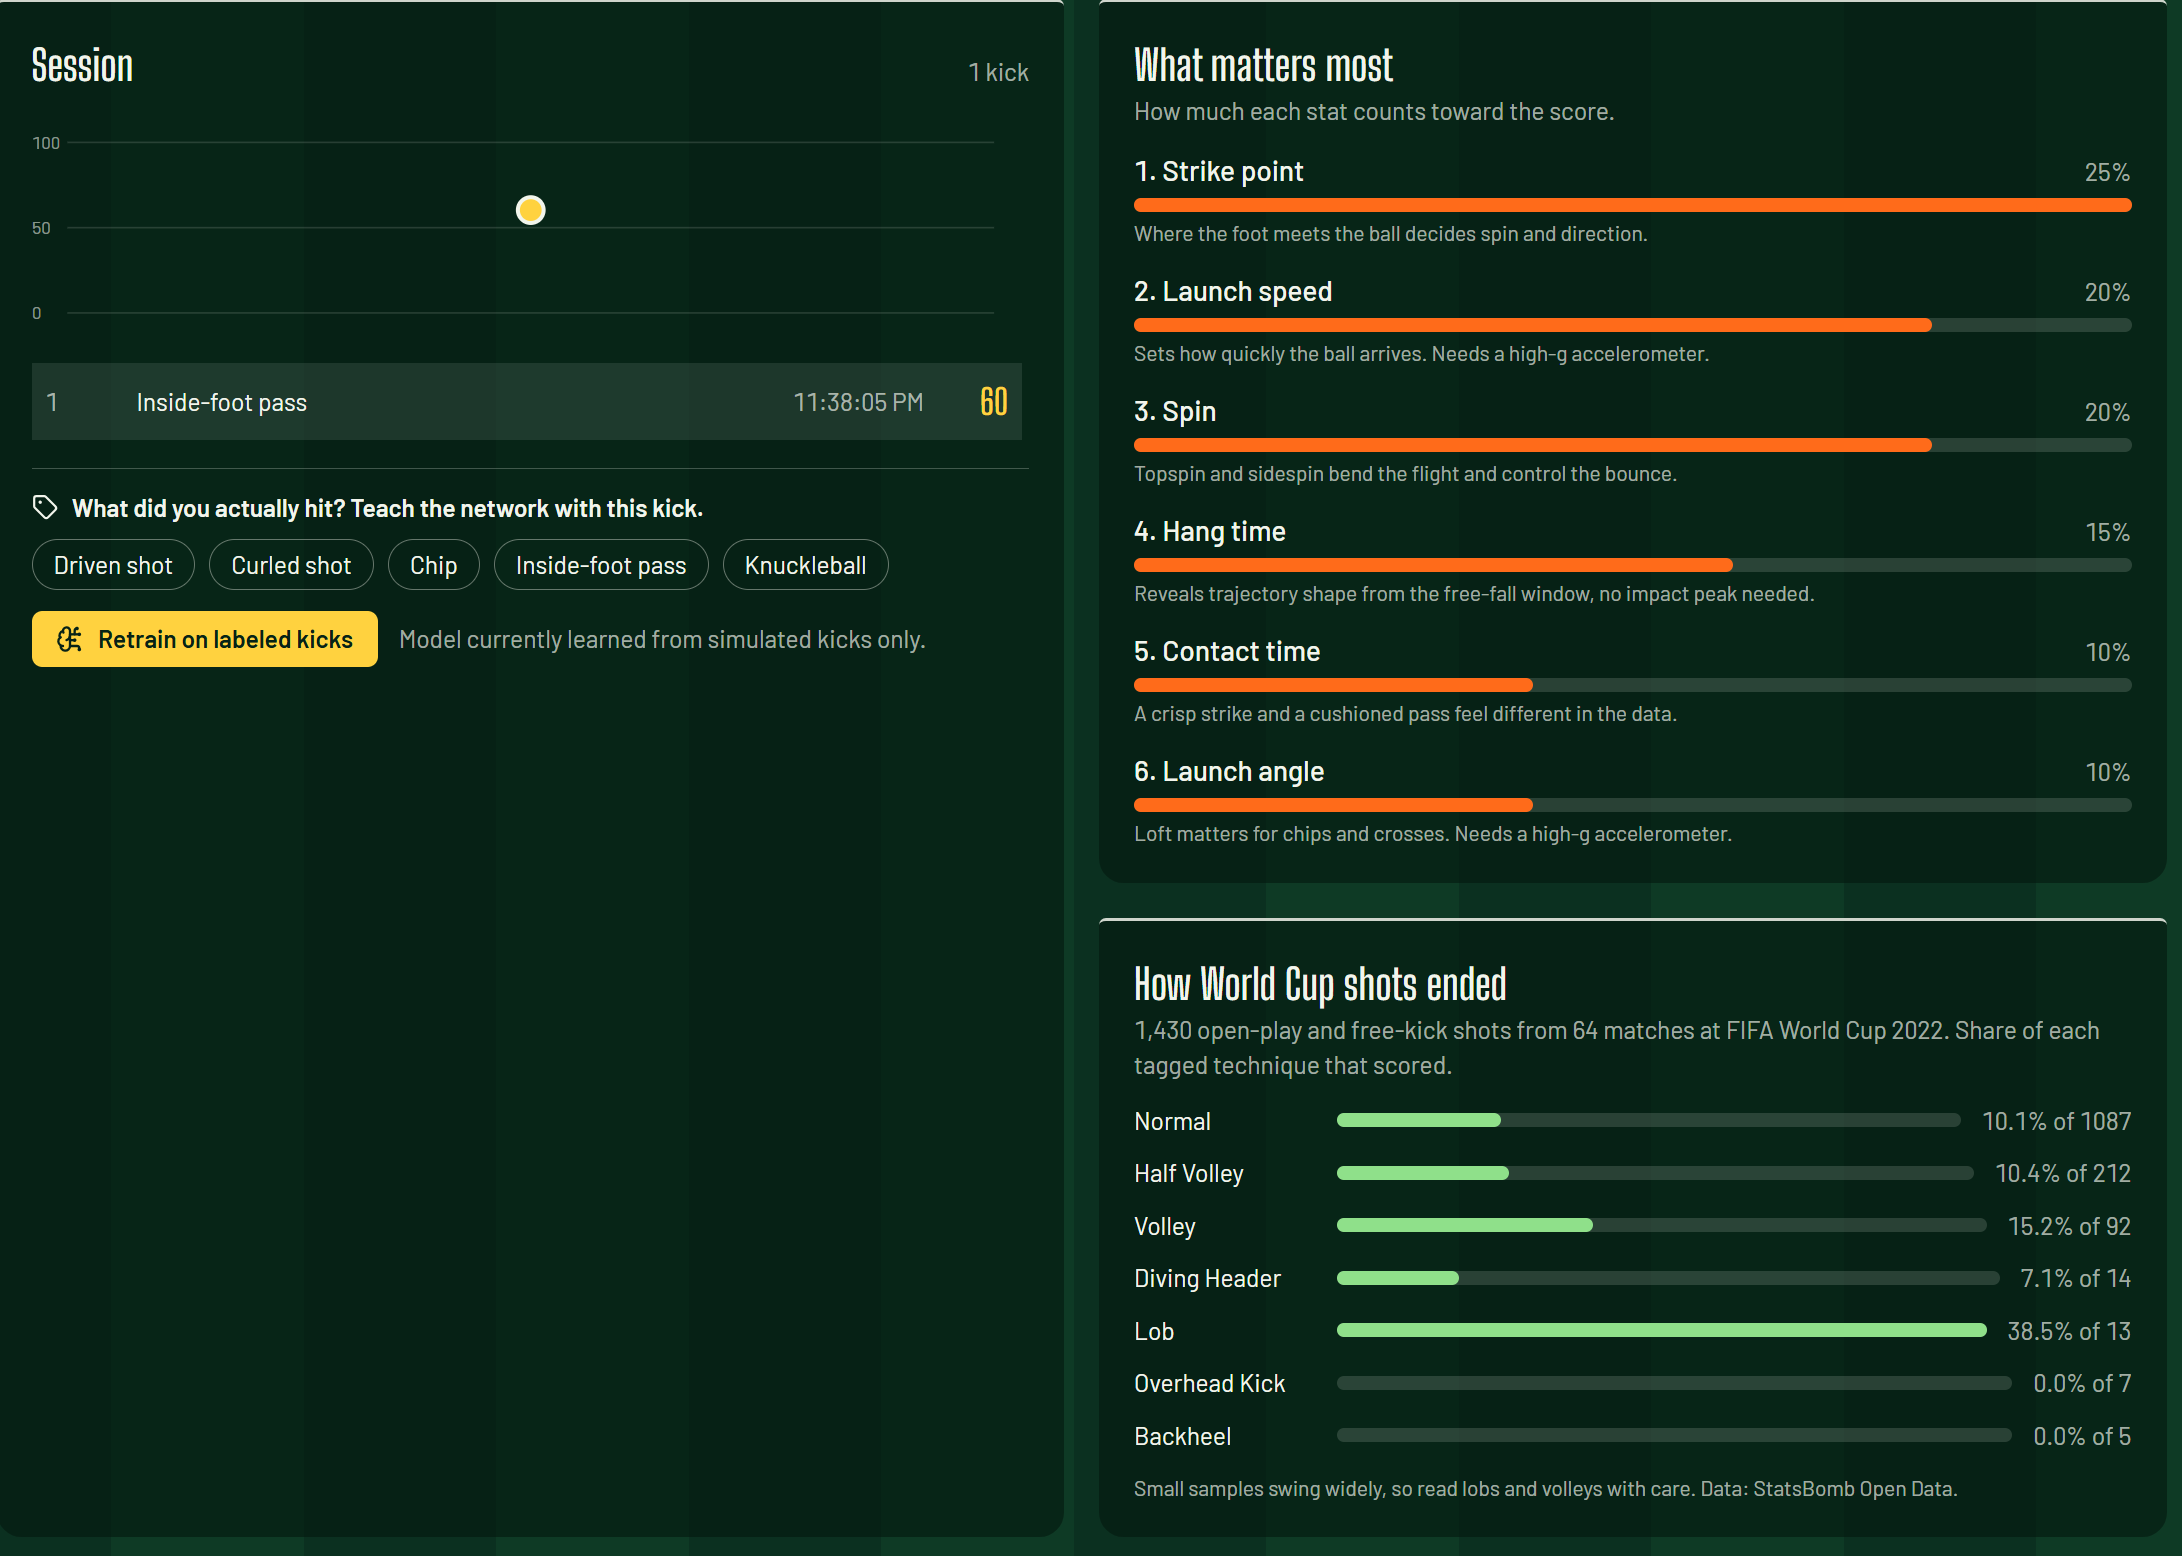
- classifies the technique (drive, curl, chip, pass, knuckle) with a small neural network,
- scores the kick against a benchmark and ranks which stats matter most,
- shows a strike map, live traces and every raw sensor on a second page, and gives a written coaching note you can have read aloud.
How we built it
Physics first. Hang time comes from free fall, when the accelerometer reads about 0 g:
$$T = \frac{2v\sin\theta}{g}, \qquad h_{\text{apex}} = \frac{gT^2}{8}, \qquad v_y = \frac{gT}{2}$$
Strike point matters because contact off the ball's center creates spin through torque, $\vec\tau = \vec r \times \vec F$. Contact above the middle adds topspin, and contact to one side adds sidespin. Four piezos arranged as a tetrahedron let us locate the contact point by solving $\ln p_i = k\,(\hat d_i \cdot \hat c) + b$ exactly across the four sensor amplitudes.
Scoring. Each metric is compared with a benchmark by $s_i = 100\,e^{-z_i^2/2}$, where $z_i = (x_i - \mu_i)/\sigma_i$. The overall score is the weighted average $S = \sum w_i s_i / \sum w_i$ over the metrics the sensor can actually measure.
Software.
- Server: Python, FastAPI, NumPy and scikit-learn for the detector, feature extraction, classifier and API.
- Dashboard: React, Tailwind and Lucide.
- Simulator: a physics-based one, so the whole stack runs and can be demoed with no hardware.
- World Cup context: a card built from StatsBomb Open Data (1,430 open-play and free-kick shots from the 2022 World Cup).
Hardware. We wrote Arduino Uno firmware (500 Hz, 250000 baud, checksummed 27-byte packets). We also wrote a full FPGA sensor hub in Verilog: an I2C master, an MPU-6050 controller, and four chip-free sigma-delta ADCs for the piezos. In the sigma-delta loop, the fraction of ones from the comparator equals $V_{in}/V_{cc}$. A sinc$^2$ filter with gain $\text{OSR}^2 = 2^{16}$ turns that into 16-bit codes at about 49 kHz, and a peak-hold stage keeps the impact peak for each packet. Both sensor paths send the same packet format, so the server does not care which one is connected.
Challenges
- The accelerometer saturates. A 25 m/s kick over about 10 ms means an average acceleration near $\bar a \approx v/t_c \approx 255\,g$, and about $400\,g$ at the peak for a half-sine pulse. The MPU-6050 tops out at $\pm 16\,g$. Rather than fake launch speed, the dashboard marks speed and angle as locked until a high-g sensor is added. Hang time, spin, contact time and strike point still work.
- FIFA data isn't motion data. It holds player ratings, not kinematics, so it cannot teach a network what good technique looks like. We used StatsBomb shot outcomes as context, and built a labeling and retraining loop so the network can learn from real kicks.
- Only four analog channels on the Uno. The IMU uses A4 and A5 for I2C, so we designed around four force sensors.
- Verifying hardware we could not fully test. We compiled the firmware on a desktop against mocked Arduino headers and decoded its output with the server's own parser. We simulated the FPGA design against a behavioral IMU and RC models of the piezo channels, then checked it with synthesis.
- Strike-point estimation. Our first version, a weighted centroid, mixed up side and height because of the tetrahedral geometry. Solving the log-amplitude model exactly brought the error down to about 0.05.
What we learned
- Sensor limits decide what you can honestly claim, so we built the software to show what is measured instead of guessing.
- Simulation with a physics model lets you build and test the whole pipeline before the hardware exists.
- An FPGA can catch fast impact peaks that a 500 Hz microcontroller loop can miss.
- Being upfront about what is simulated and what is measured makes a project more credible.
What's next
- Run the firmware and FPGA hub on real hardware and tune the analog front end.
- Add a high-g accelerometer to unlock launch speed and angle.
- Record and label real kicks to replace the simulated training data and benchmarks.
- Put the electronics inside a balanced 3D-printed frame, then extend to passing, dribbling, matching your style to a top player, and a floor mat for footwork.


Log in or sign up for Devpost to join the conversation.