-
-

Home page
-

Dashboard
-

lessons
-
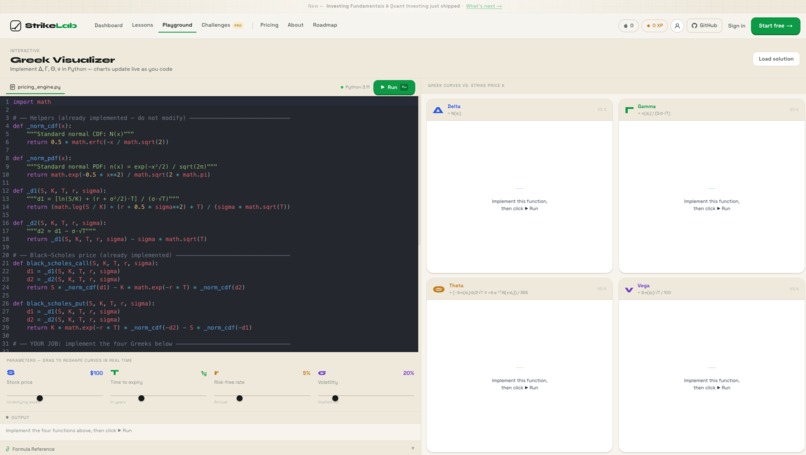
playground
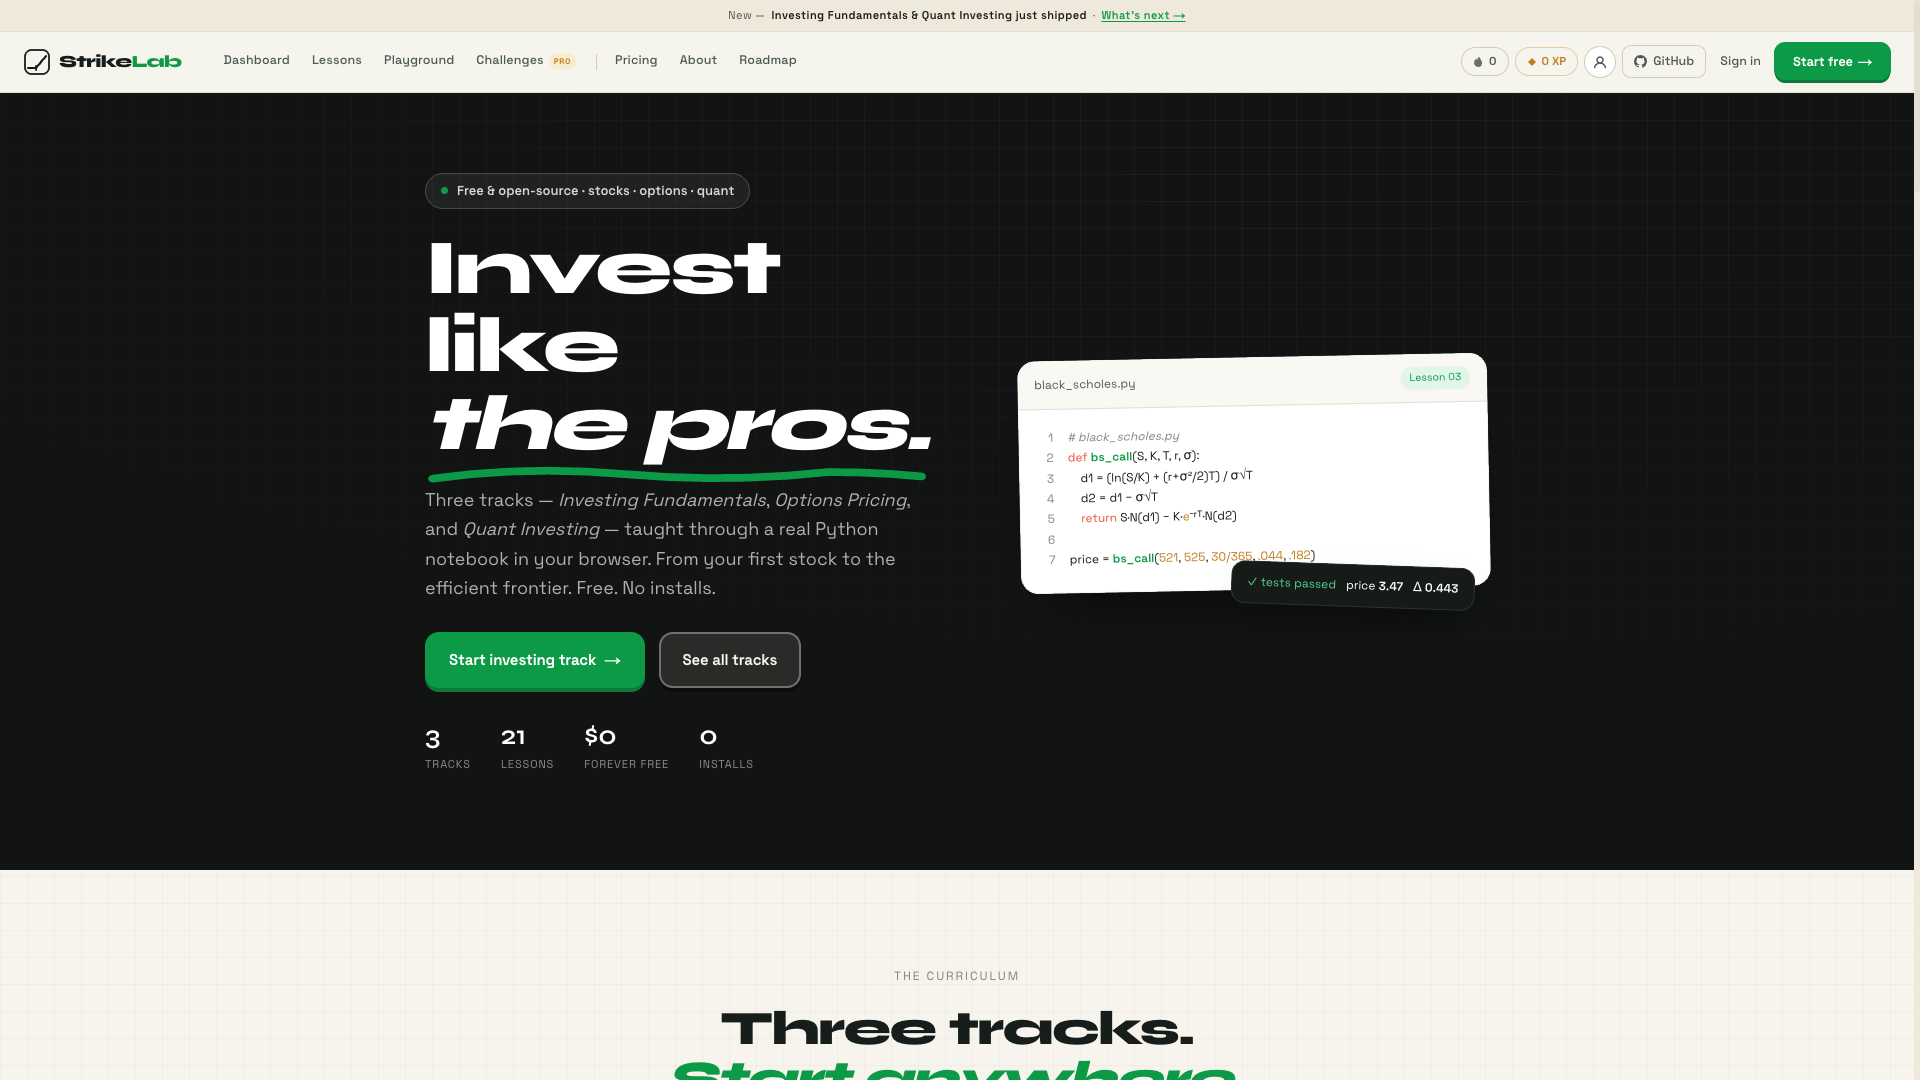


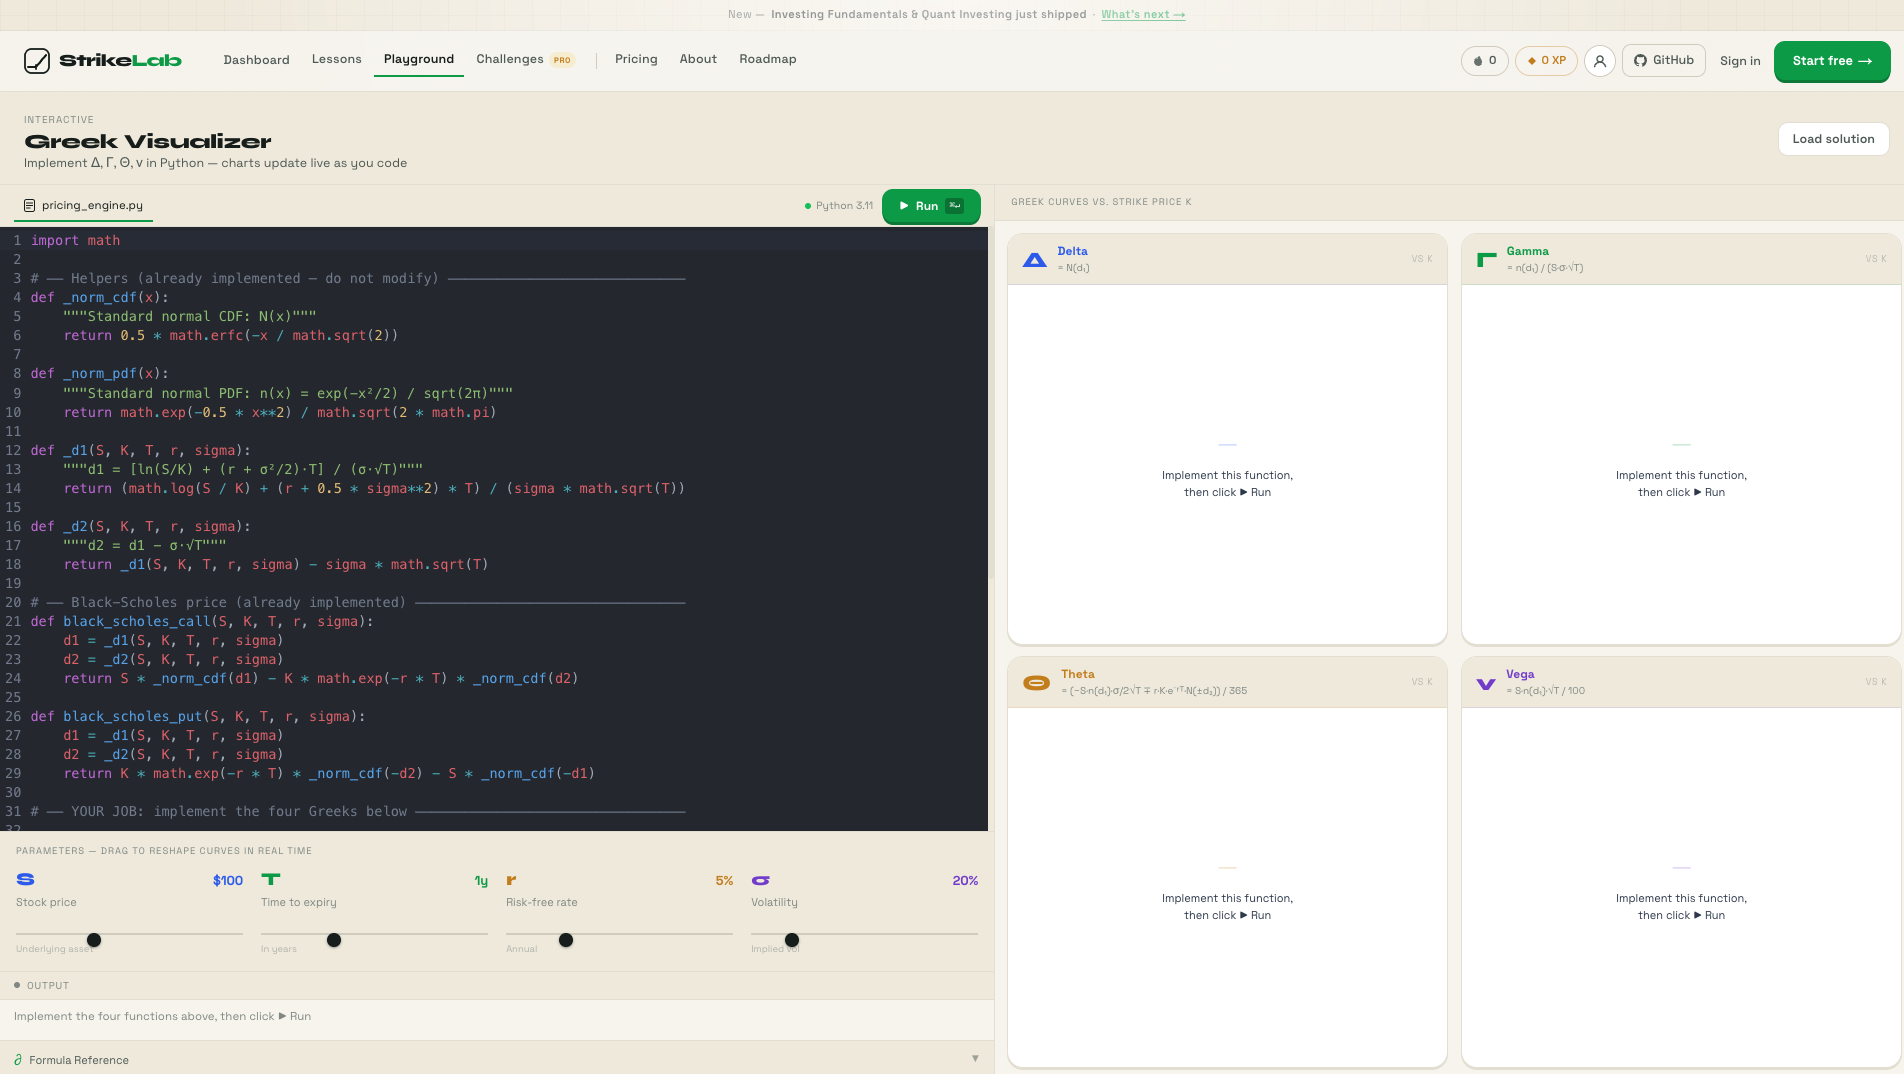
Inspiration I got interested in options pricing after reading about quantitative finance strategies — specifically how traders use derivatives to express directional views with defined risk. What I kept running into was the same problem: every explanation of the Black-Scholes model either hand-waved the math or threw the formula at you with no intuition for what was actually happening. The formula itself isn't that complicated: C=S0⋅N(d1)−Ke−rT⋅N(d2)C = S_0 \cdot N(d_1) - K e^{-rT} \cdot N(d_2)C=S0⋅N(d1)−Ke−rT⋅N(d2) where: d1=ln(S0/K)+(r+σ22)TσT,d2=d1−σTd_1 = \frac{\ln(S_0/K) + \left(r + \frac{\sigma^2}{2}\right)T}{\sigma\sqrt{T}}, \qquad d_2 = d_1 - \sigma\sqrt{T}d1=σTln(S0/K)+(r+2σ2)T,d2=d1−σT But what does N(d1)N(d_1) N(d1) actually mean? What happens to a call's value when you move σ\sigma σ by 1%? Why does an at-the-money option lose value faster near expiration than one deep in-the-money? Most tools just give you a number. I wanted something that let you see the answers. What it does StrikeLab is an interactive Black-Scholes options pricing calculator and visualizer built for learning, not trading. You input the five parameters — spot price S0S_0 S0, strike KK K, time to expiration TT T, risk-free rate rr r, and implied volatility σ\sigma σ — and StrikeLab shows you live call and put prices recalculated on every input change, the Greeks with inline explanations, and an interactive payoff diagram that updates in real time. The Greeks measure how the option price changes with each variable: Δ=N(d1),Γ=N′(d1)S0σT,V=S0T⋅N′(d1)\Delta = N(d_1), \qquad \Gamma = \frac{N'(d_1)}{S_0 \sigma \sqrt{T}}, \qquad \mathcal{V} = S_0 \sqrt{T} \cdot N'(d_1)Δ=N(d1),Γ=S0σTN′(d1),V=S0T⋅N′(d1) Θ=−S0⋅N′(d1)⋅σ2T−rKe−rTN(d2)\Theta = -\frac{S_0 \cdot N'(d_1) \cdot \sigma}{2\sqrt{T}} - rKe^{-rT}N(d_2)Θ=−2TS0⋅N′(d1)⋅σ−rKe−rTN(d2) The goal was to make the math legible, not just runnable. How we built it The frontend is React, deployed on Vercel. I implemented the Black-Scholes pricing engine from scratch in JavaScript — no external math libraries. The trickiest part was the cumulative normal distribution N(x)N(x) N(x), which has no closed form. I used the Horner's method rational approximation from Abramowitz & Stegun: N(x)≈1−n(x)(b1t+b2t2+b3t3+b4t4+b5t5),t=11+0.2316419 xN(x) \approx 1 - n(x)(b_1 t + b_2 t^2 + b_3 t^3 + b_4 t^4 + b_5 t^5), \qquad t = \frac{1}{1 + 0.2316419\,x}N(x)≈1−n(x)(b1t+b2t2+b3t3+b4t4+b5t5),t=1+0.2316419x1 Separately, I built a companion C++ pricing engine implementing the same formulas natively — partly to deepen my understanding of the math, partly as a systems programming exercise. That version runs from the command line and outputs pricing tables across a range of spot prices and expiration dates. The two implementations cross-validate each other. Challenges we ran into Getting N(d1)N(d_1) N(d1) right. Floating-point precision issues in the normal CDF approximation caused the Greek calculations to drift at extreme values of d1d_1 d1 — deep ITM or OTM options. I had to test against known option price tables and trace the error back to the polynomial approximation coefficients. Theta's sign convention. Theta is almost always negative for long options, but the sign convention varies across textbooks — some express it per calendar day, some annualized, some flip the sign entirely. Getting consistent, correctly-signed output required committing to one convention early and being explicit about it in the UI. Making the Greeks feel intuitive. Delta is easy to explain. Gamma is harder — it's the rate of change of your directional exposure, and most resources just say "second derivative of price with respect to spot" which tells you nothing. Getting from that definition to a user-facing explanation that actually builds intuition took several iterations. Accomplishments that we're proud of
Implemented Black-Scholes and all five major Greeks from first principles, without any financial math library Built a parallel C++ implementation that outputs prices within floating-point tolerance of the JS version — a meaningful validation The payoff diagram renders and updates in under 16ms on every slider move, so the interaction feels live Every Greek has an inline explanation that explains what it means alongside the number, not just the formula
What we learned The math of options pricing is more about probability than finance. N(d2)N(d_2) N(d2) is the risk-neutral probability the option expires in the money. N(d1)N(d_1) N(d1) is the delta-adjusted version — the expected fraction of a share you need to hold to replicate the option's payoff. Once I understood that framing, the Black-Scholes formula stopped feeling like a black box and started feeling inevitable. I also learned that building an educational tool is harder than building a functional one. A correct calculator is easy. A calculator that teaches you why the output changed requires thinking carefully about what the user is confused about, not just what they asked for. What's next for StrikeLab
Implied volatility solver — given a market price, back out the σ\sigma σ the market is implying via Newton-Raphson iteration Multi-leg strategy visualizer — build and price spreads, straddles, iron condors, and butterflies interactively Historical volatility overlay — compare implied vol to realized vol over the past 30/60/90 days to spot potential mispricings
Built With
- codemirror-6
- next.js-16
- pyodide
- python
- recharts
- tailwind-css
- typescript
- vercel



Log in or sign up for Devpost to join the conversation.