Inspiration
We wanted to provide people with a visualization of crimes in Montreal to help people find safer travel routes. We also wanted to provide an opportunity for people to report their experiences with a focus on location, so others can be aware of locations with recent and/or common crime.
What it does
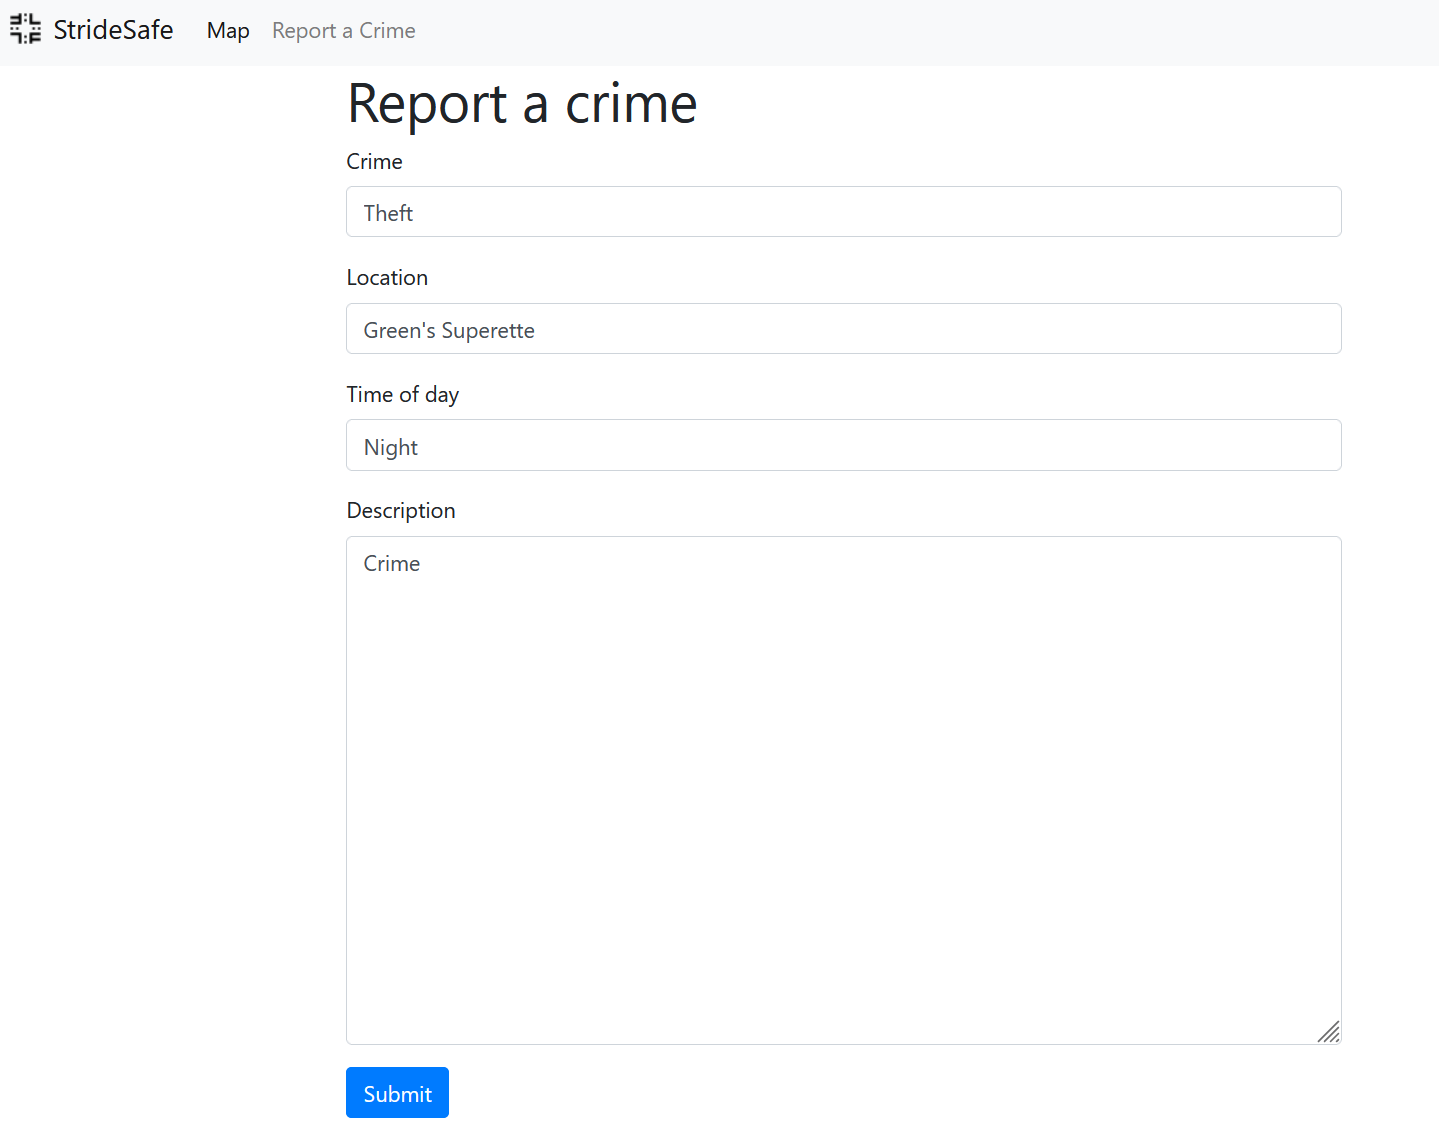
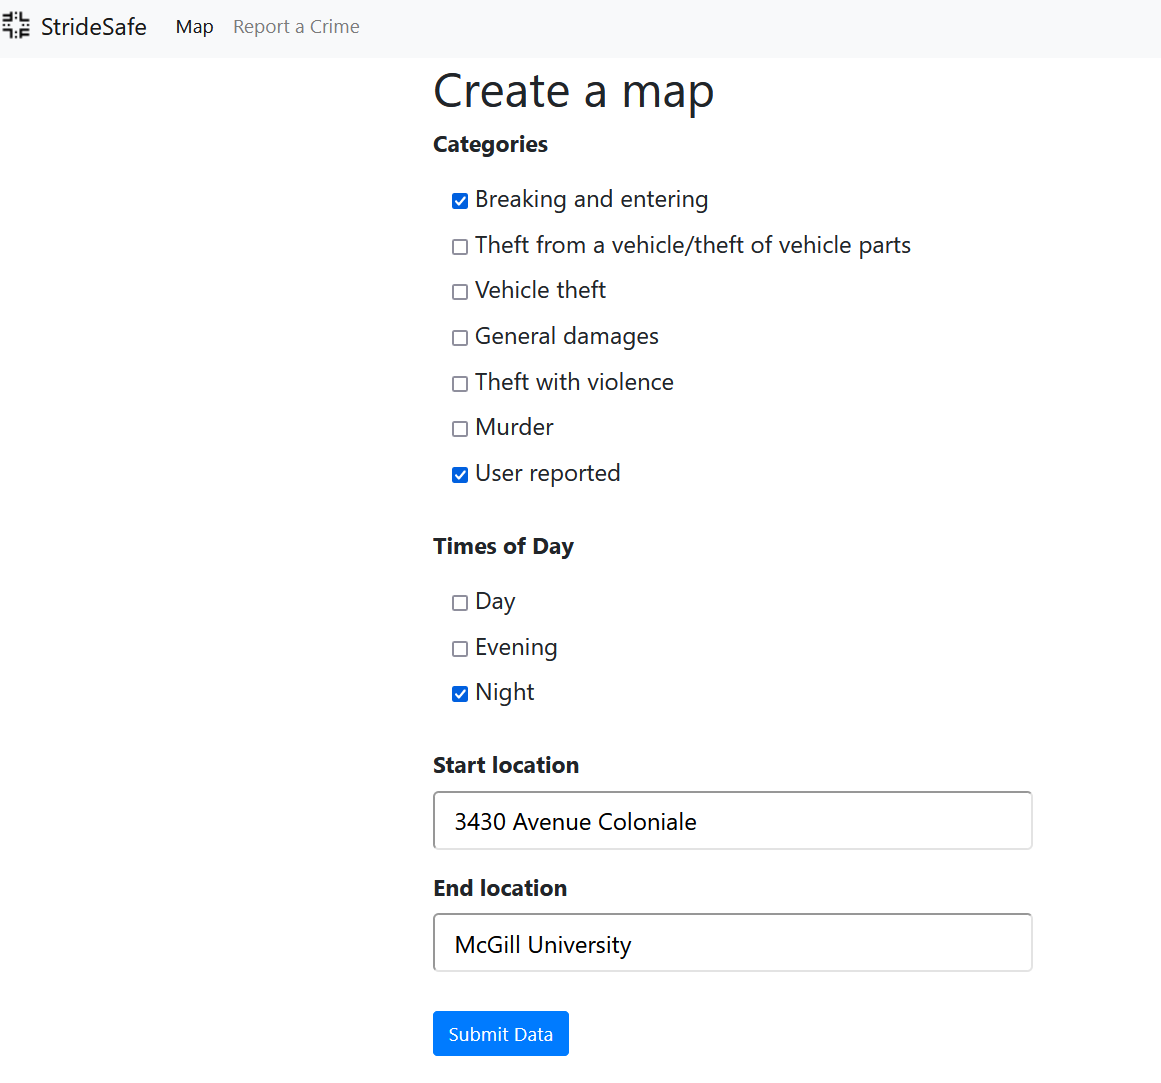
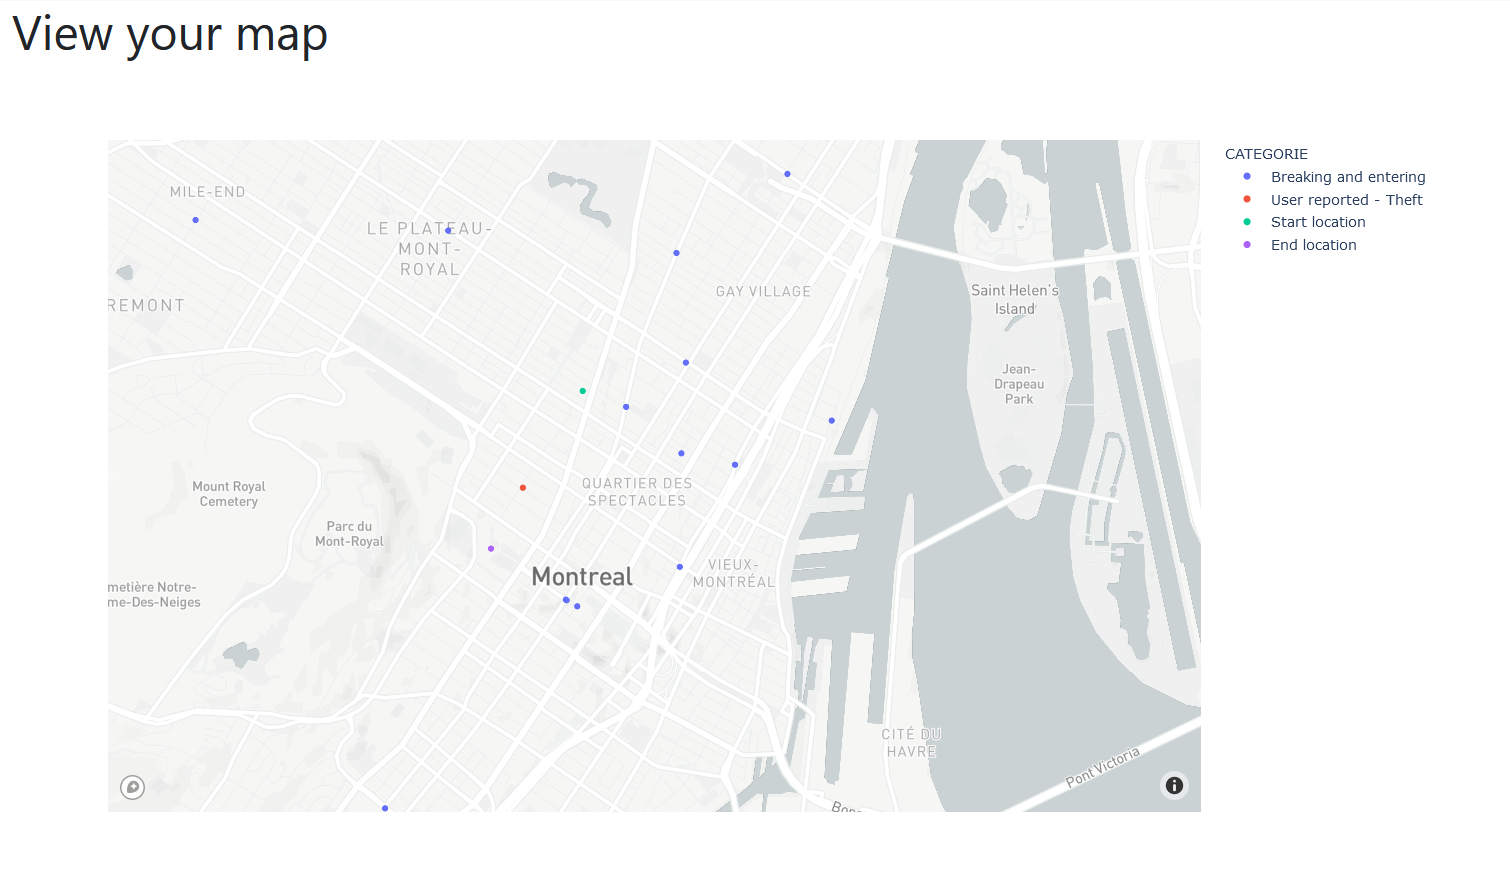
StrideSafe provides users with a map of crimes in Montreal. It also provides a form to report a crime to be added to the map. The type of crime and the time of day can be filtered on a menu prior to viewing the map.
How we built it
We used the Python library Flask to design our back-end. The database from the API is processed with Pandas, then a map is generated with Plotly (a Python library for Mapbox). The site is designed using HTML and CSS.
Challenges we ran into
We had trouble designing our crime filters on the map with Plotly. We had to find work-arounds for certain Plotly features, such as overlapping datapoints being seen as only one point.
Accomplishments that we're proud of
We are proud of the user-reported crimes feature. Not only can users view Montreals crimes on a map, but they can report their own events. That way, the map can be more reflective of the users' real life experiences than possibly irrelevant past crimes. Also, users might feel more inclined to report a crime on our site than to the police.
What we learned
We reinforced our experience in front-end development and in data science.
What's next for StrideSafe
We are hoping to create turn our website into a mobile app so users can access it from anywhere.

Log in or sign up for Devpost to join the conversation.