-
-
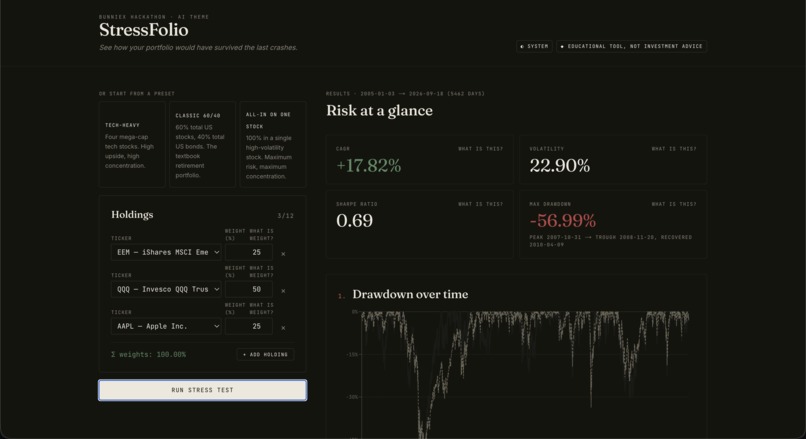
Homepage
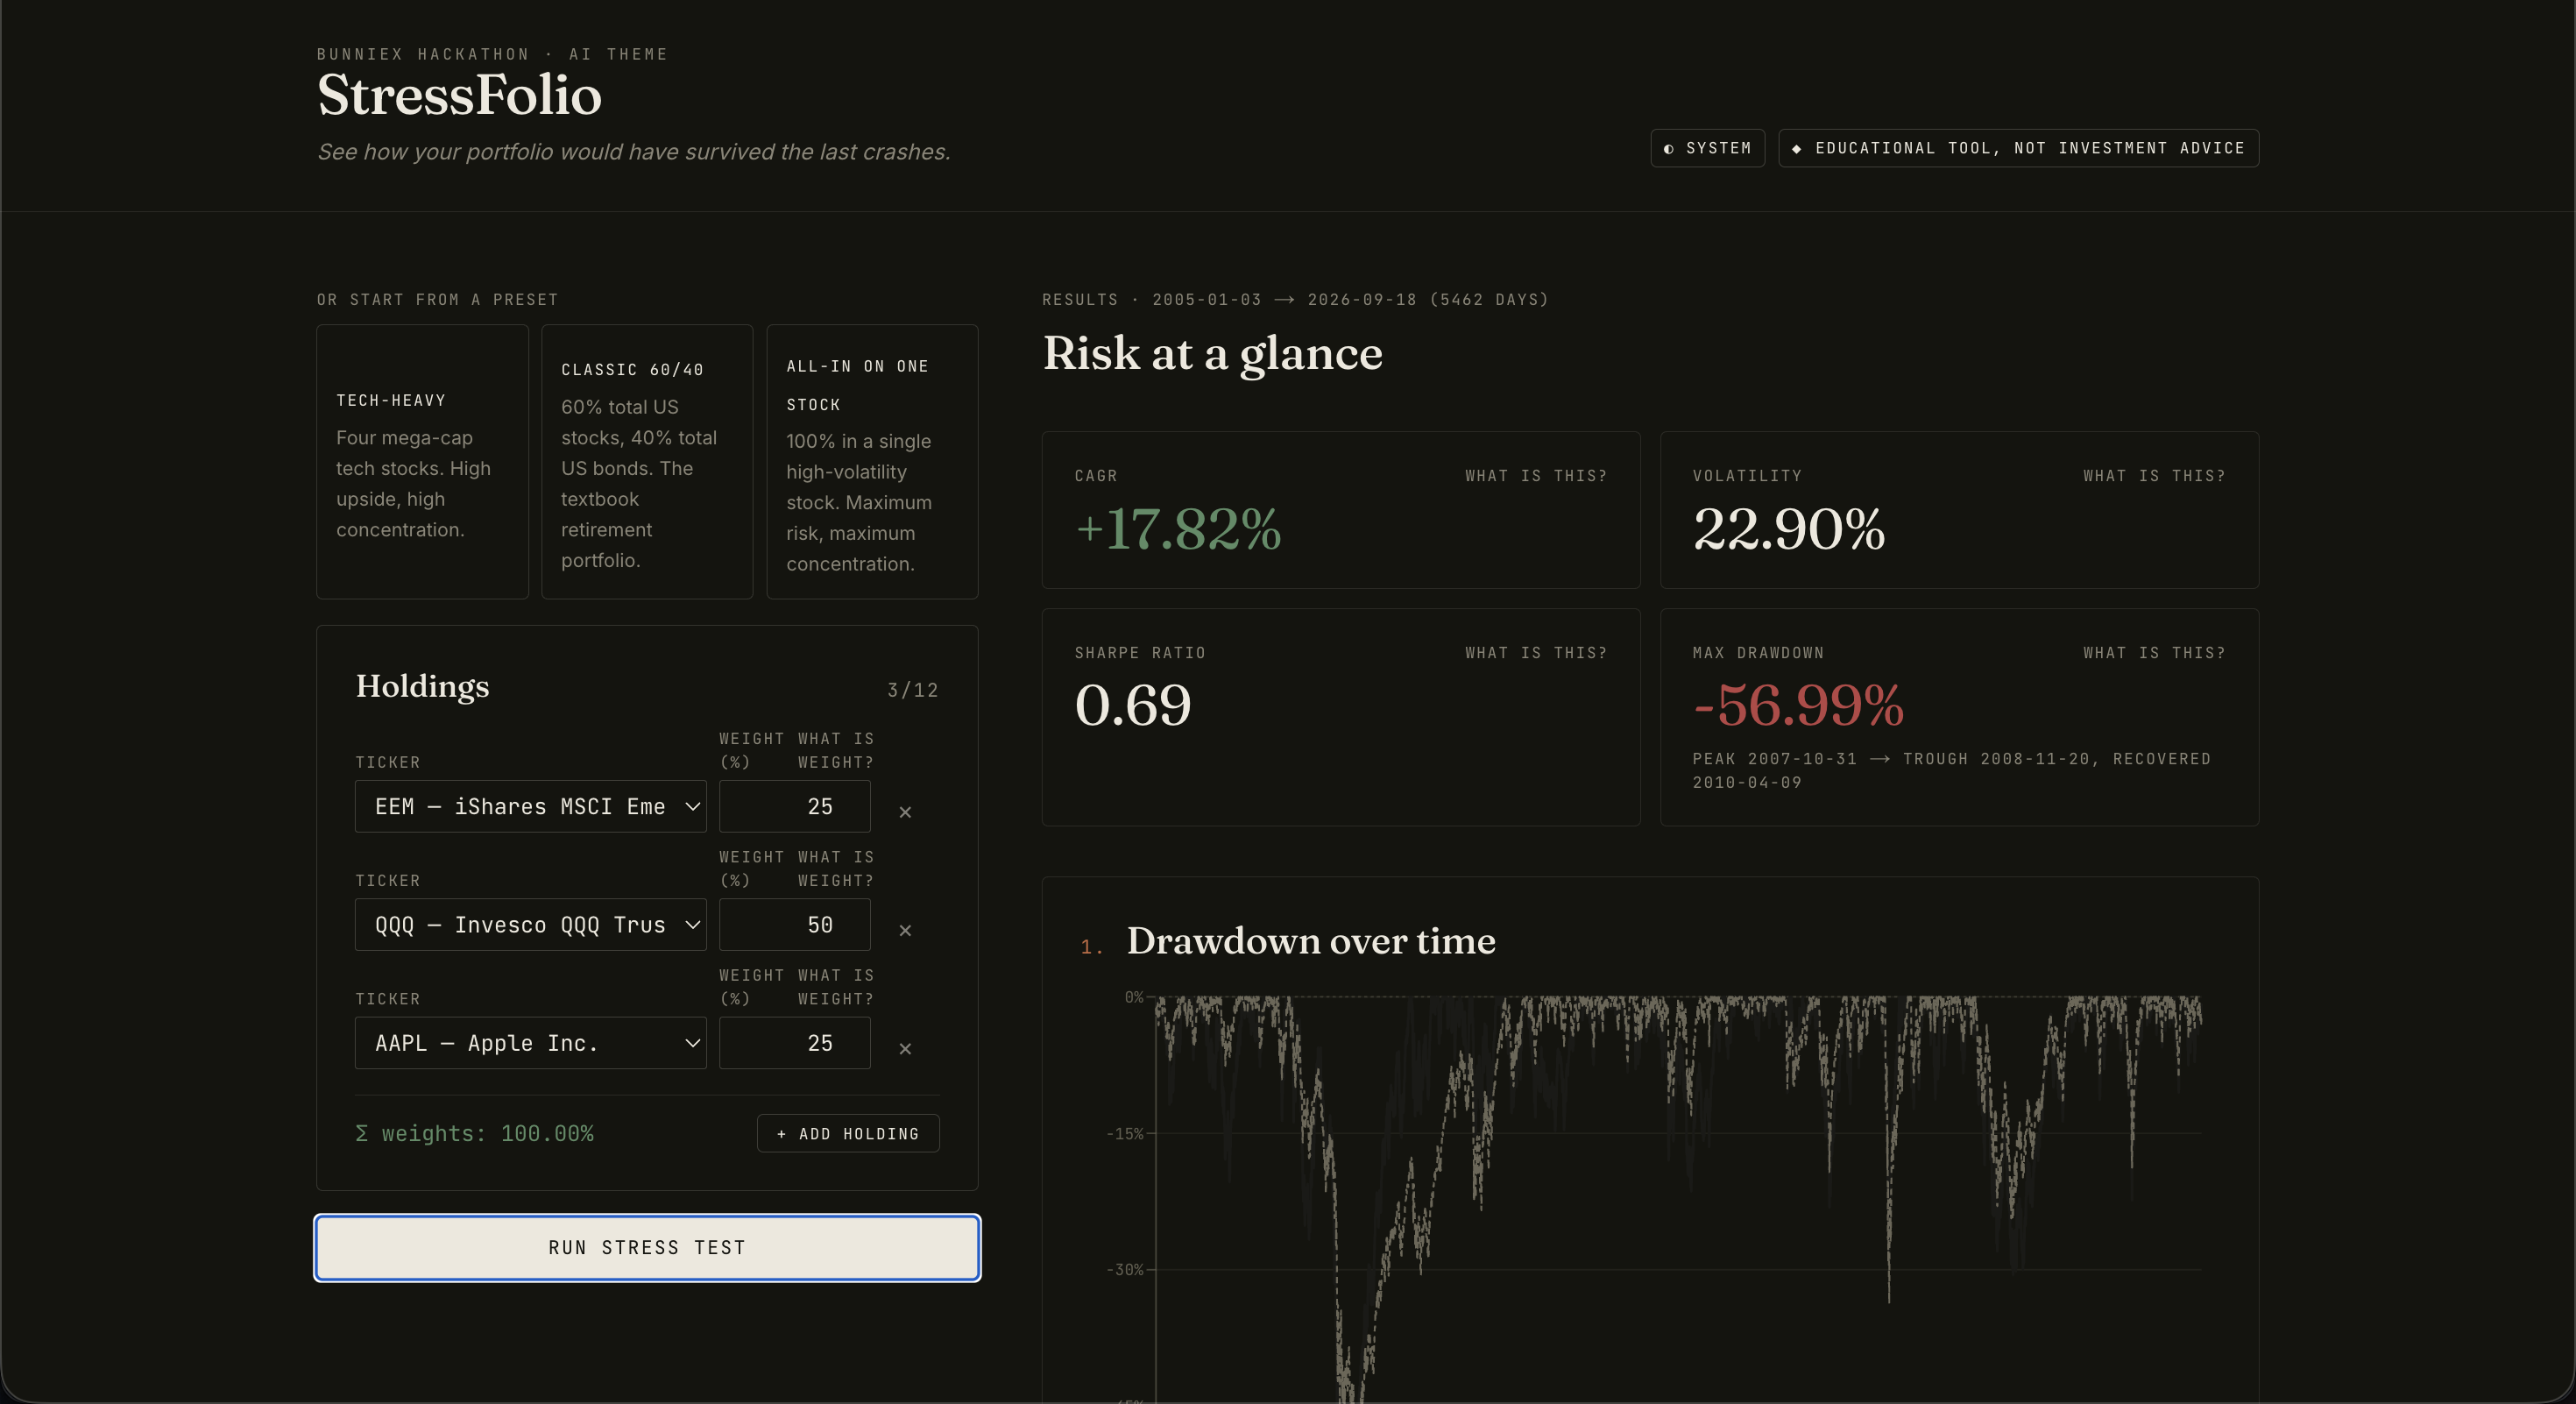
Inspiration
Investing courses teach diversification, volatility, and drawdown as abstract ideas. Beginners nod along, then build a portfolio of a few tech stocks and an ETF without ever seeing what those concepts mean for their own money. We wanted to close that gap: take the portfolio someone actually holds and show them, using real historical prices, how it would have behaved in the worst moments of the last two decades.
What it does
StressFolio lets a beginner enter their holdings (tickers and weights) and instantly see:
- Risk metrics computed from real price history: annualized return, volatility, Sharpe ratio, and maximum drawdown
- Crash replays: how the same portfolio would have performed in the 2007-09 financial crisis, the 2020 COVID crash, and the 2022 bear market, next to the S&P 500
- A drawdown chart and a correlation heatmap showing how the holdings move together
- Risk flags such as single-stock concentration or highly correlated holdings
- A plain-language explanation of the top three risks, mapped to the concepts a course would teach (diversification, concentration risk, risk management)
StressFolio is an educational tool. It never recommends buying or selling anything.
The key idea: numbers by code, words by AI
A language model can sound confident while getting numbers wrong. So in StressFolio, every number is computed by deterministic code from historical prices. The LLM receives only the finished metrics and is instructed to explain them, never to calculate, invent, or change them. If the AI call fails, the app falls back to a template explanation built from the risk flags, so it keeps working.
How we built it
The metrics use standard definitions. Every number in the app comes from these formulas, computed in code from historical prices:
Portfolio daily return    r_p = sum of (weight_i x return_i)
Volatility (annualized)   sigma = std(r_p) x sqrt(252)
Sharpe ratio              (CAGR - risk-free rate) / sigma
Max drawdown              min over time of (value / running peak value - 1)
Concentration (HHI)       sum of weight_i squared
Effective # of holdings   1 / HHI
Challenges we ran into
- Uneven price history. Some holdings did not exist during the 2008 crisis. Instead of inventing data, StressFolio excludes those holdings from that replay, renormalizes the remaining weights, and states exactly what was excluded. If too little of the portfolio has history, the window is marked "insufficient history".
- Keeping the AI honest. We constrained the model to the supplied numbers, validated its output against a schema, and added a retry and a deterministic fallback.
- Making assumptions visible. The metrics assume daily rebalancing to target weights, and the crash replays assume buy-and-hold. We show both assumptions in the app instead of hiding them.
- Reliability under a deadline. We cached the price data and the explanations for the demo portfolios so the app works even if a network call fails.
What we learned
The most useful design choice was separating calculation from explanation. Once the numbers were fixed by code, the AI could focus on what it does well: turning "max drawdown of -34%" into something a beginner can understand. We also learned how much a portfolio's risk depends on the period you look at: the same holdings look very different across the three crash windows.
What's next
- Live prices for any ticker
- More crash scenarios and custom date ranges
- Support for bonds, currencies, and non-US markets
- Personalized learning paths that connect each risk to the relevant lesson
- Side-by-side explanations from two different open models
Important note
StressFolio is an educational tool, not investment advice. Past performance does not predict future results.
Built With
- deepseek
- llm
- nextjs
- openai-api
- python
- react
- recharts
- tailwindcss
- typescript
- vercel
- vitest
- yfinance
- zod
