-
-
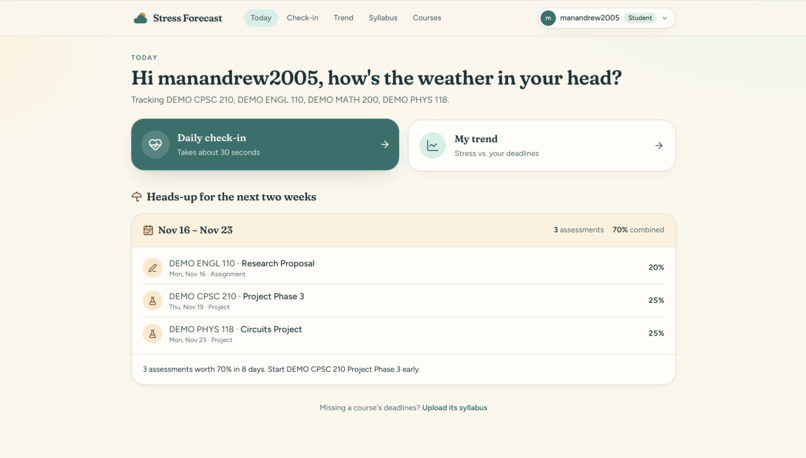
Student landing page after logging in with Auth0
-
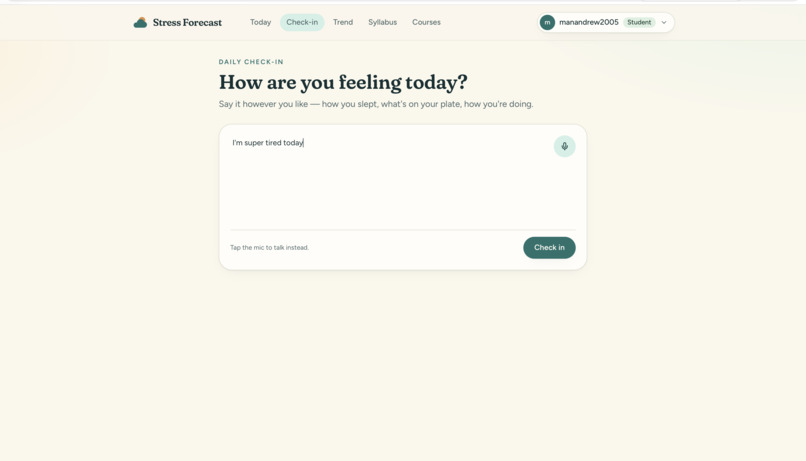
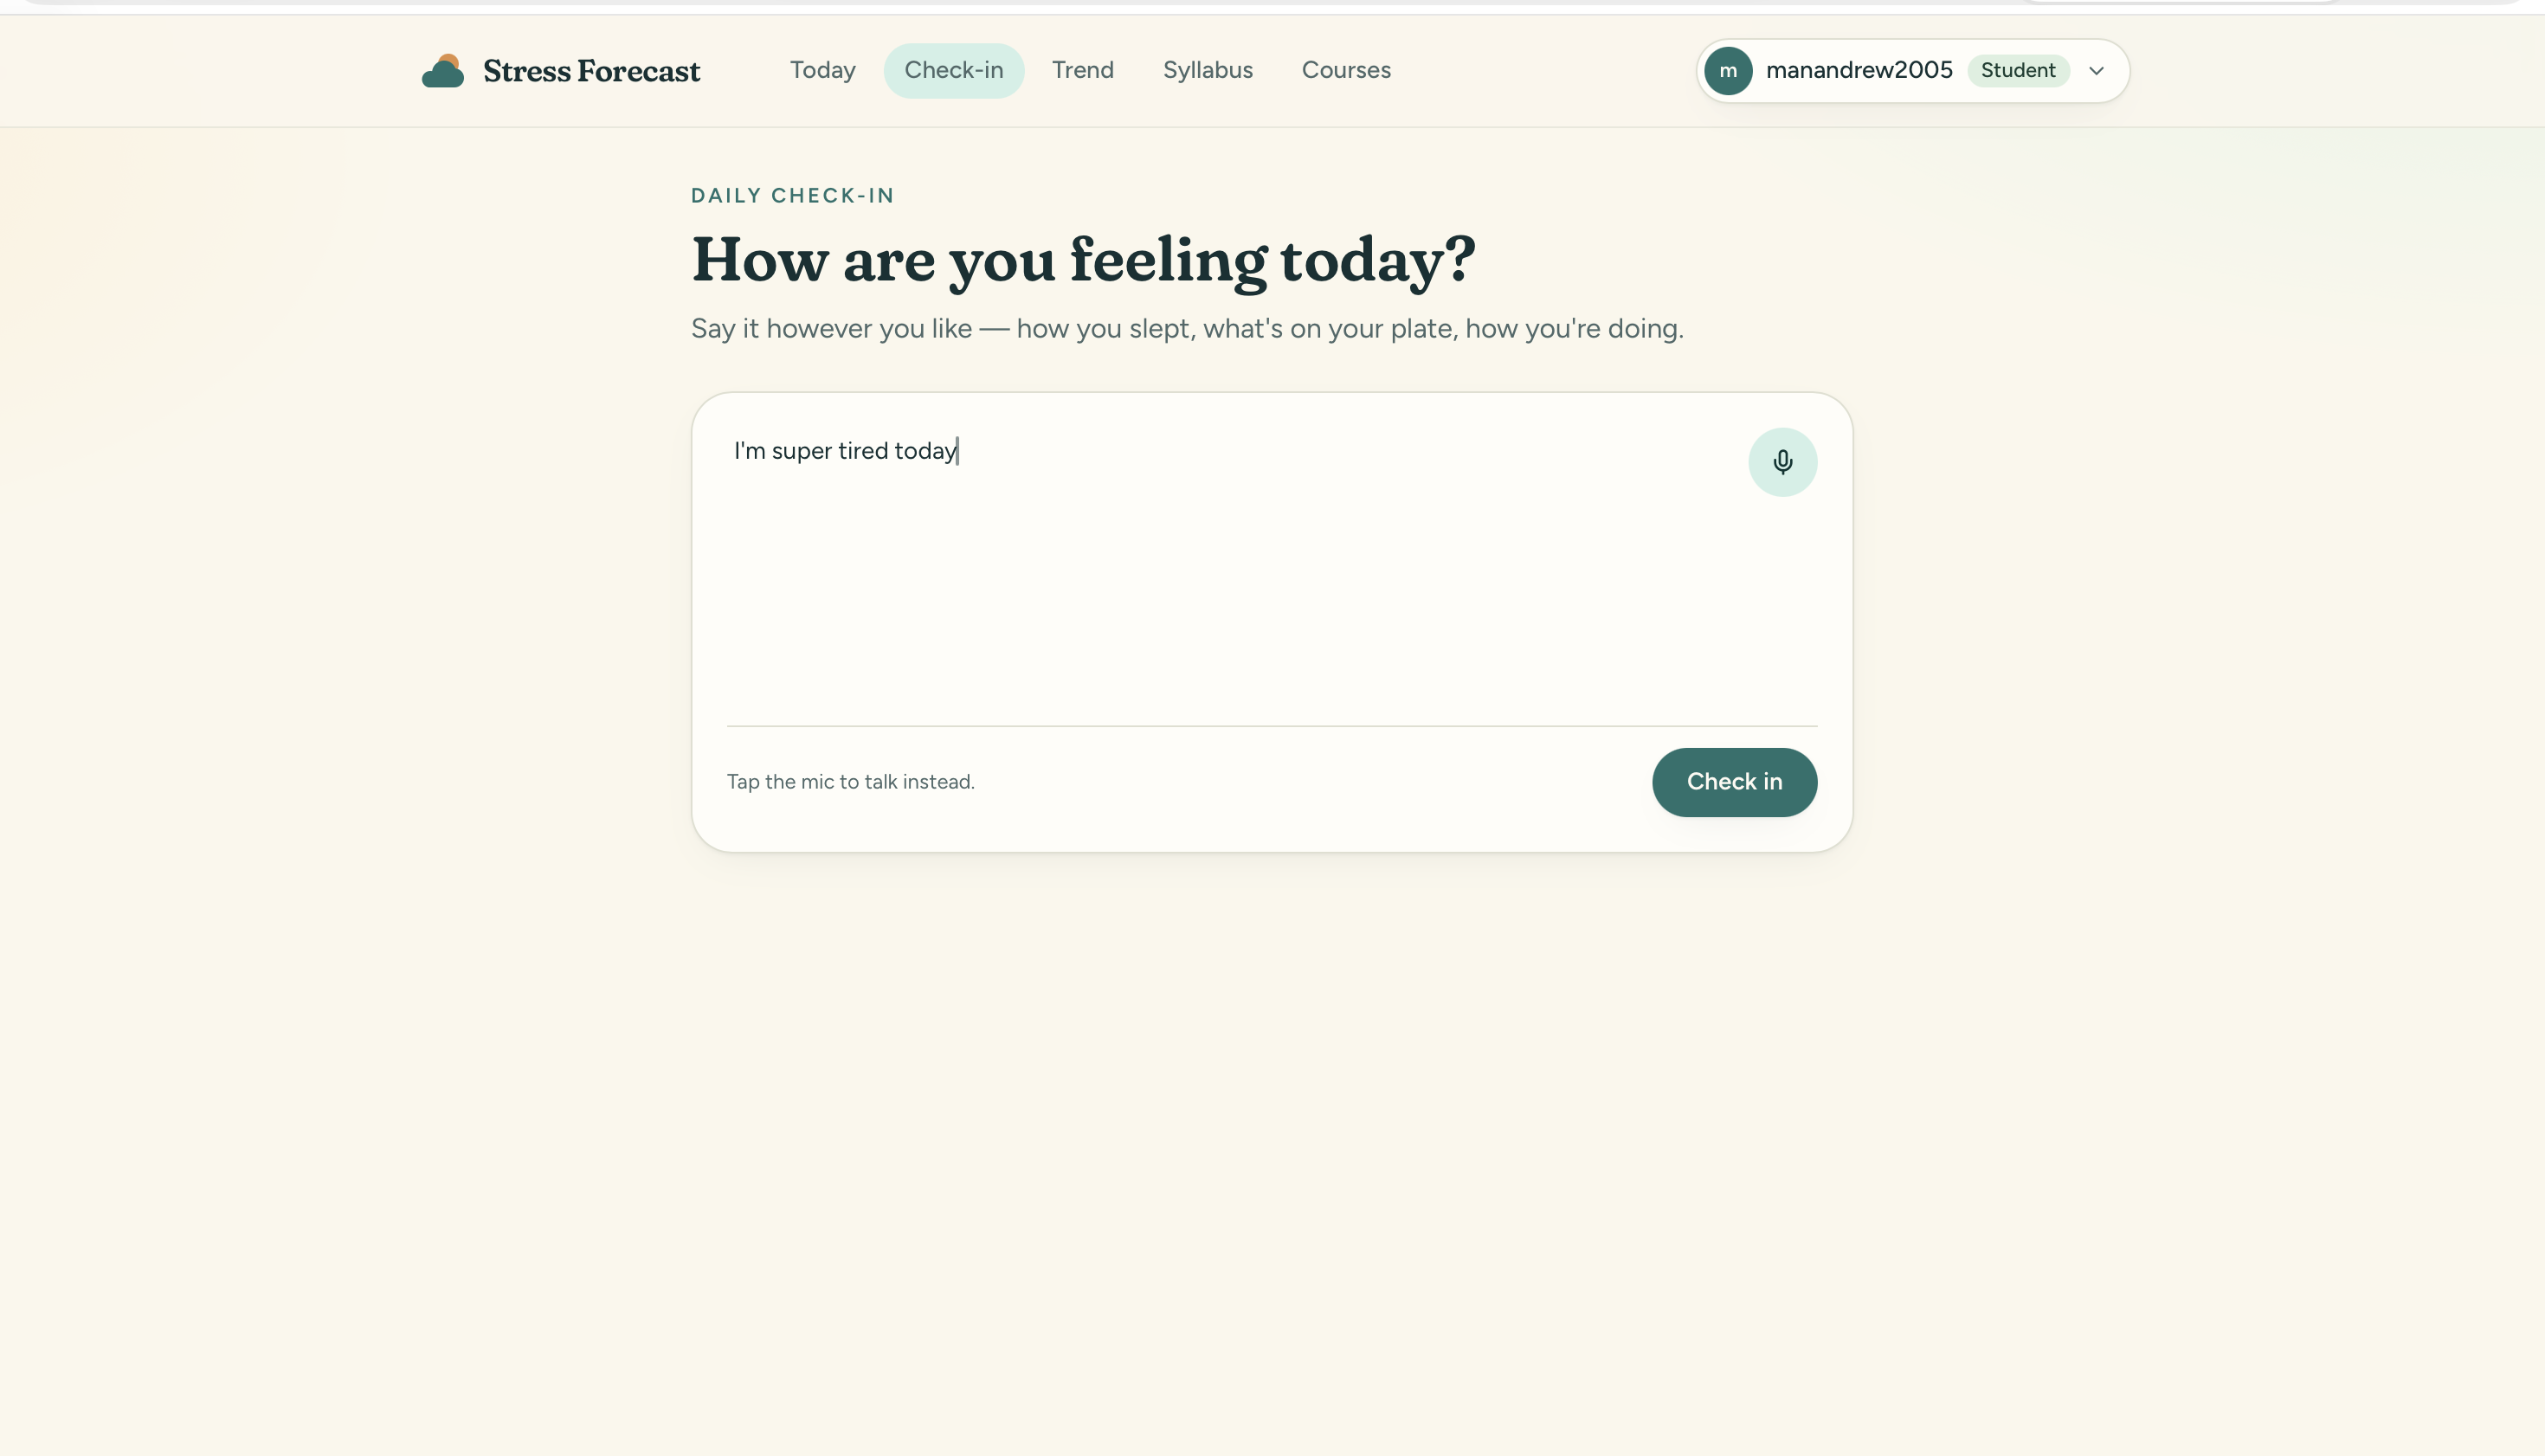
Student daily check-in using Gemini
-
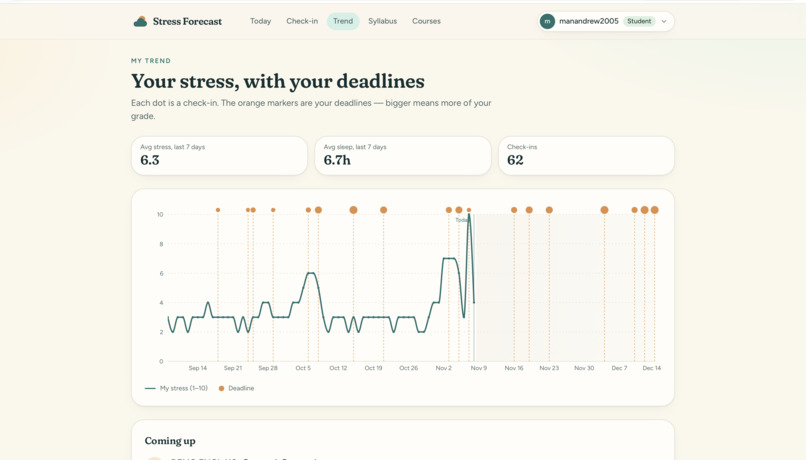
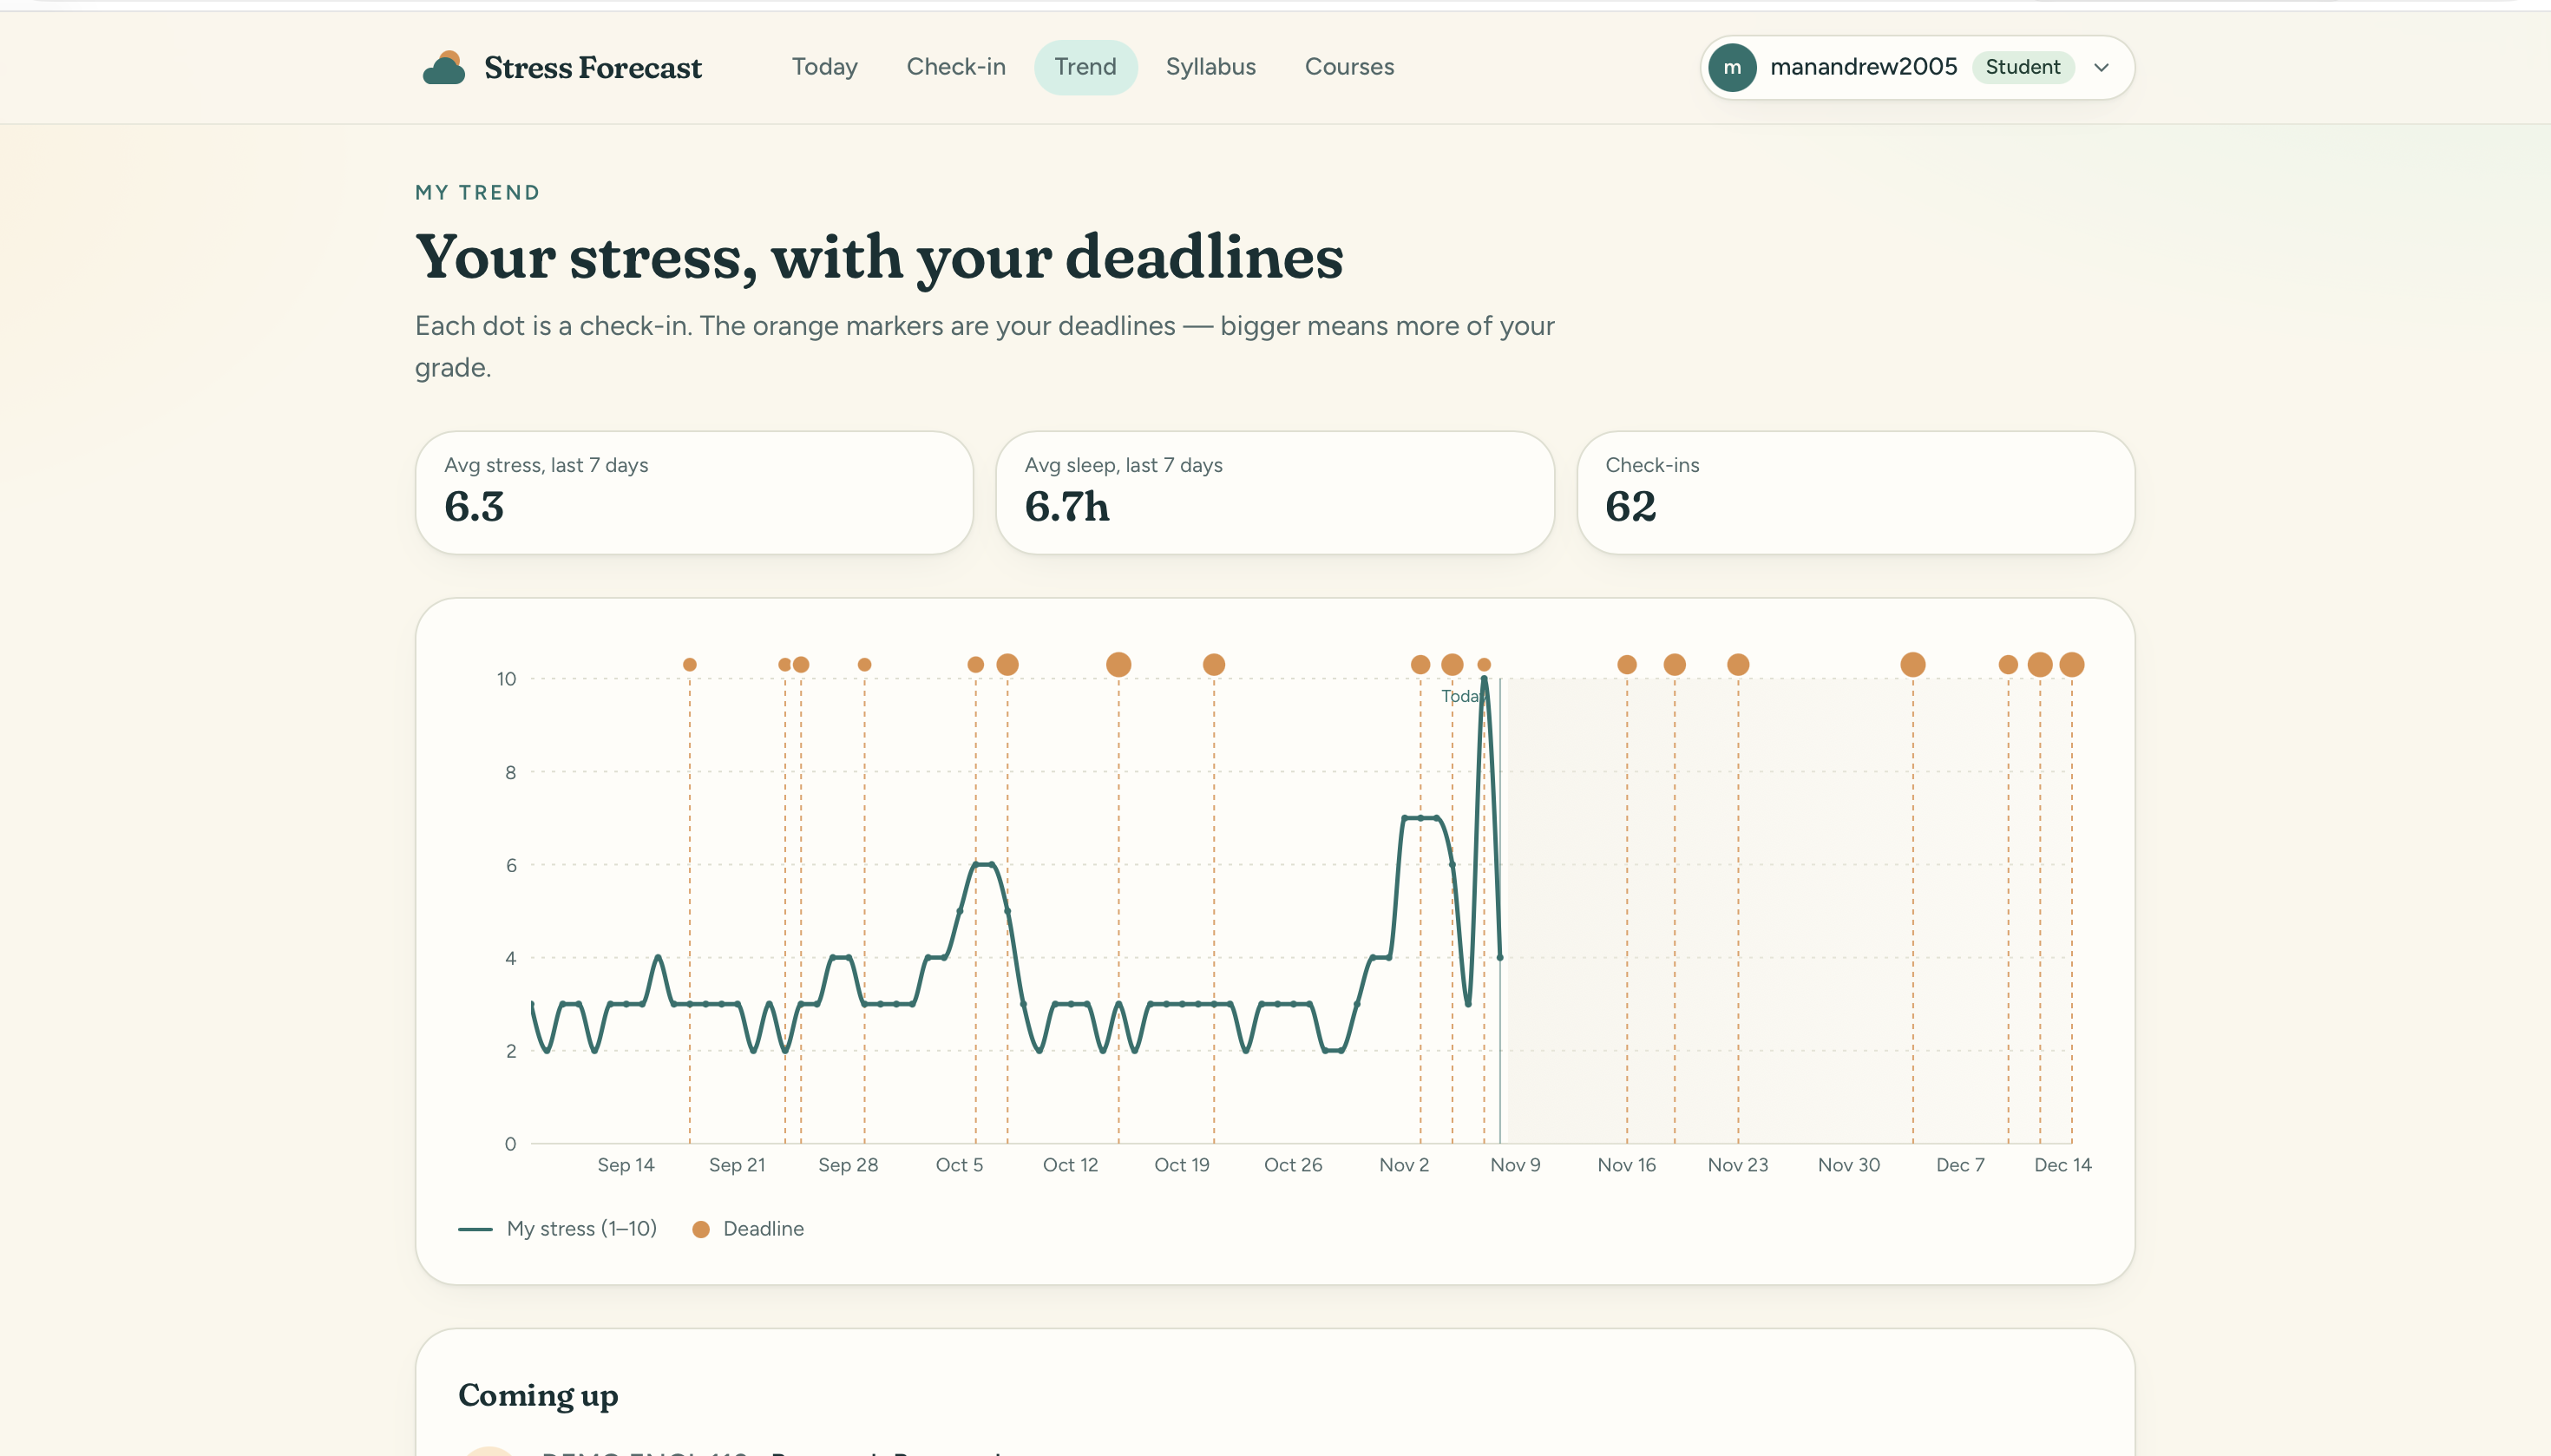
Student trend
-
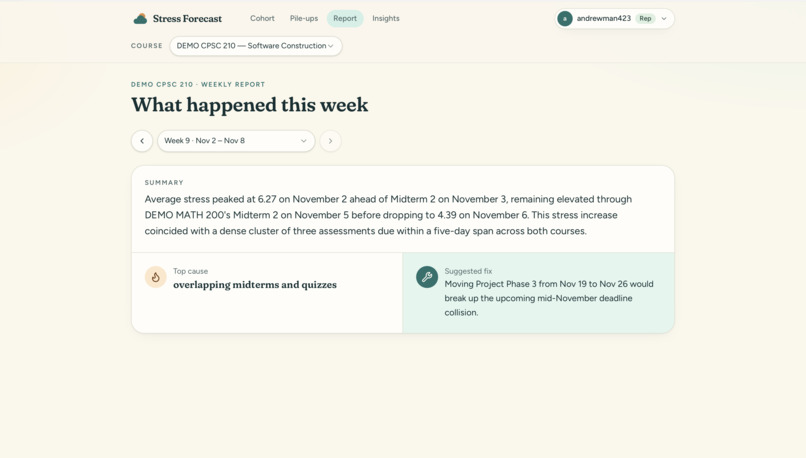
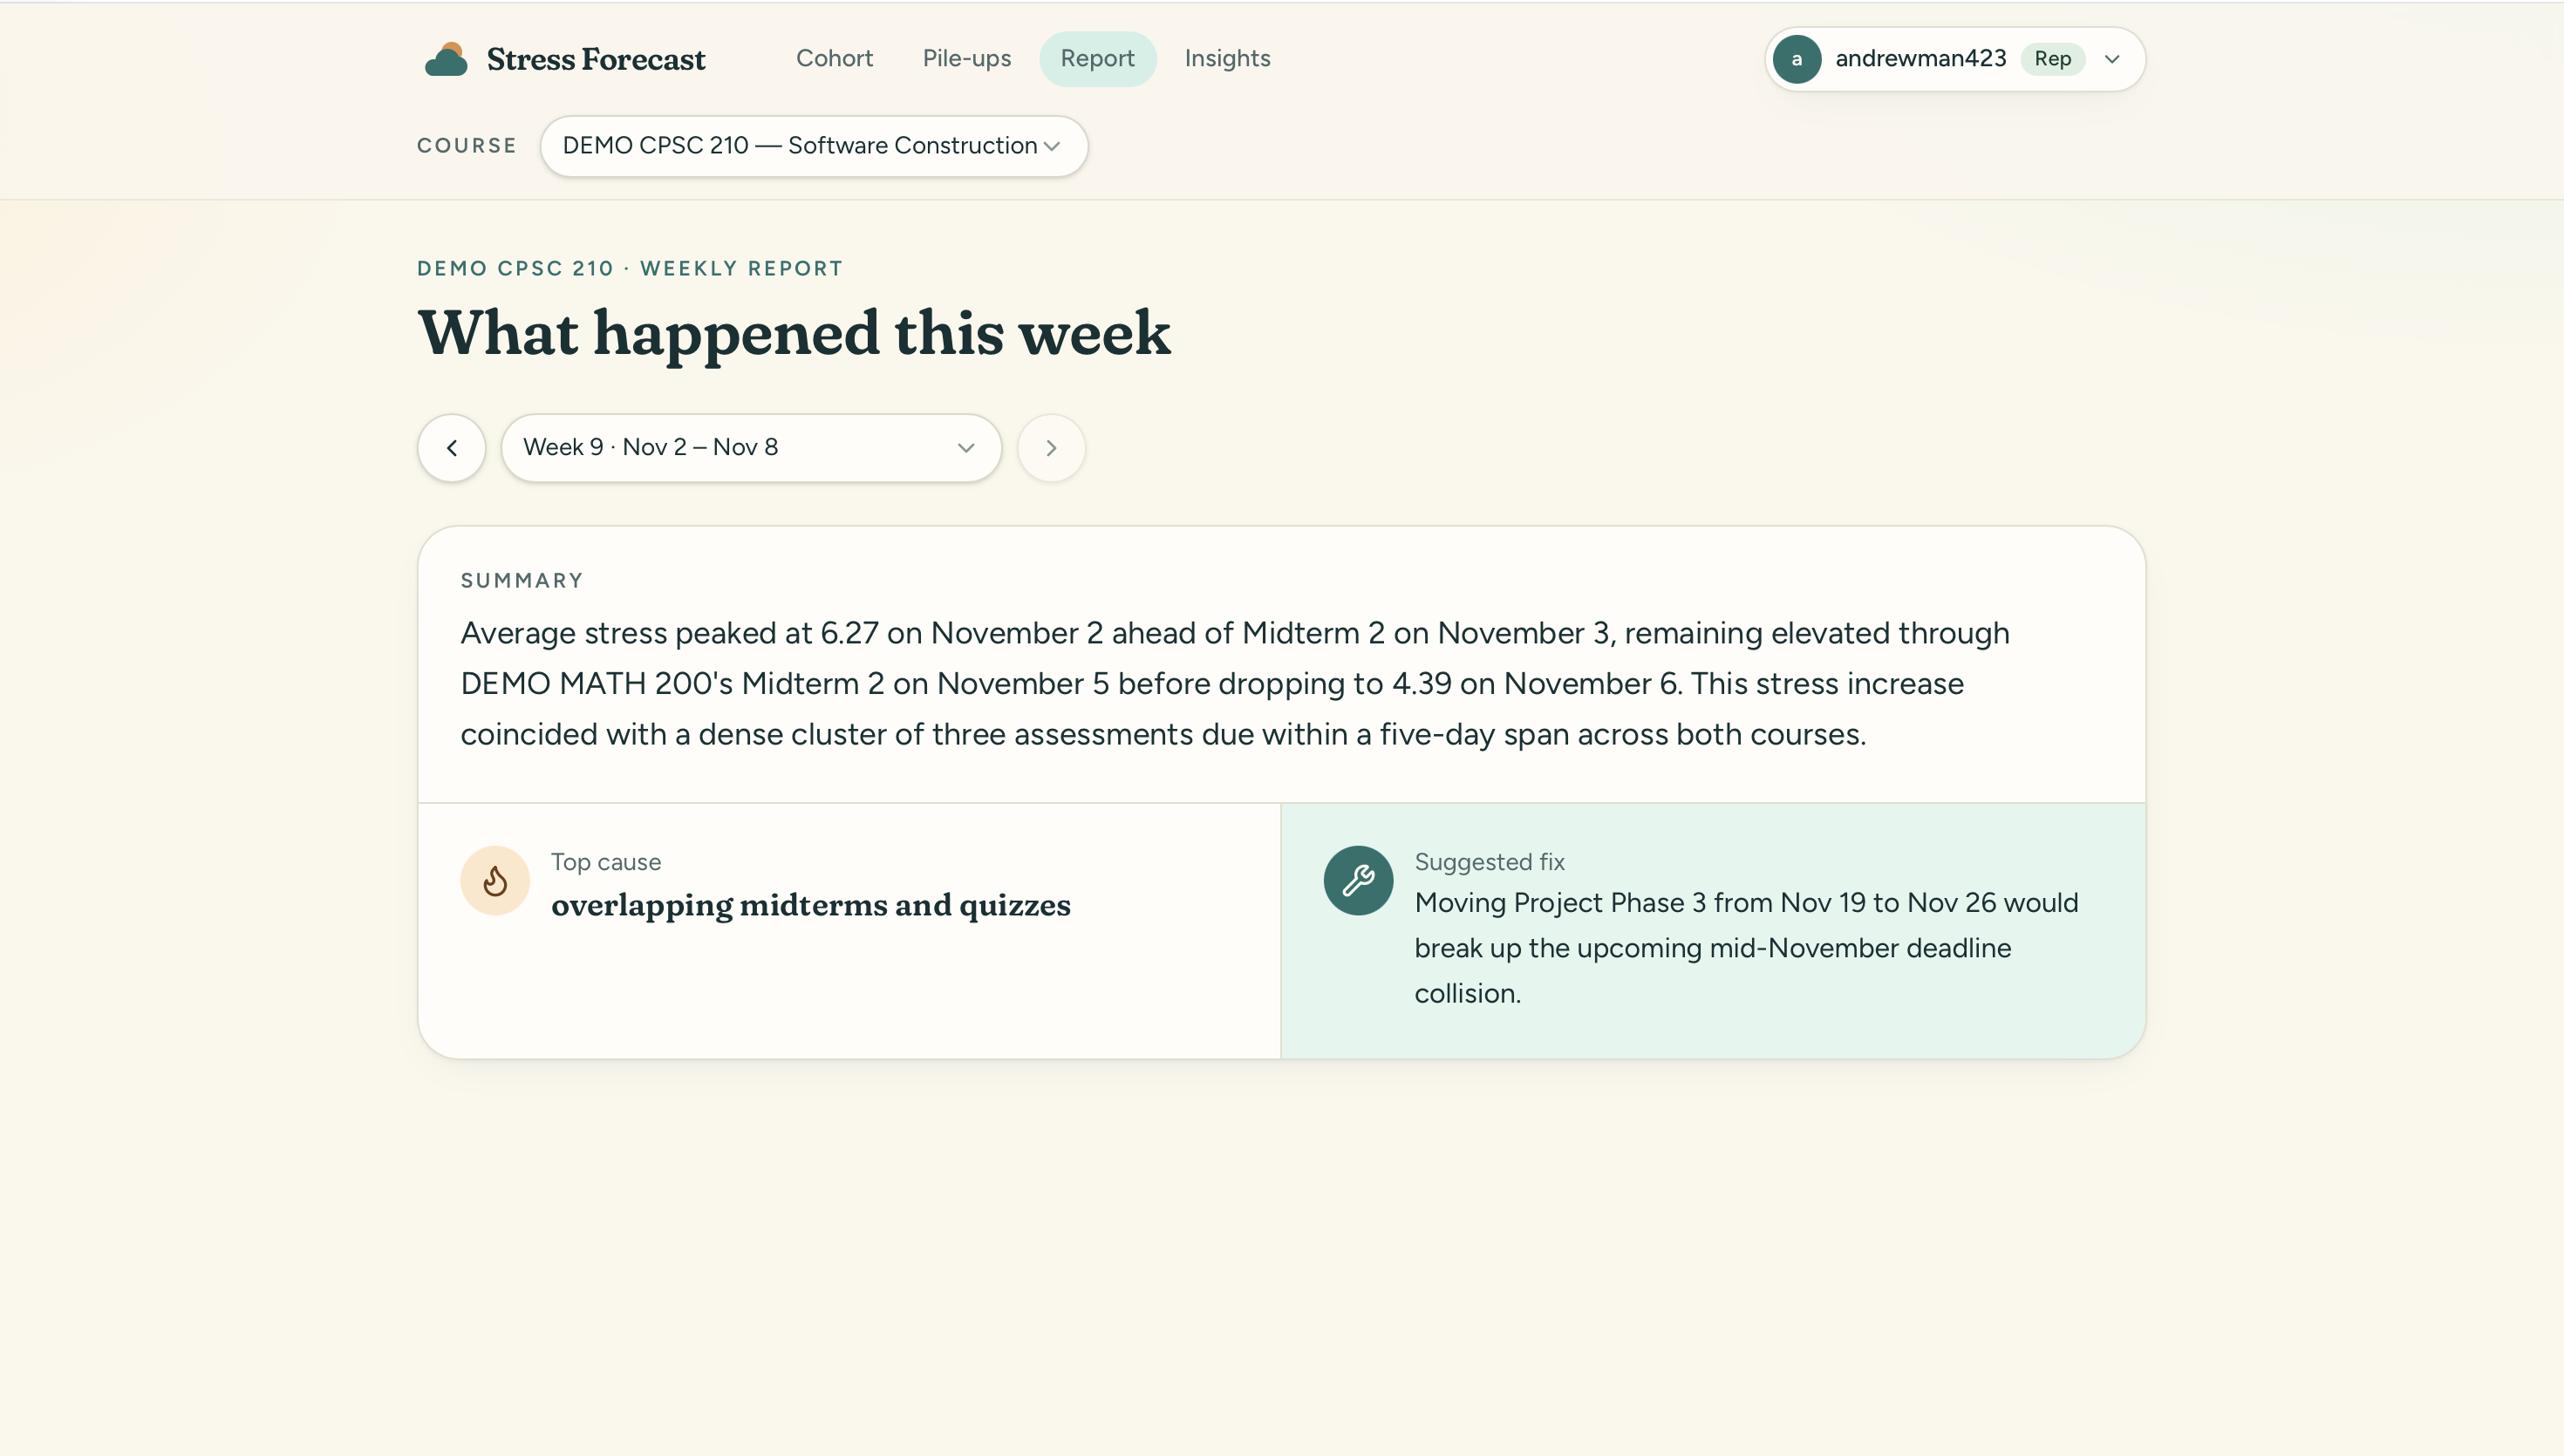
Class rep class report view made by Gemini
-
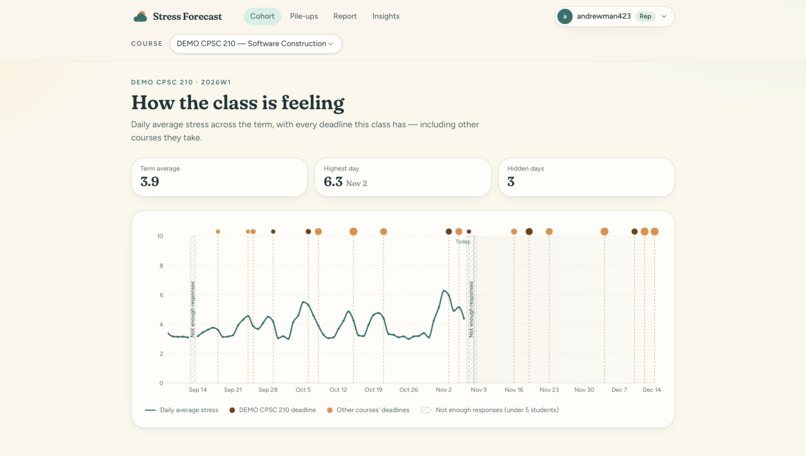
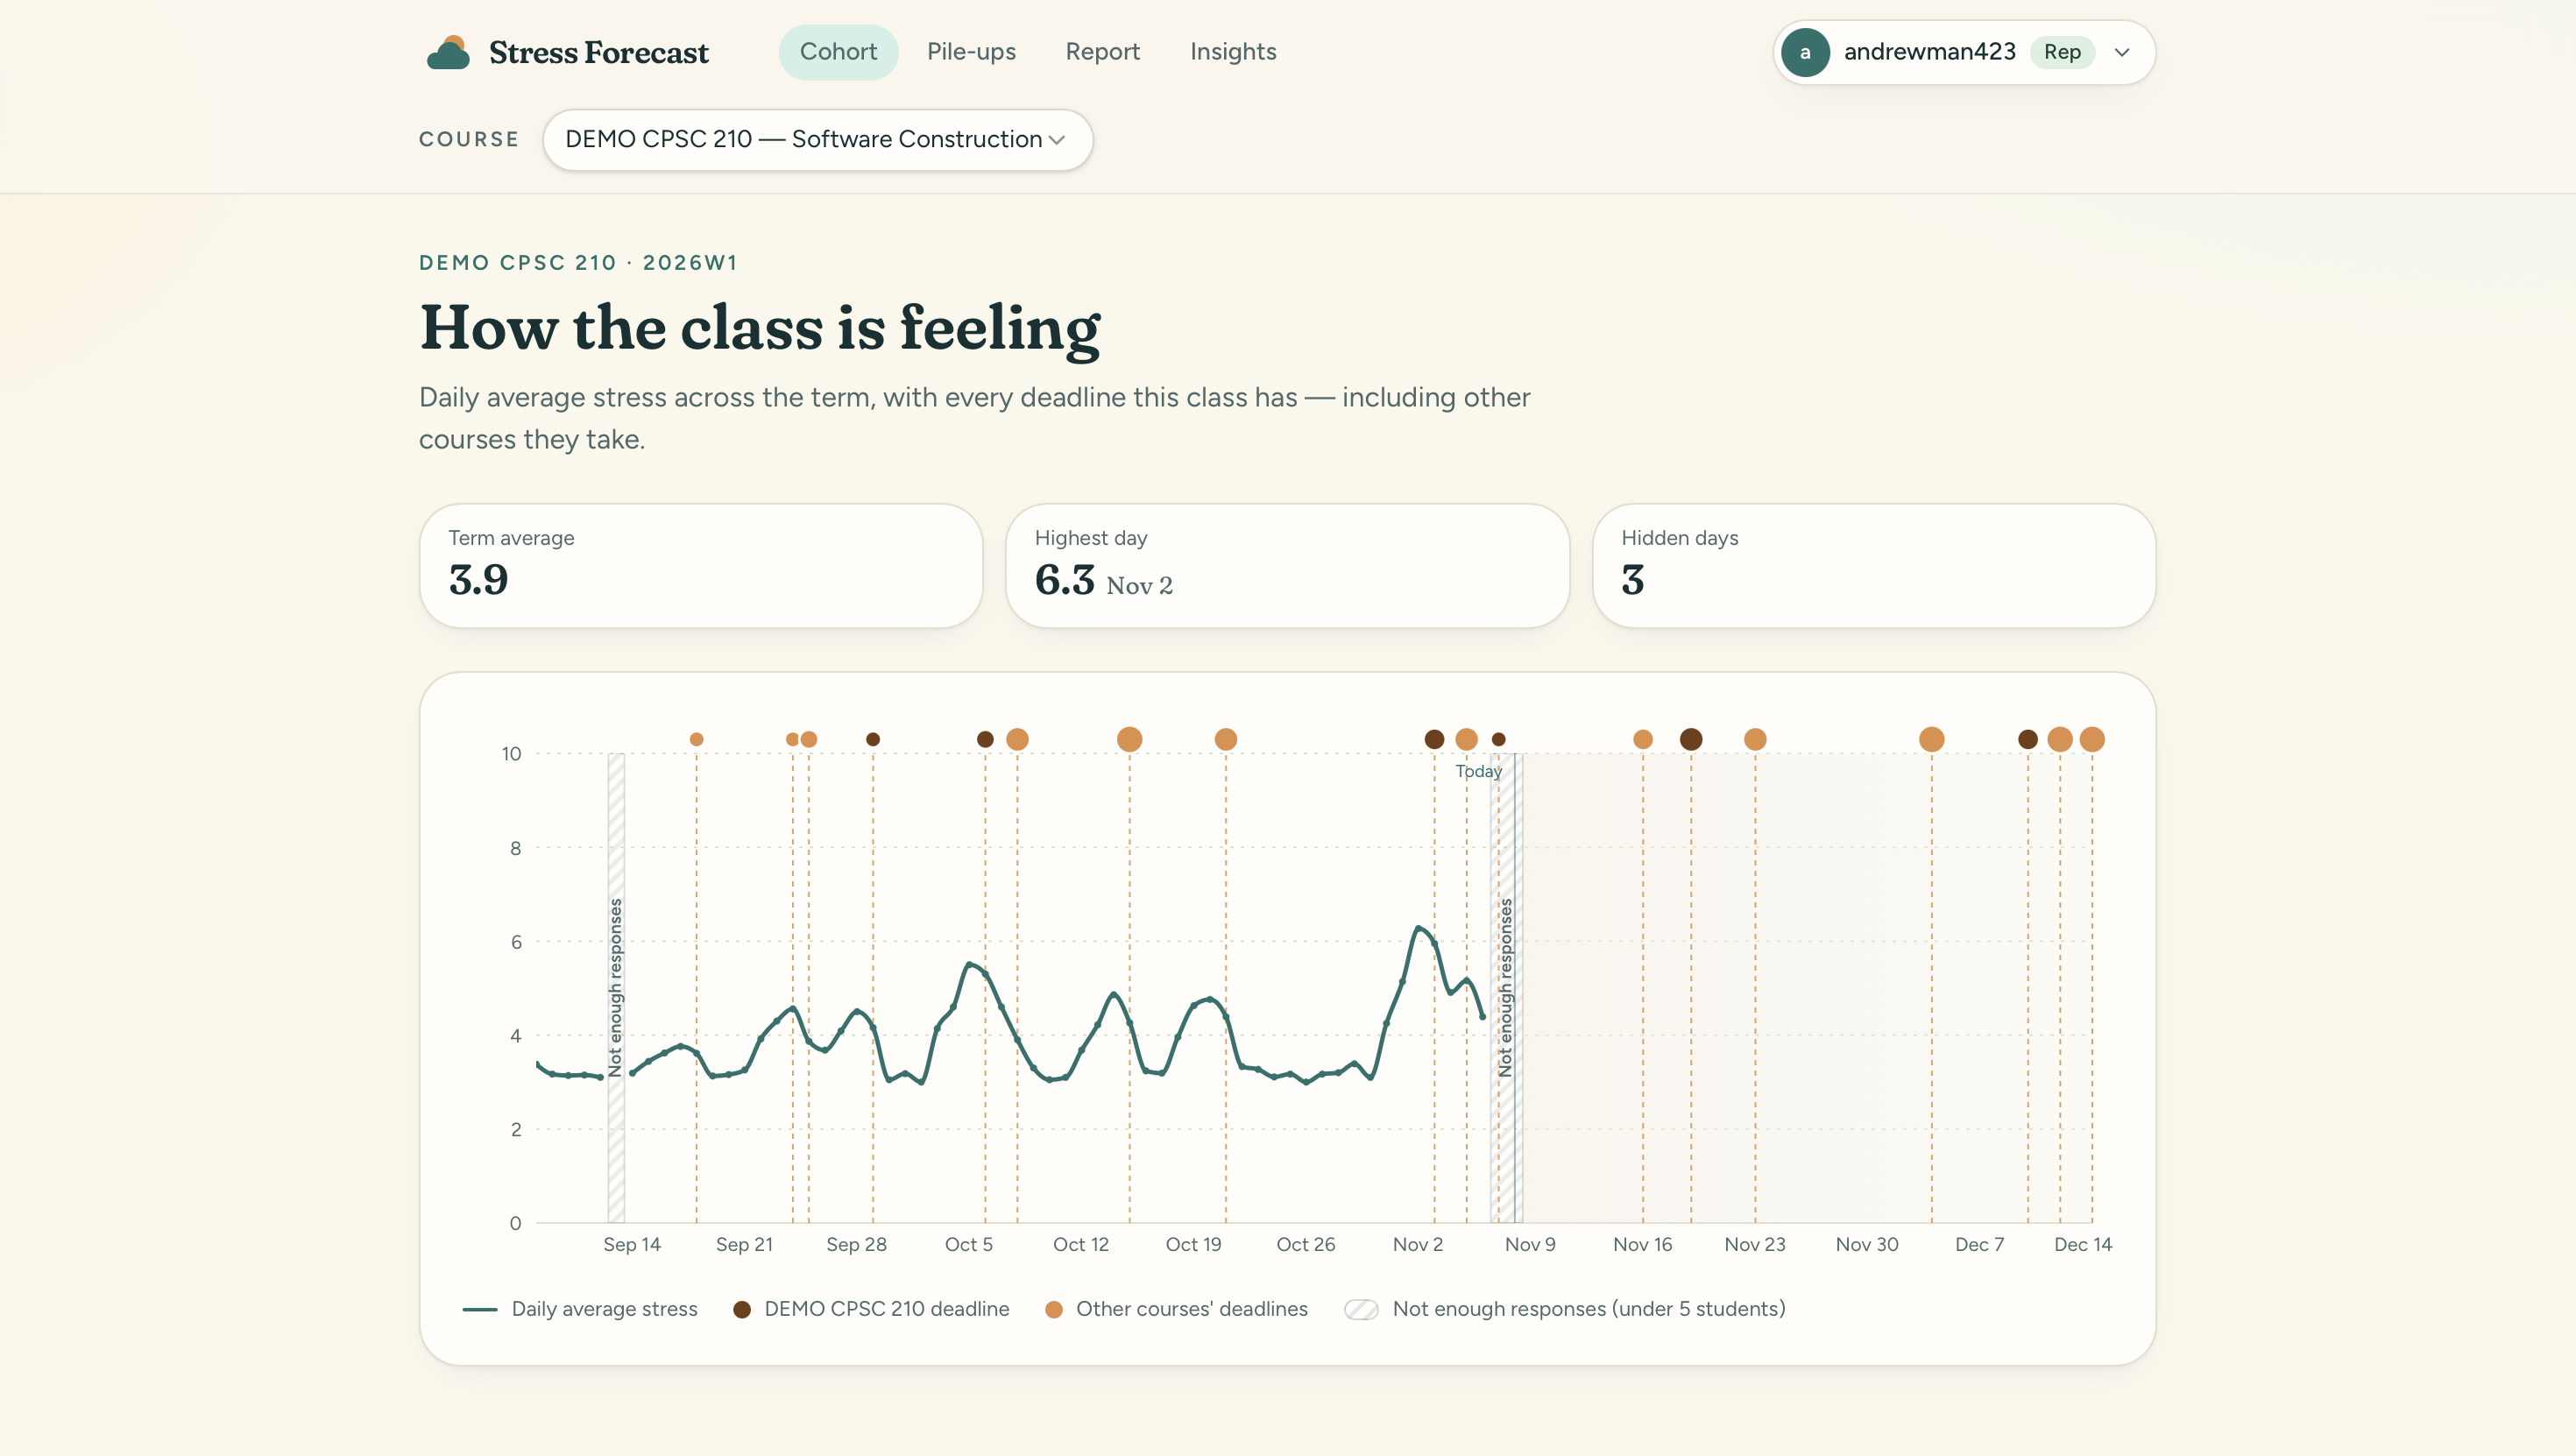
Class rep class cohort view powered by a Tiger Data (TimescaleDB) continuous aggregate over every check-in
-
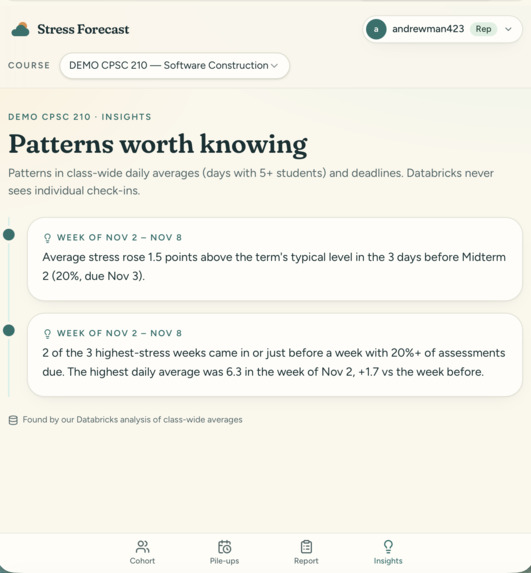
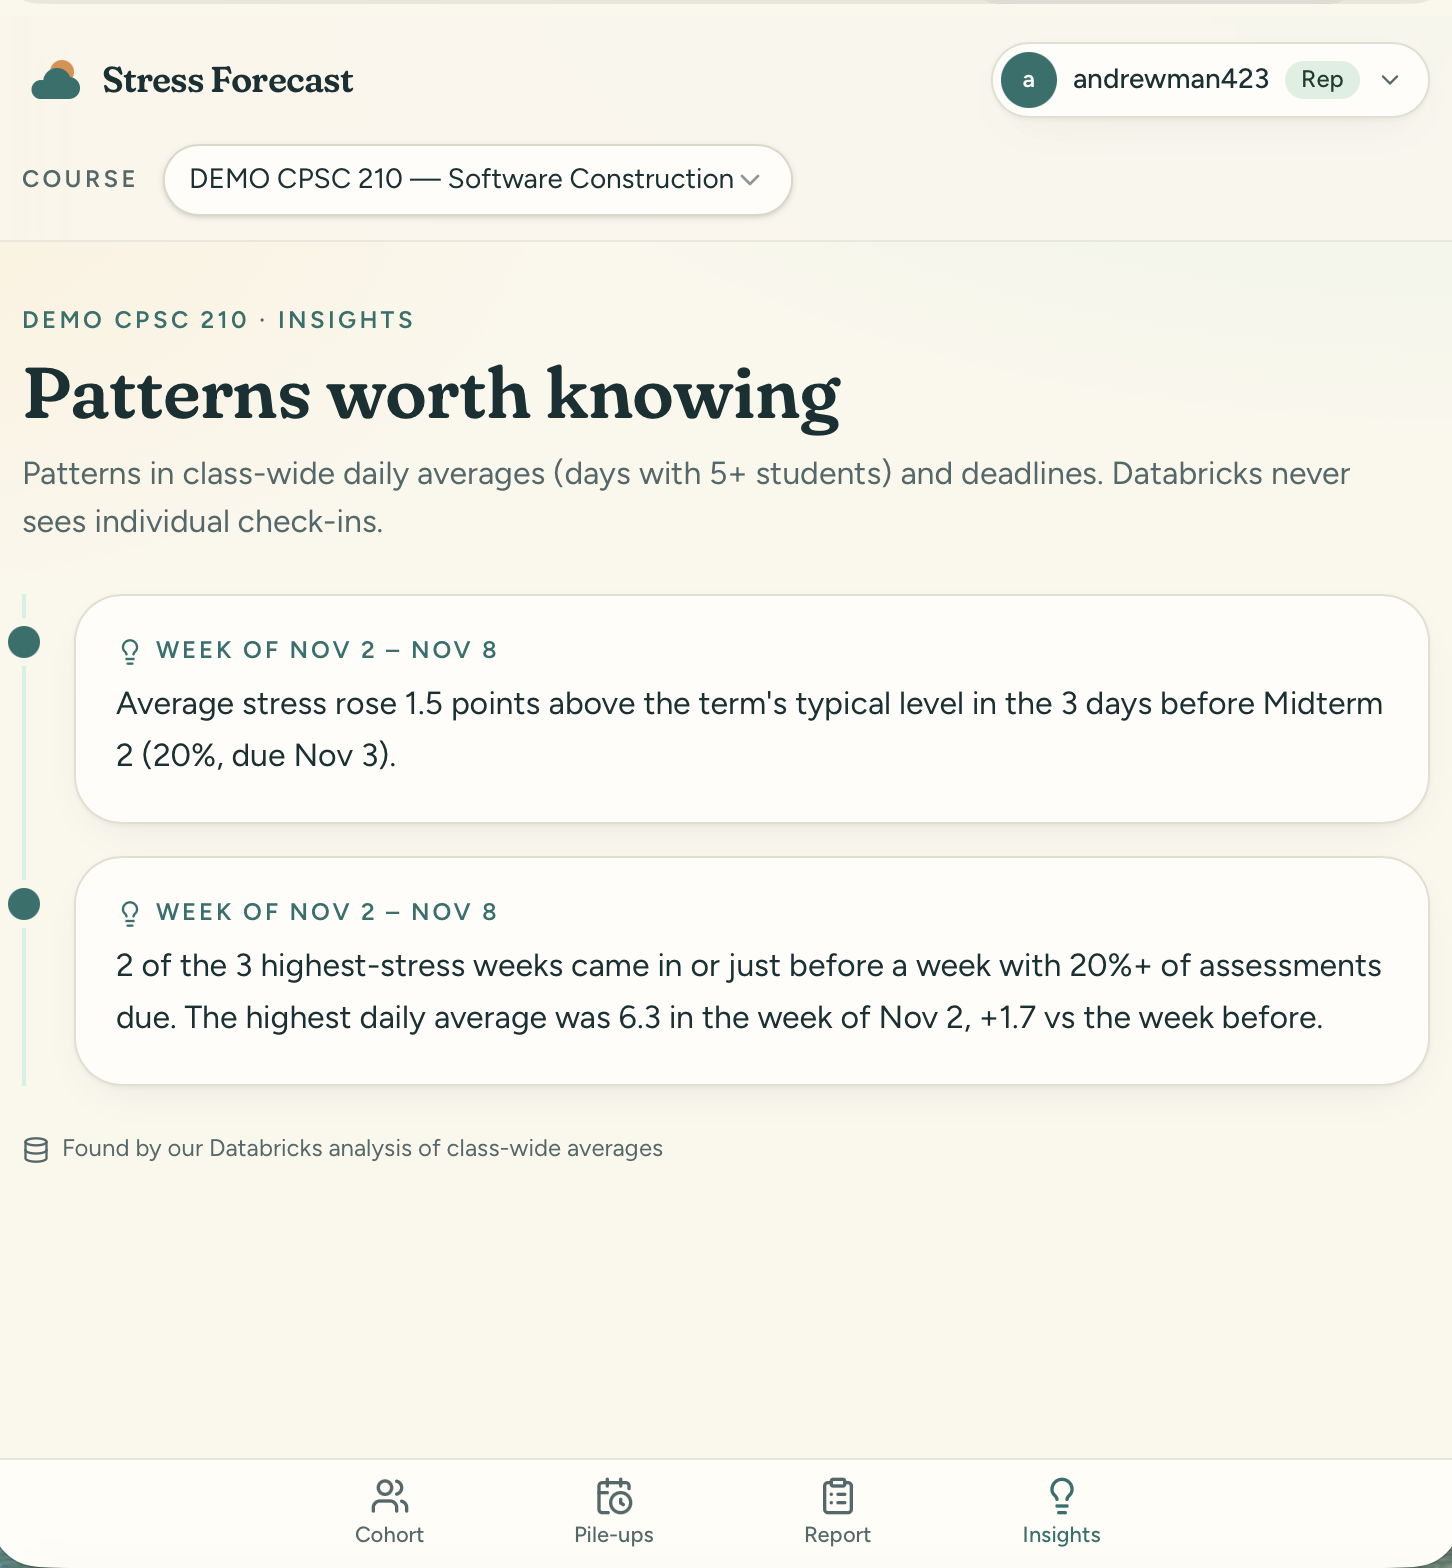
Class rep insights view
-
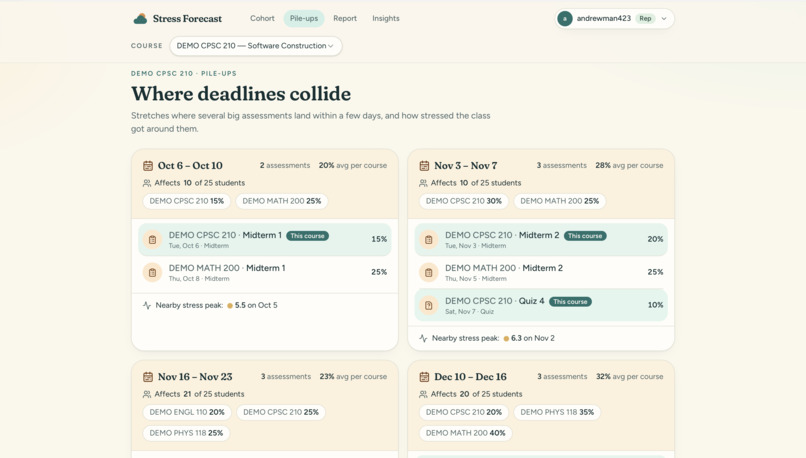
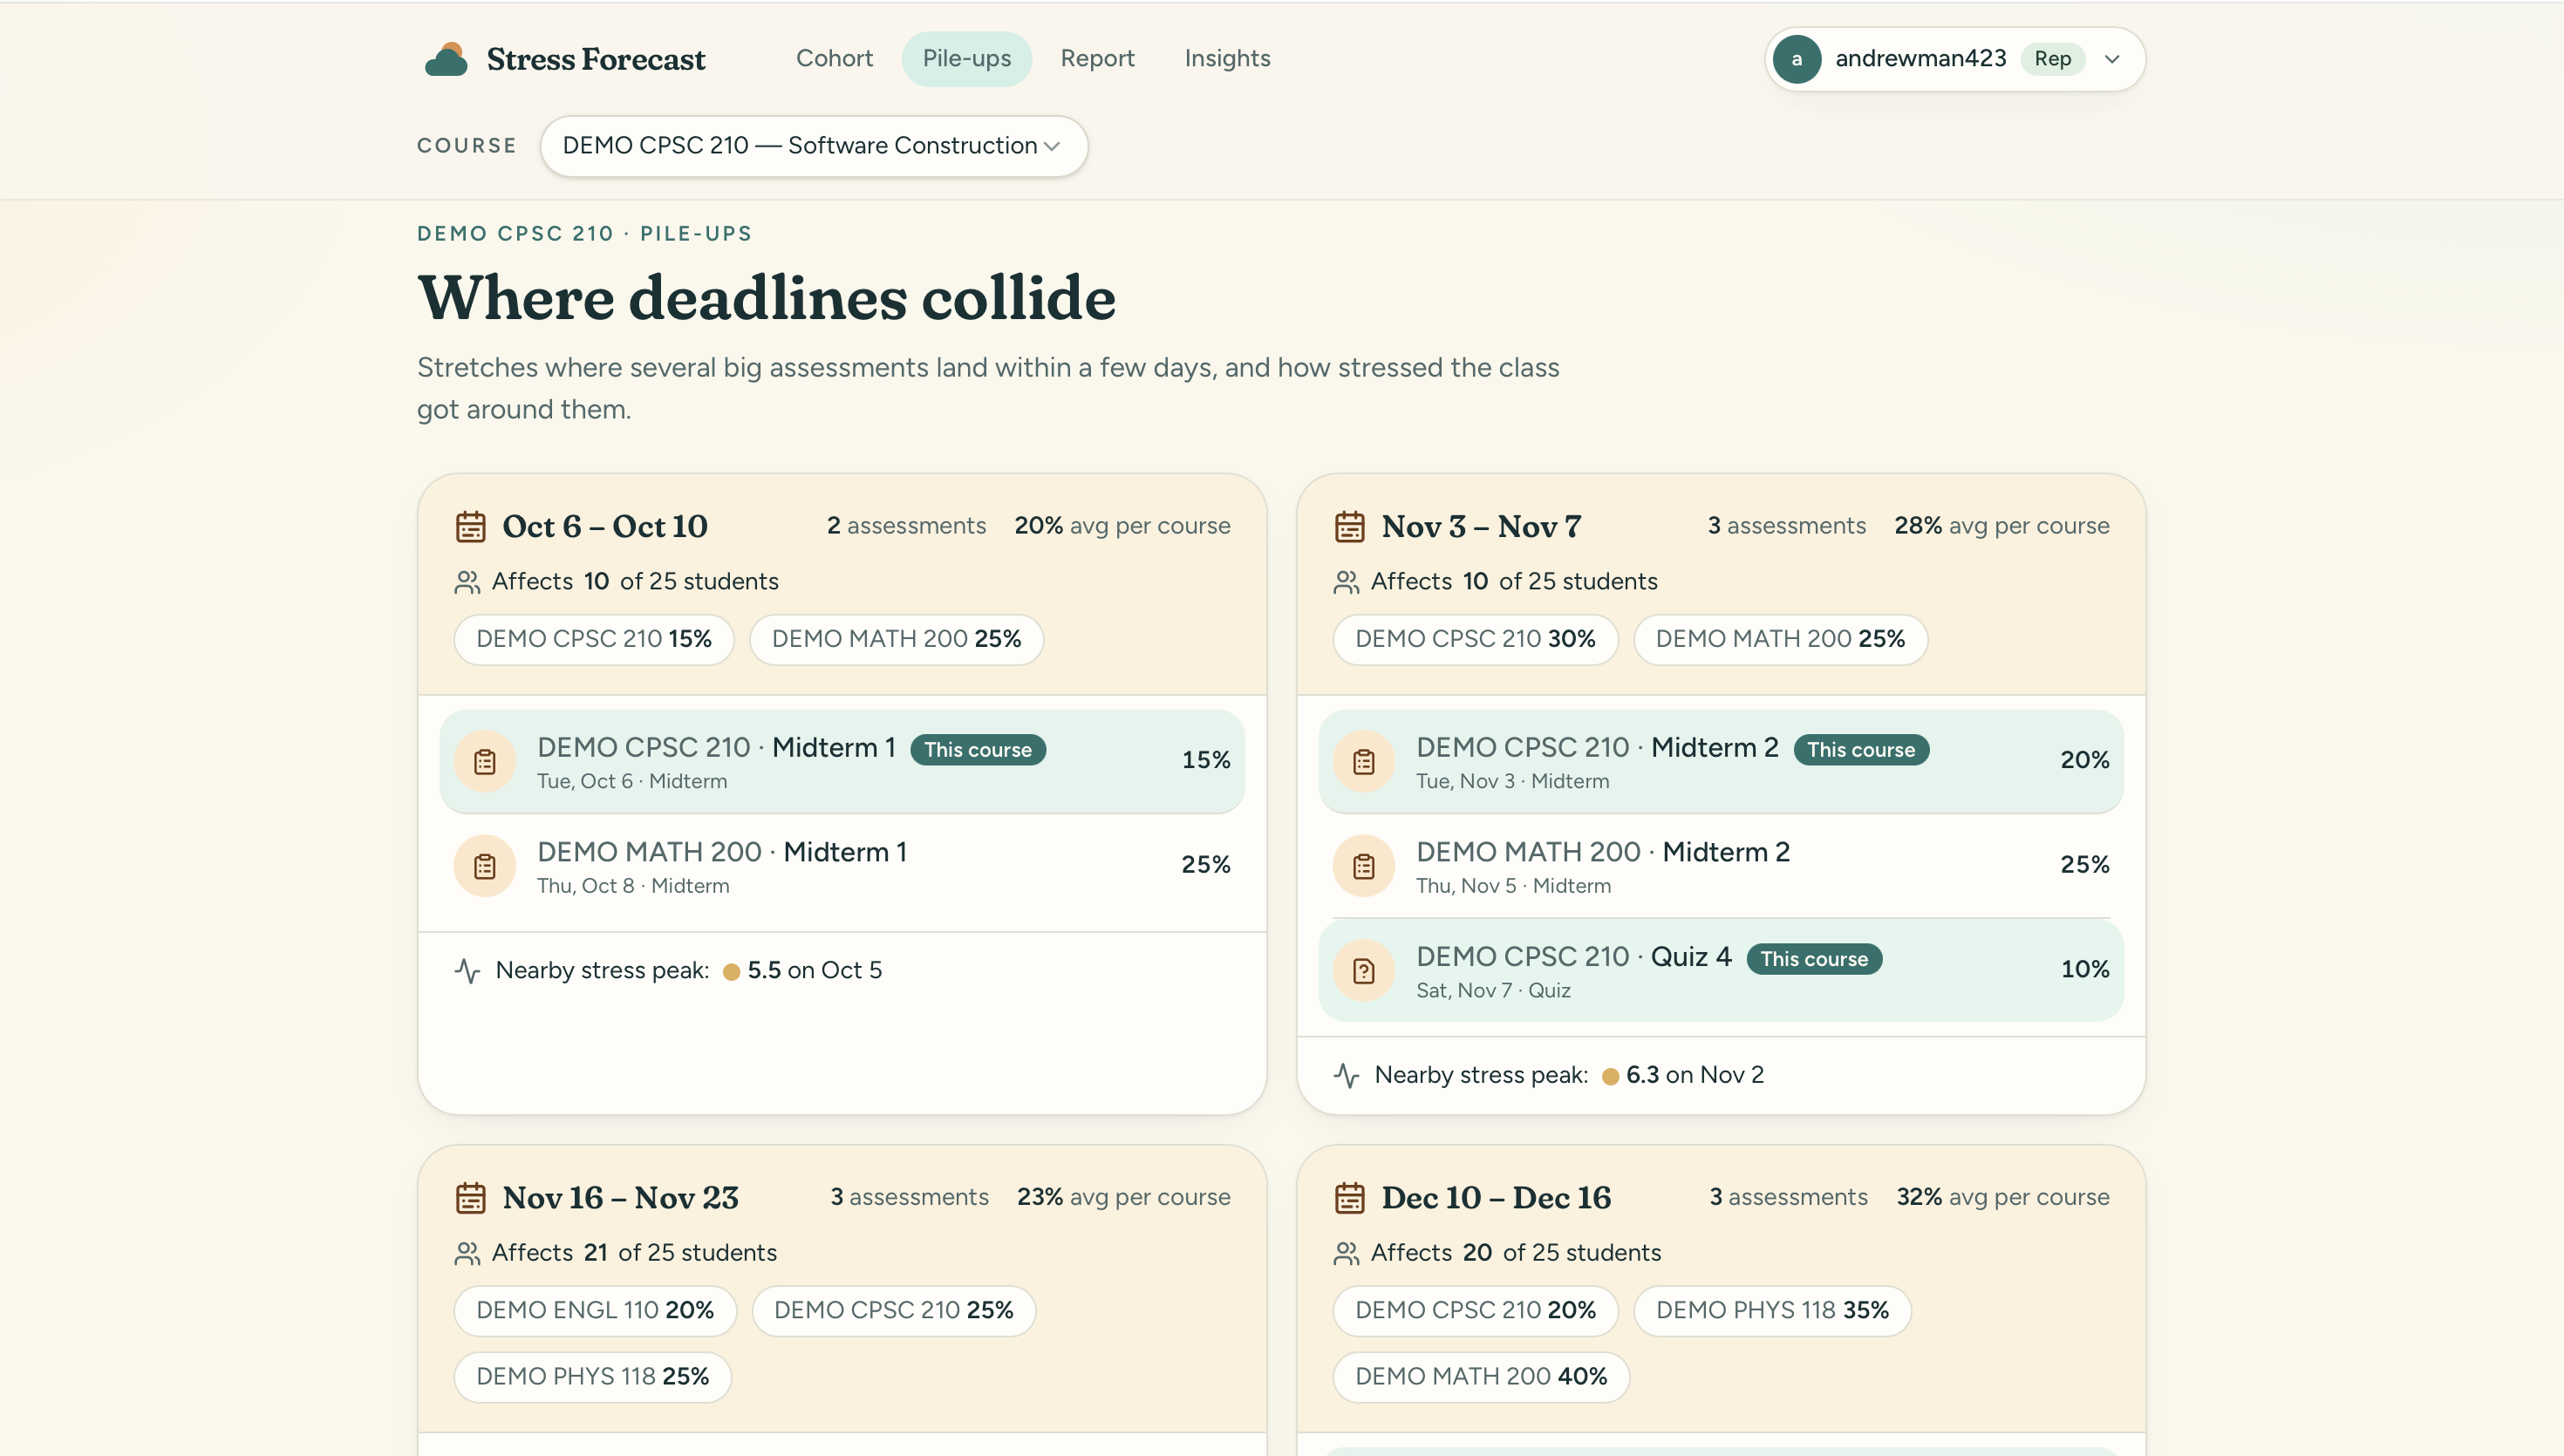
Class rep pile-ups view
-
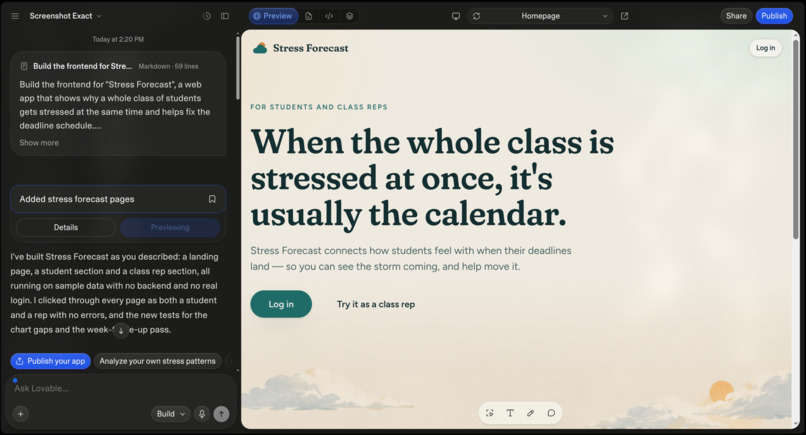
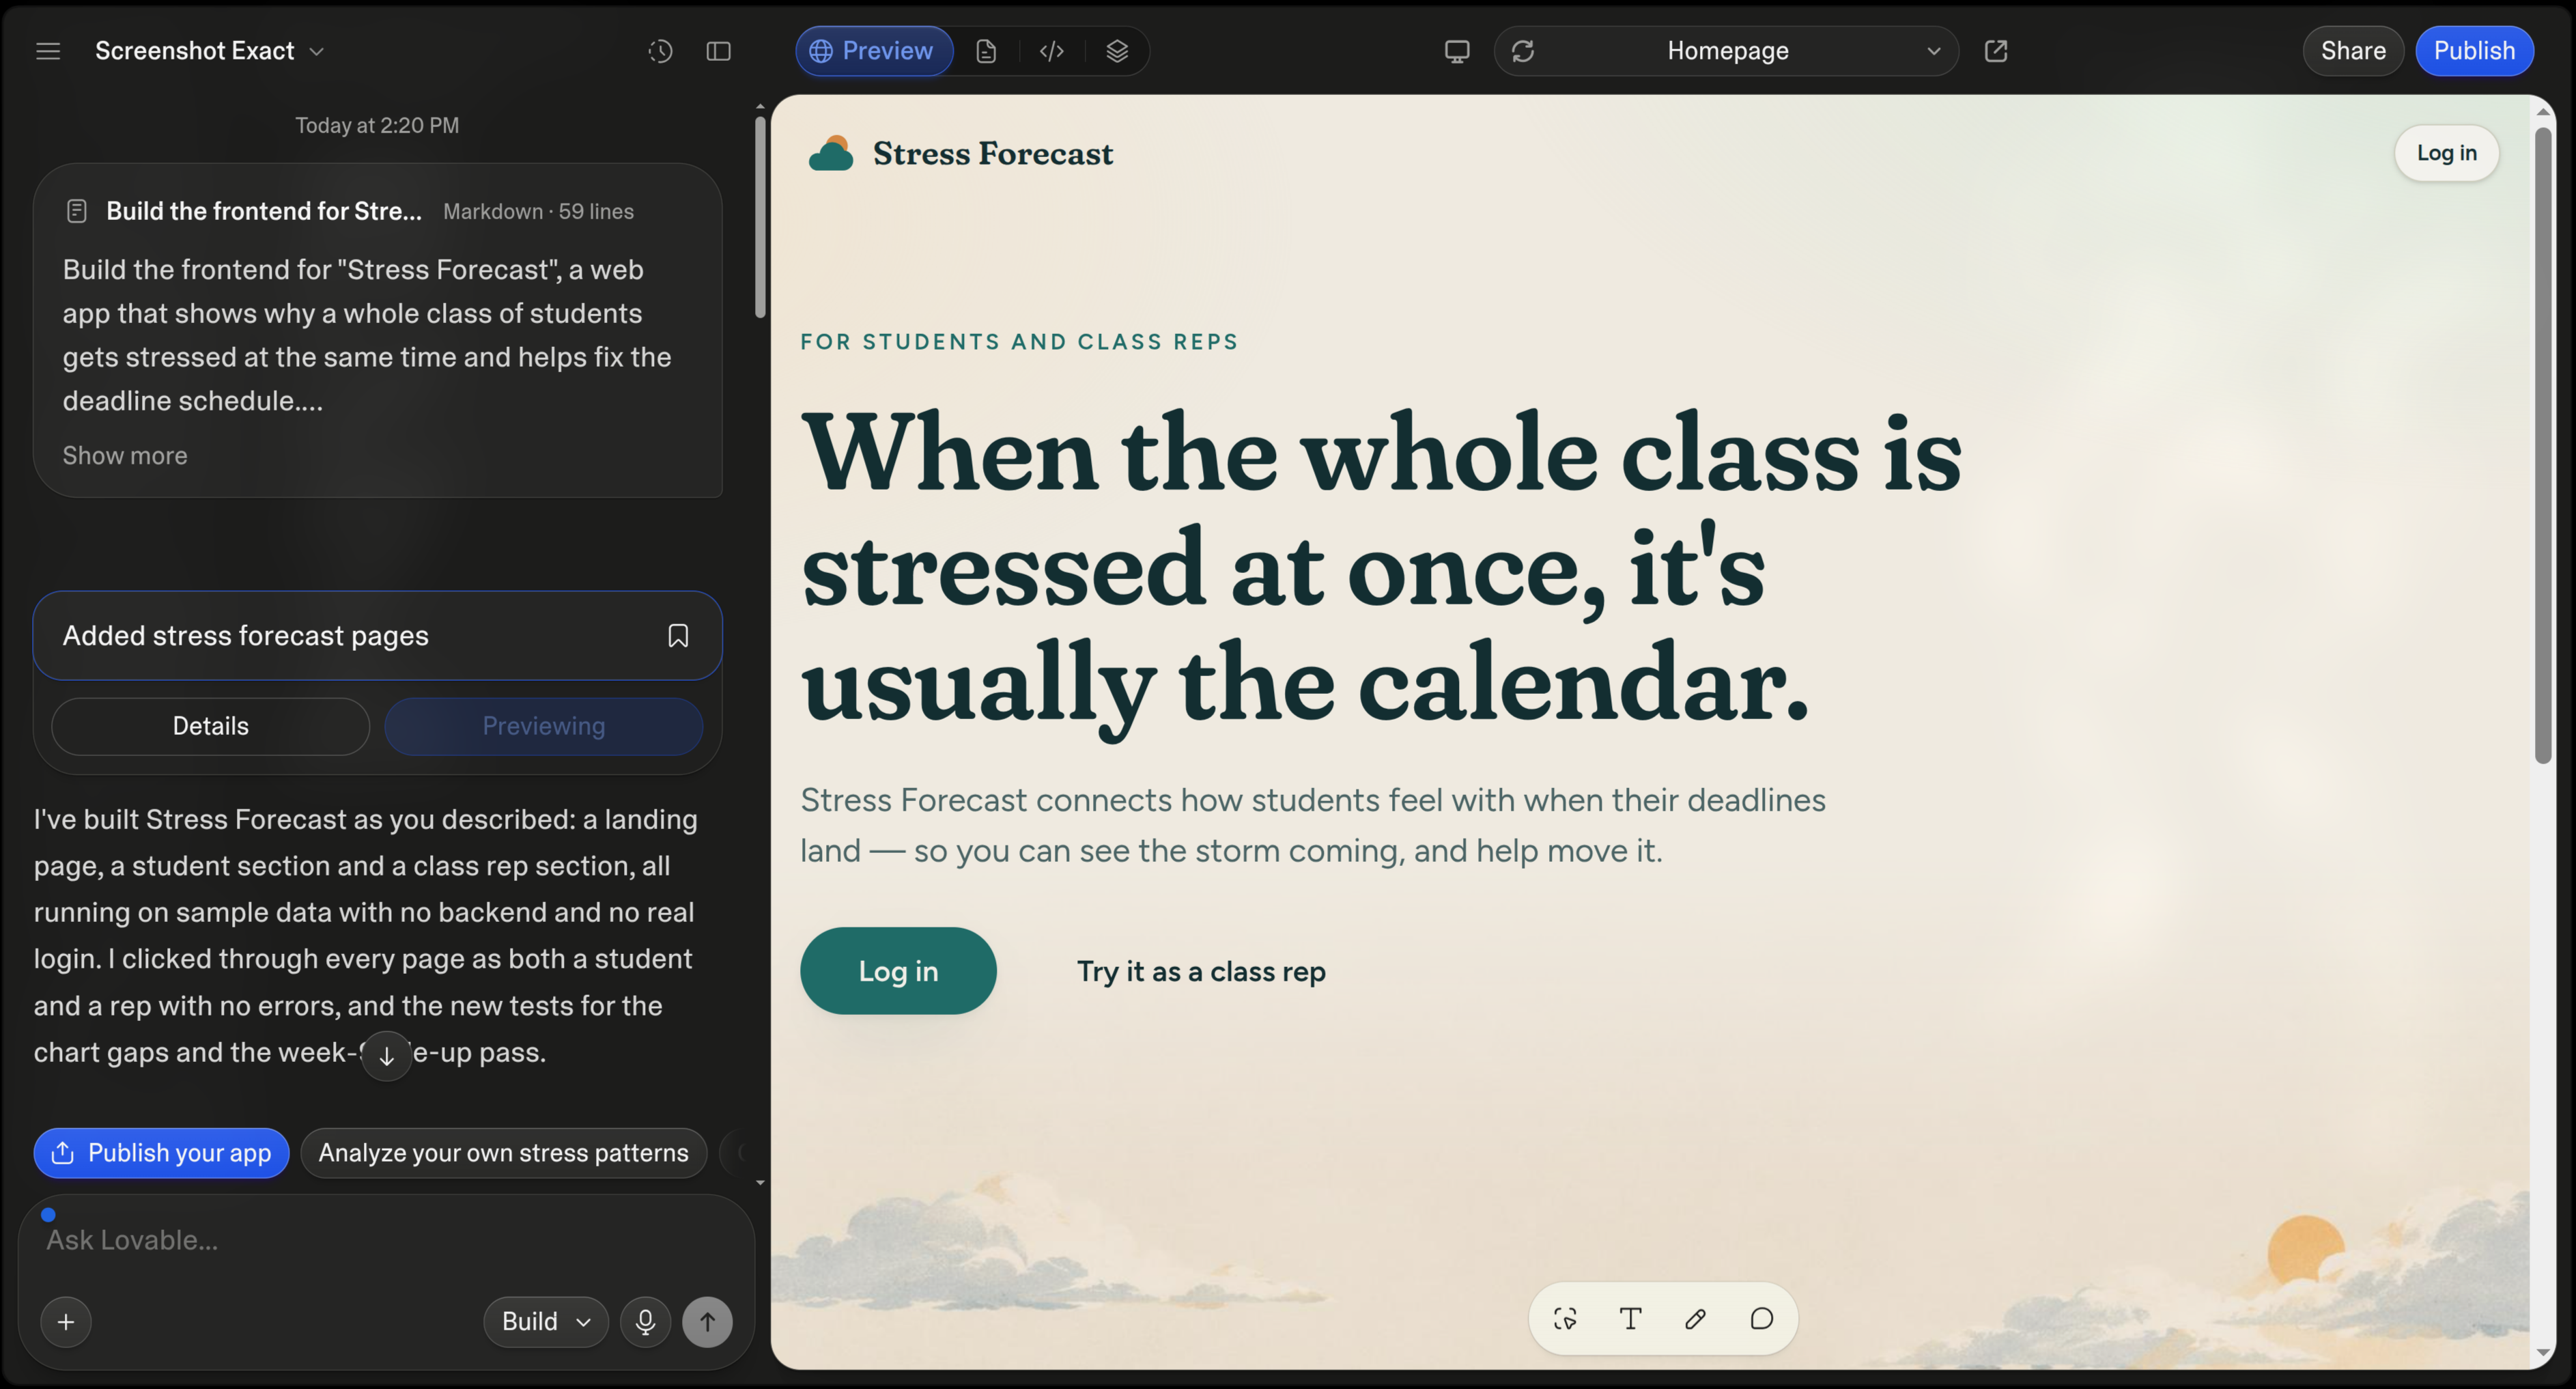
Lovable build
-
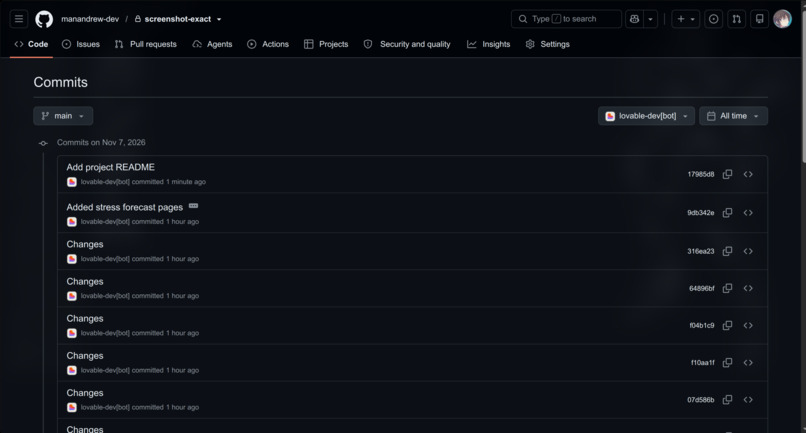
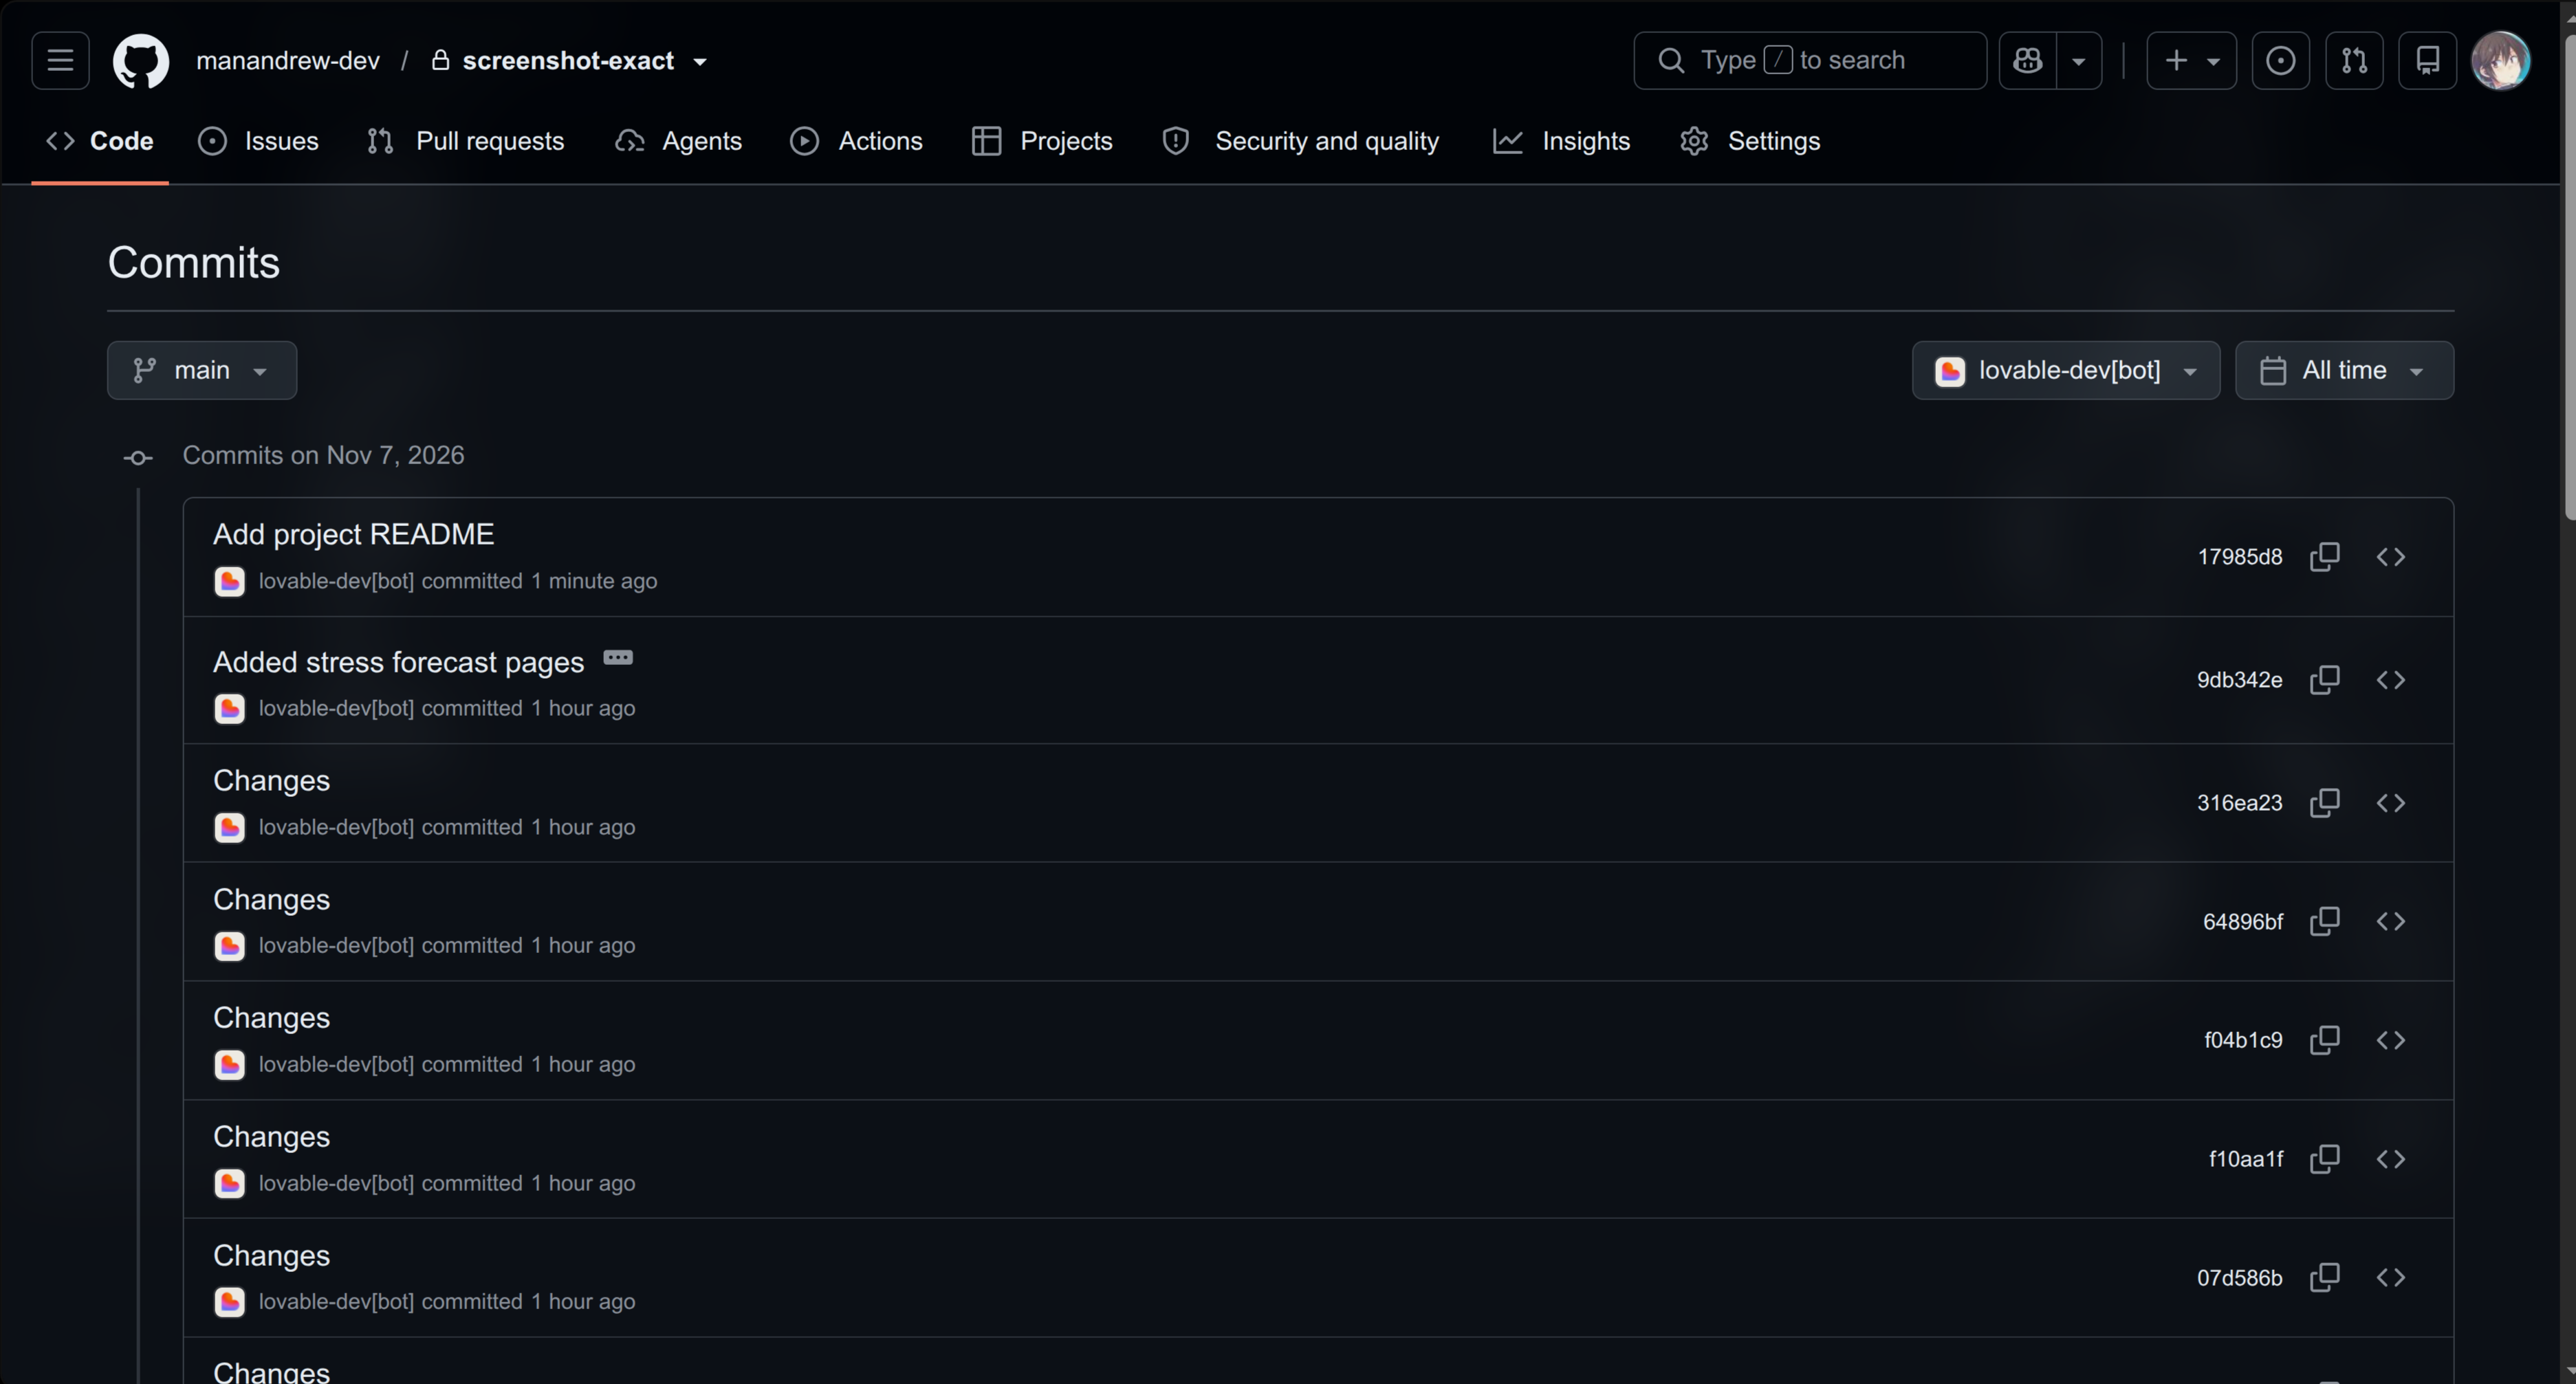
Lovable commits
-
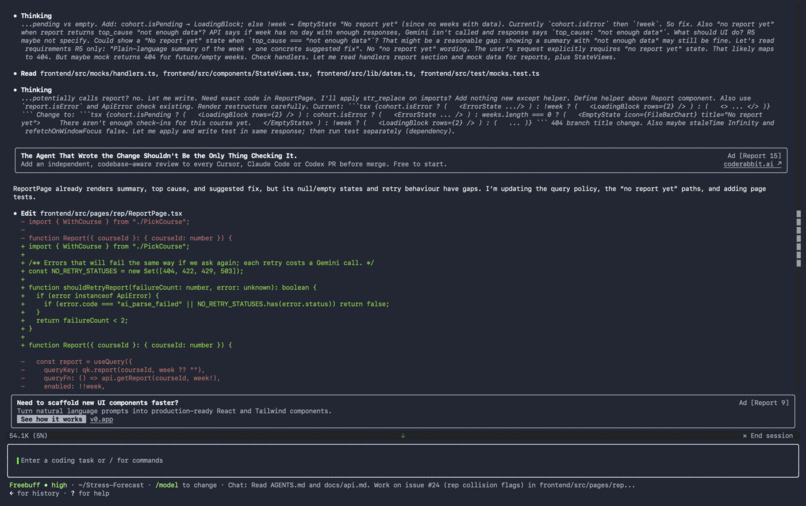
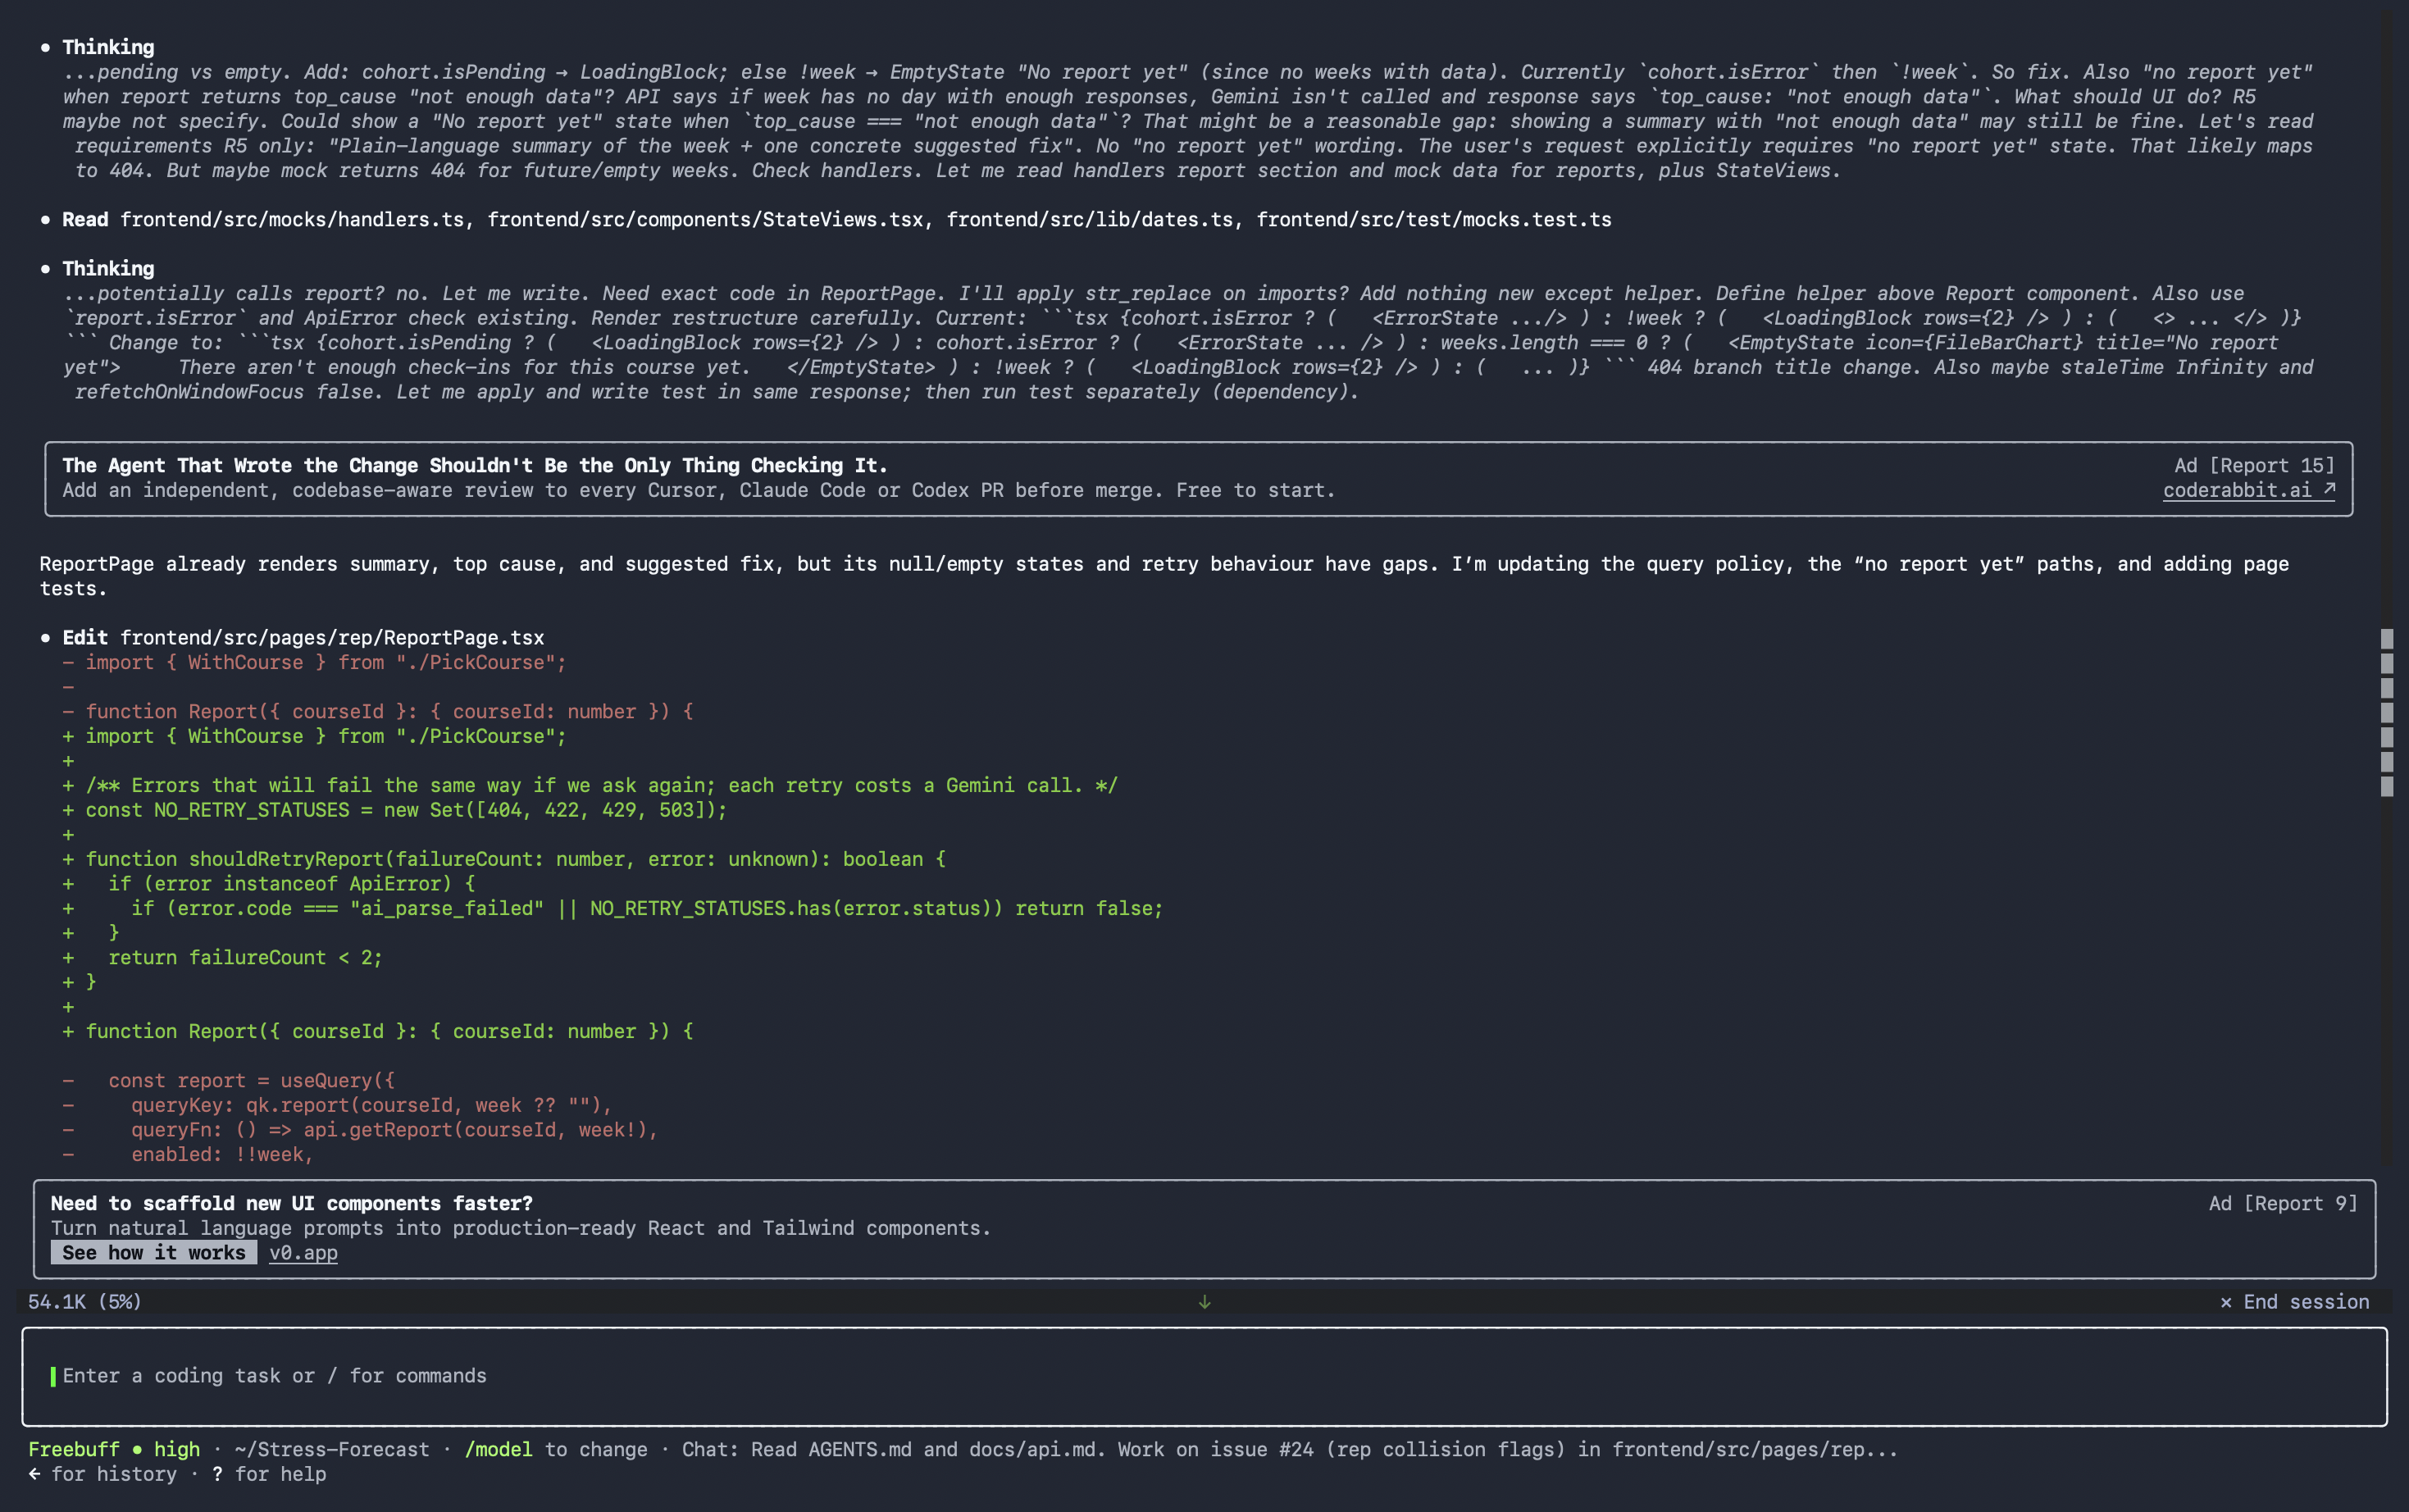
Freebuff plan
-
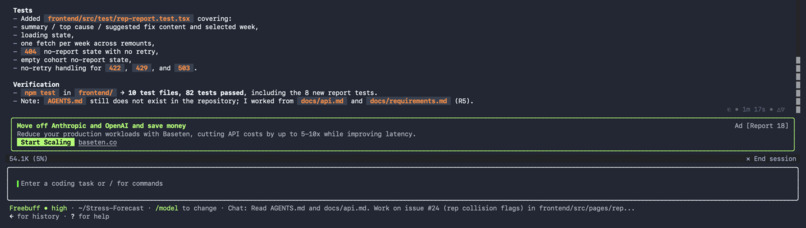
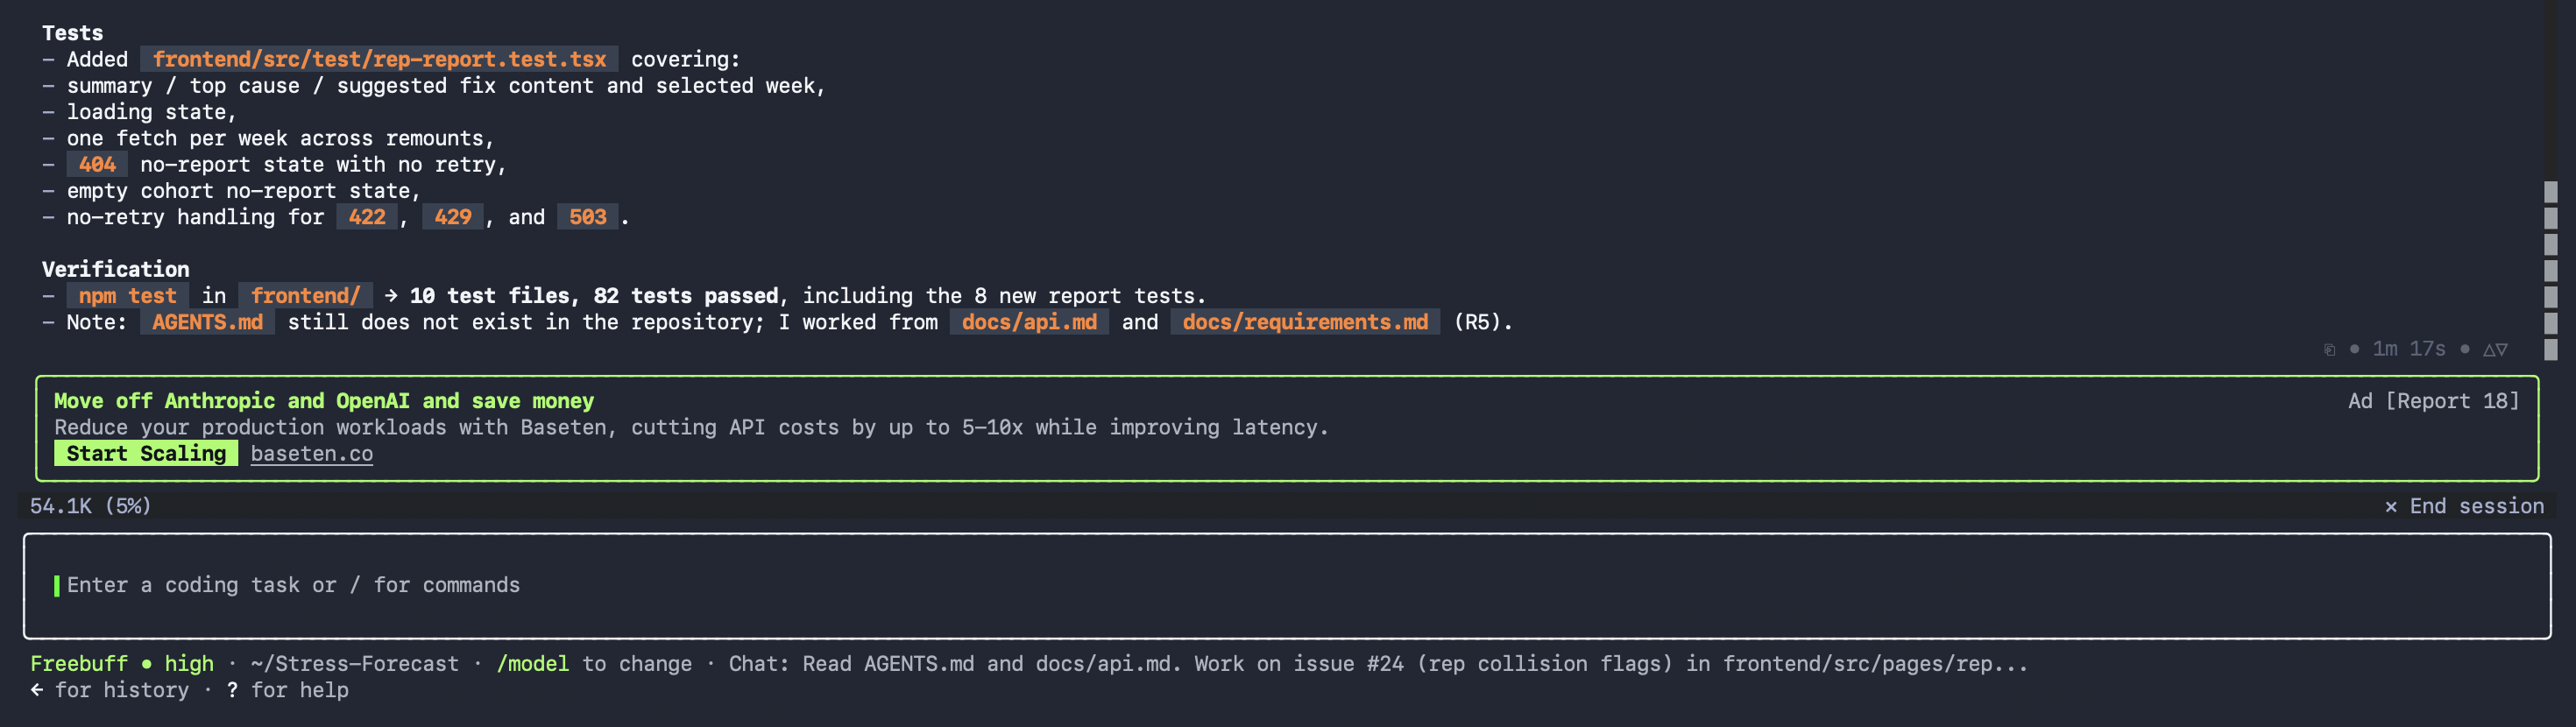
Freebuff tests
-
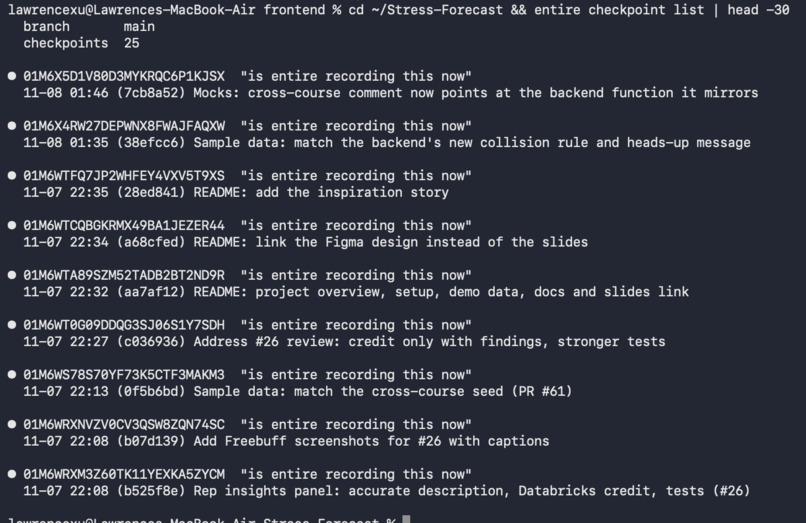
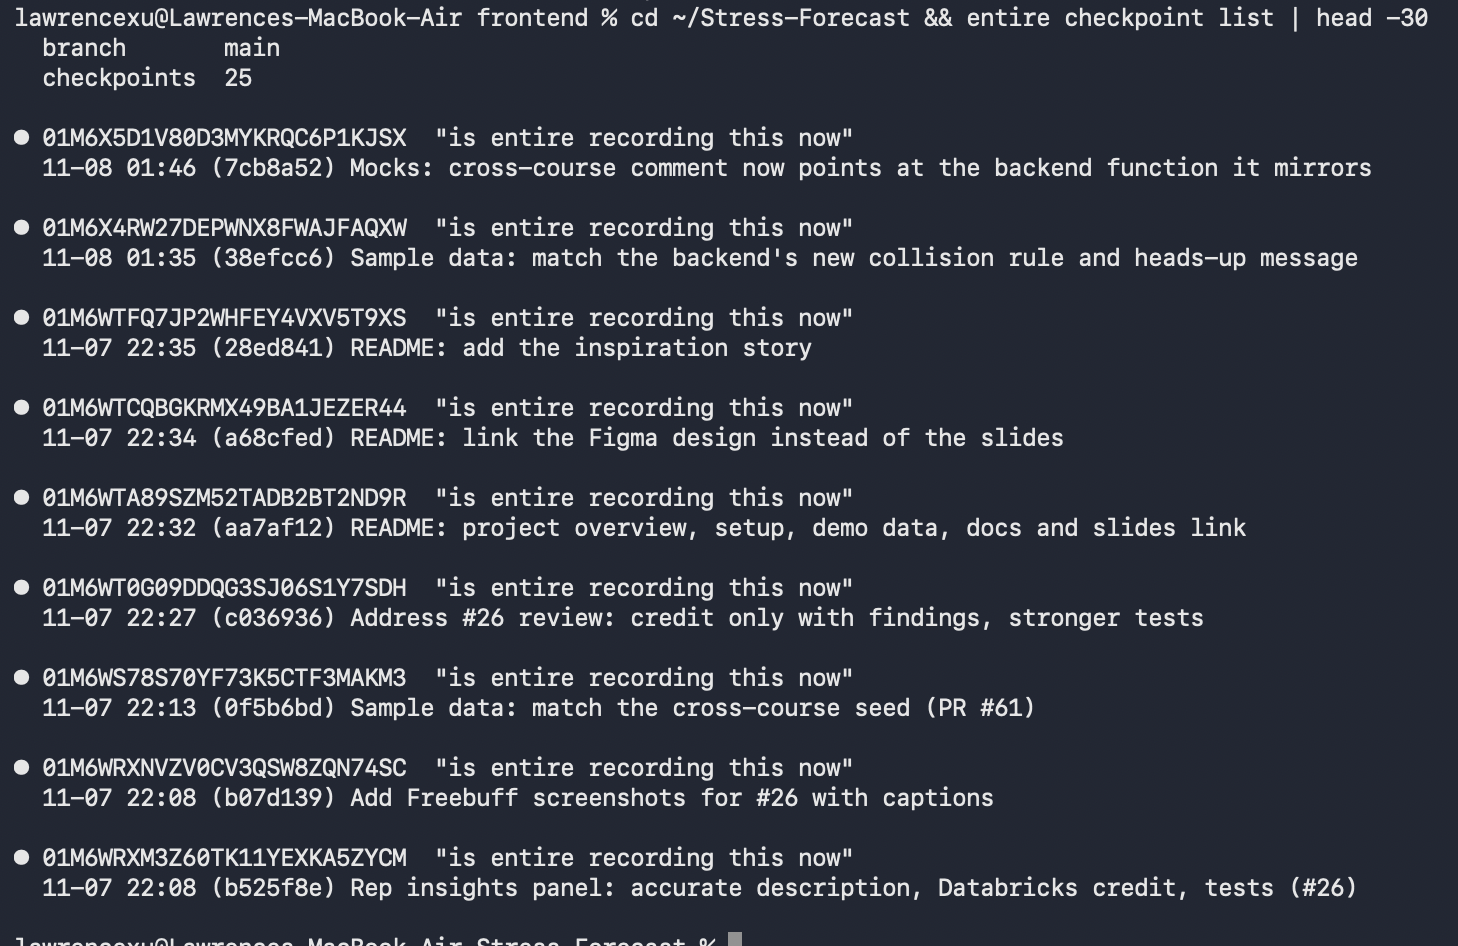
Entire sessions
-

Entire graph
-
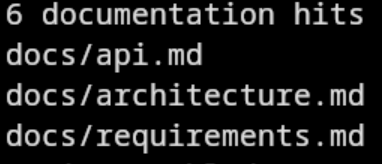
Entire brain
-
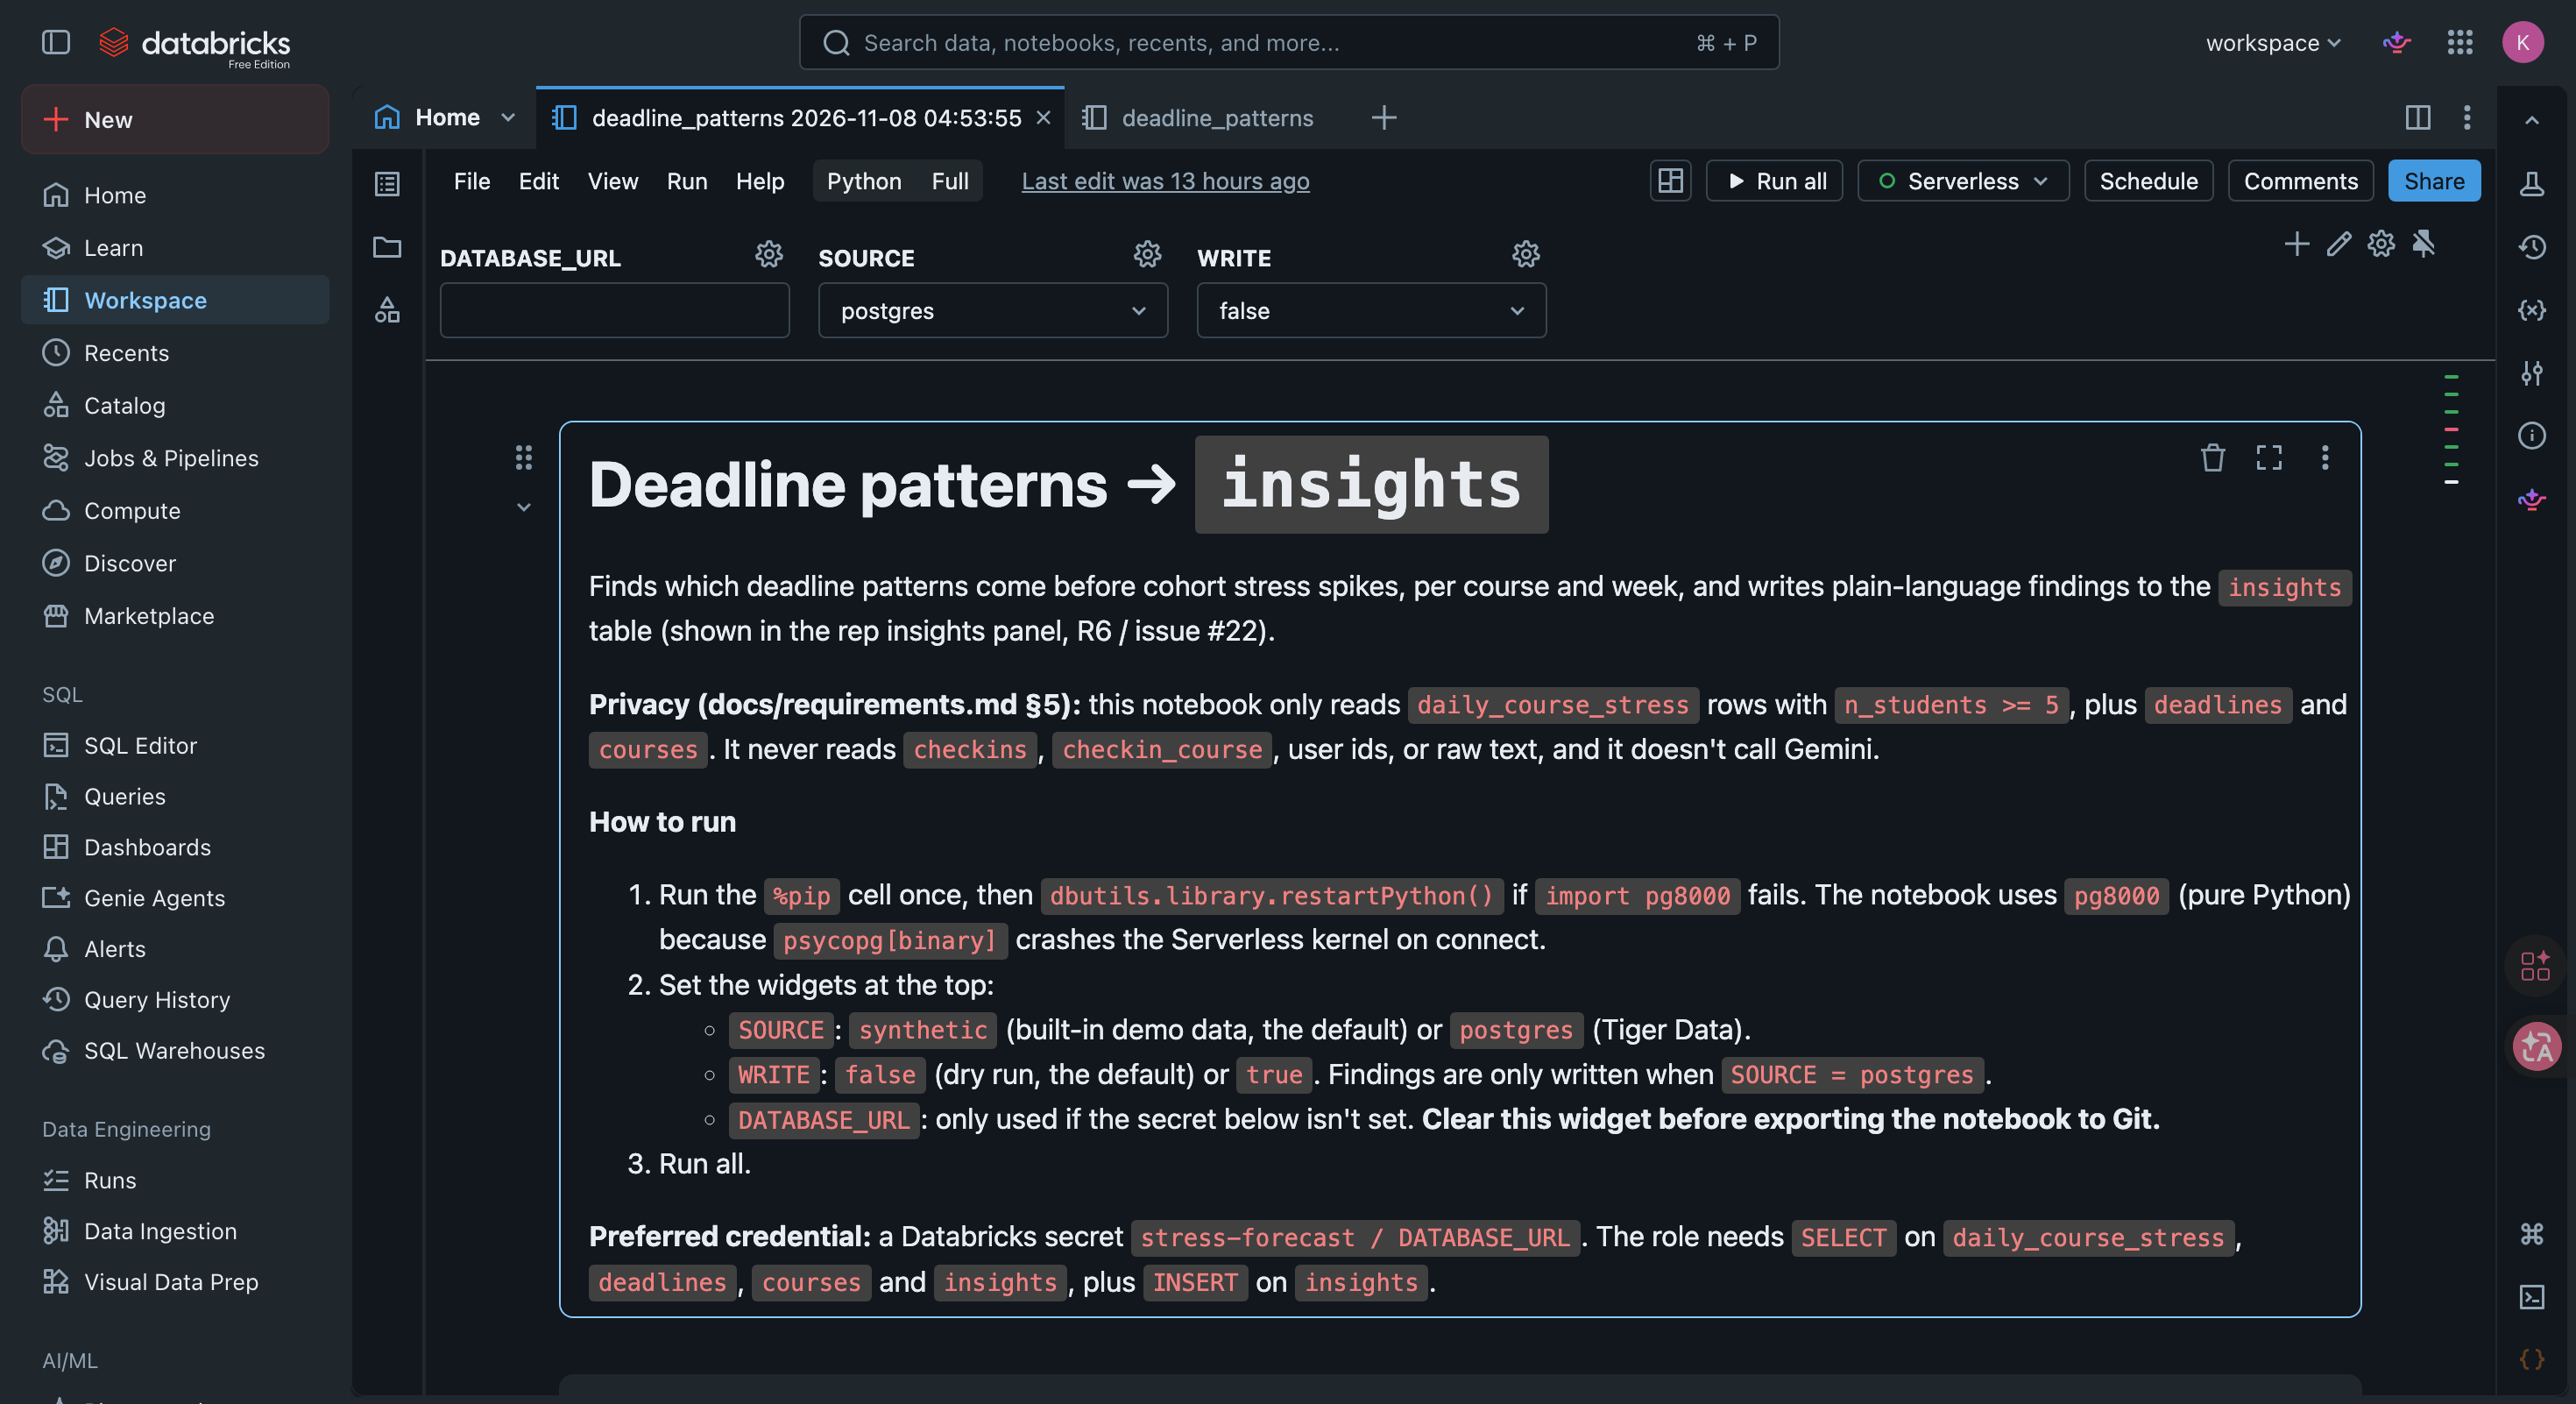
Databricks notebook


Inspiration
Every term has that week. Group chats go quiet, the library fills up at midnight, and everyone you ask is running on four hours of sleep. We noticed it's never just one of us: the same people hit the wall in the same week, because their midterms, projects and quizzes all landed in the same five days.
Nobody is doing anything wrong. Each instructor sets reasonable dates for their own course; they just can't see what every other course is asking of the same students that week. And the advice students get is always about coping alone: plan better, sleep more, try meditating. That treats a scheduling problem as a personal one.
So we flipped the question: what if we could see the stress of a whole class, line it up against every deadline across the courses they share, and show the people who set those dates exactly where the pile-ups are?
Wellbeing apps tell you to meditate. We find out why a whole cohort is burning out and fix the schedule.
What it does
Students do a 30-second daily check-in by text or voice ("barely slept, two assignments due Thursday"). Gemini turns it into a 1–10 stress score, sleep hours and likely causes. They upload their syllabi, and Gemini extracts every due date, weight and type for them to confirm. They see their own stress next to their deadlines, plus a heads-up when a pile-up is coming in the next two weeks.
Class reps only ever see class-wide numbers:
- Cohort view: the class's average stress per day, with every deadline on the same timeline.
- Pile-ups: weeks where deadlines collide across the courses the class shares. Each card shows each course's share of its own grade, the average per course, how many students it actually affects ("Affects 10 of 25 students"), and the stress peak nearby.
- Weekly report: a plain-language Gemini summary with one concrete fix, always moving one of the rep's own course deadlines, since that's the date they can ask about.
- Insights: patterns a Databricks notebook finds across the term.
In our demo data, week 9 for CPSC 210 has a Midterm, a MATH 200 Midterm and a Quiz within five days (55% combined). Neither instructor sees a problem in their own course, but the 10 students taking both do.
Privacy
A class's numbers only appear for days when at least 5 students checked in, enforced in the API rather than the UI. Rep endpoints never return user ids, check-in text or any individual's data. Names and ids are never sent to Gemini, and the browser only talks to our API.
How we built it
- Frontend: React + TypeScript (TanStack Start, Tailwind, Recharts). Lovable generated the first version of the UI; we built the student and rep pages on top of it.
- Backend: FastAPI (Python), with Auth0 for login and Student / Rep roles checked on every request.
- Database: Tiger Data (Postgres + TimescaleDB). Check-ins live in a hypertable, and daily class stress is a continuous aggregate that's filtered to 5+ students in SQL.
- AI: the Gemini API with structured JSON output for syllabus extraction, check-in parsing and the weekly report.
- Analytics: a Databricks notebook reads only the privacy-filtered aggregates and deadlines, finds which deadline patterns come before stress spikes, and writes plain-language findings back.
- Coding agents: Freebuff (main coding agent) and Claude Code, with Entire recording sessions (see below).
- Deployment: frontend on Vercel, backend on Render.
We agreed the API contract (docs/api.md) in the first hour, so the frontend could build against sample data that mirrors the seed database while the backend caught up.
How we used our sponsor tools
Lovable. we wrote a 59-line spec for Stress Forecast and Lovable generated the first working frontend from it: the landing page, the student check-in (text or voice, 1–10 score, sleep and causes, and a gentle support message for worrying words), the trend chart, the two-week heads-up and the rep section, all running on sample data. Login was a placeholder, with a clear hand-off for wiring in Auth0 tokens and our own API. Its commits (by lovable-dev[bot]) were synced to GitHub and merged into our repo, and we built everything else on top.
Freebuff. freebuff was our main coding agent. For the rep pages it read our API contract and existing code, found what was missing, made the changes and wrote tests: collision-card labels for missing stress peaks, a weekly report that spends as few Gemini calls as possible, and an accurate, Databricks-credited insights panel. Every session ended with the test suite passing. We captured the sessions as screenshots (docs/freebuff/), and reviewed and extended Freebuff's work in Claude Code.
Entire. we turned on Entire early so AI-assisted changes would have a traceable history.
- Sessions: Entire recorded our Claude Code sessions, and 26 commits on
maincarry anEntire-Checkpointlink back to the session that produced them: what was asked, what the agent read and changed, and why. Checkpoint pushing stays off, so the sessions themselves stay private. - Graph: we query the committed code by meaning instead of grepping. Asking "how are cross-course rep collisions implemented, including shared courses and the own-course filter?" points straight to
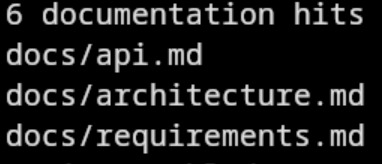
cross_course_rep_collisionsandfind_collisionsincollisions.pyandcohort_course_setsincohort.py, the code behind our mid-hackathon pile-up redesign. - Brain: docs-aware queries answer "why" questions from our own decisions. A cohort-privacy query returns the relevant parts of our API contract, architecture and requirements docs, the source of the 5-student rule.
- Entire doesn't capture Freebuff sessions, so those are documented with screenshots instead.
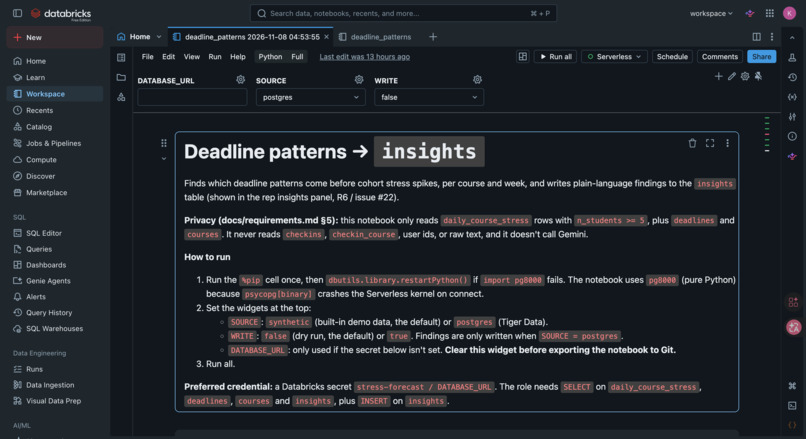
Databricks. Our deadline_patterns notebook runs on Databricks Serverless as a daily job. It reads only the privacy-filtered daily averages (days with 5+ students) plus deadlines and courses, never check-ins, user ids or raw text, and never calls Gemini. Per course and week it looks at deadline count, total weight and the change in stress, finds which deadline patterns come before spikes, and writes plain-language findings to an insights table that the rep Insights page shows. It defaults to a dry run on synthetic data, and reads the database URL from a Databricks secret.
Tiger Data, Gemini and Auth0 are covered in How we built it above.
Screenshots for each tool are in the repo under docs/freebuff/, docs/entire/, docs/lovable/ and docs/databricks/.
Challenges we ran into
- Defining a "pile-up." Our first rule only looked at one course's deadlines, but the real problem is across courses. We redesigned it mid-hackathon: count deadlines from courses at least 5 of the class share, keep only windows that include the rep's own course, and report how many students are actually affected. Weights from different courses don't add up meaningfully ("120% combined" for three finals), so cards show each course's share and the average per course instead.
- Keeping sample data and the real API in sync. The frontend ran on sample data for most of the build. Every backend rule change (like "one heavy exam alone isn't a pile-up") had to be mirrored, so we copied the backend's collision tests into the frontend to catch drift.
- A tiny free Gemini quota and overloaded models. Models regularly returned 503 "high demand." We cache each weekly report, don't retry errors that would just spend quota again, and show clear "no report yet" states.
- Privacy without losing the story. Days with fewer than 5 check-ins are hidden, and charts show them as gaps rather than drawing a line across them.
Accomplishments that we're proud of
- An end-to-end app, live on the web, where a rep can see a cross-course pile-up and get a concrete date to move.
- Privacy enforced on the server, not just hidden in the UI.
- Over 100 automated frontend tests, plus backend and seed tests, including tests that the sample data matches the backend rules.
What we learned
- The hardest part wasn't the code; it was deciding what a number should mean. "55% combined" and "18% average per course" describe the same week very differently.
- Agreeing on the API contract first let four people build in parallel.
- AI coding agents are fast, but they still need review: our reviews caught real bugs, like an empty-week edge case and retries quietly burning AI quota.
What's next for Stress Forecast
- Real pilots with student reps in a few courses, and instructor-facing summaries.
- A backup Gemini model, so check-ins still work when one model is overloaded.
- Suggesting dates to move that are checked against every shared course, not just the rep's own.
Built With
- auth0
- databricks
- entire
- fastapi
- figma
- freebuff
- gemini
- github
- lovable
- postgresql
- pydantic
- python
- react
- recharts
- render
- tailwindcss
- tanstack
- tiger-data
- timescaledb
- typescript
- vercel
- vite
