-
-
-
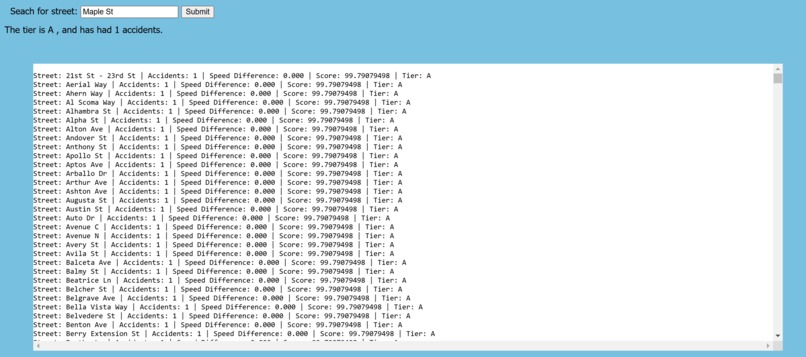
Website search function (valid input)
-

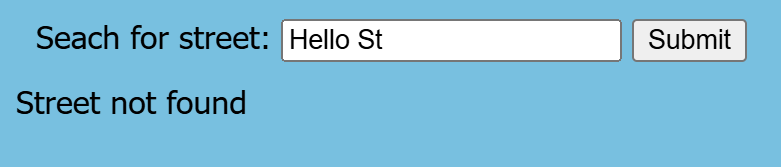
Website search function (invalid input)
-
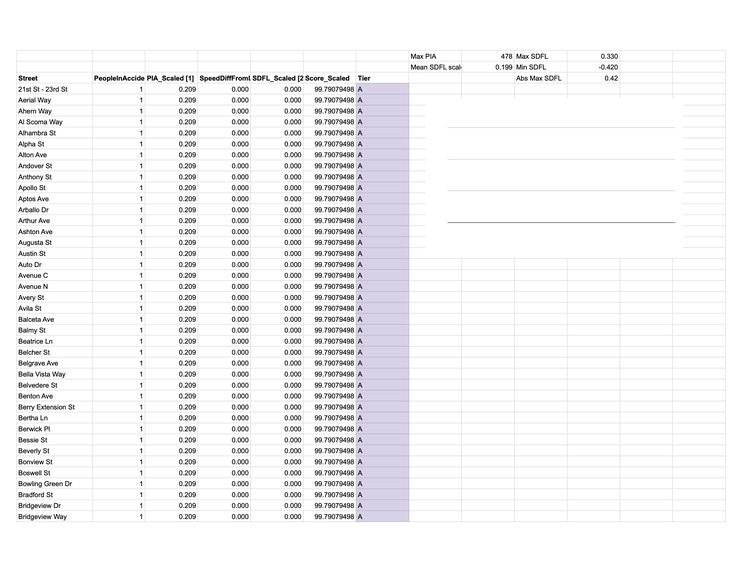
Spreadsheet (data analysis)


Inspiration
We knew we wanted to generate insights using transportation-related data. We were inspired by Inrix's work with big transit data and by the general goal of improving road safety.
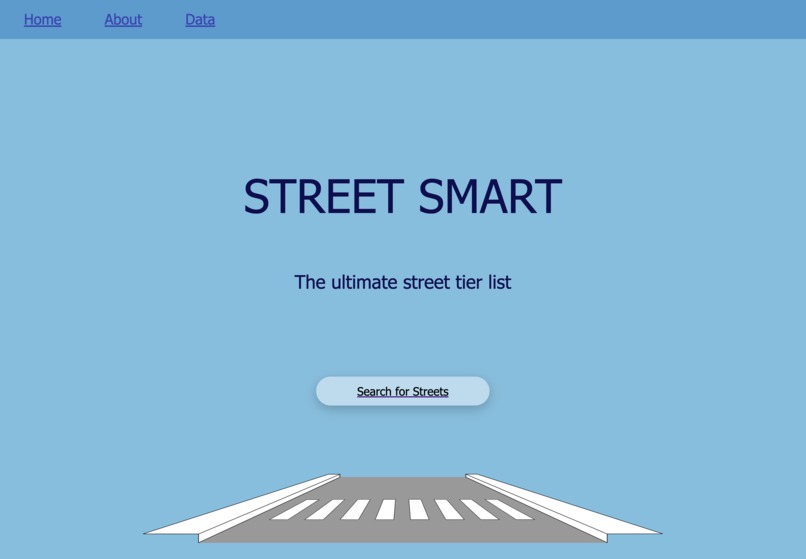
What it does
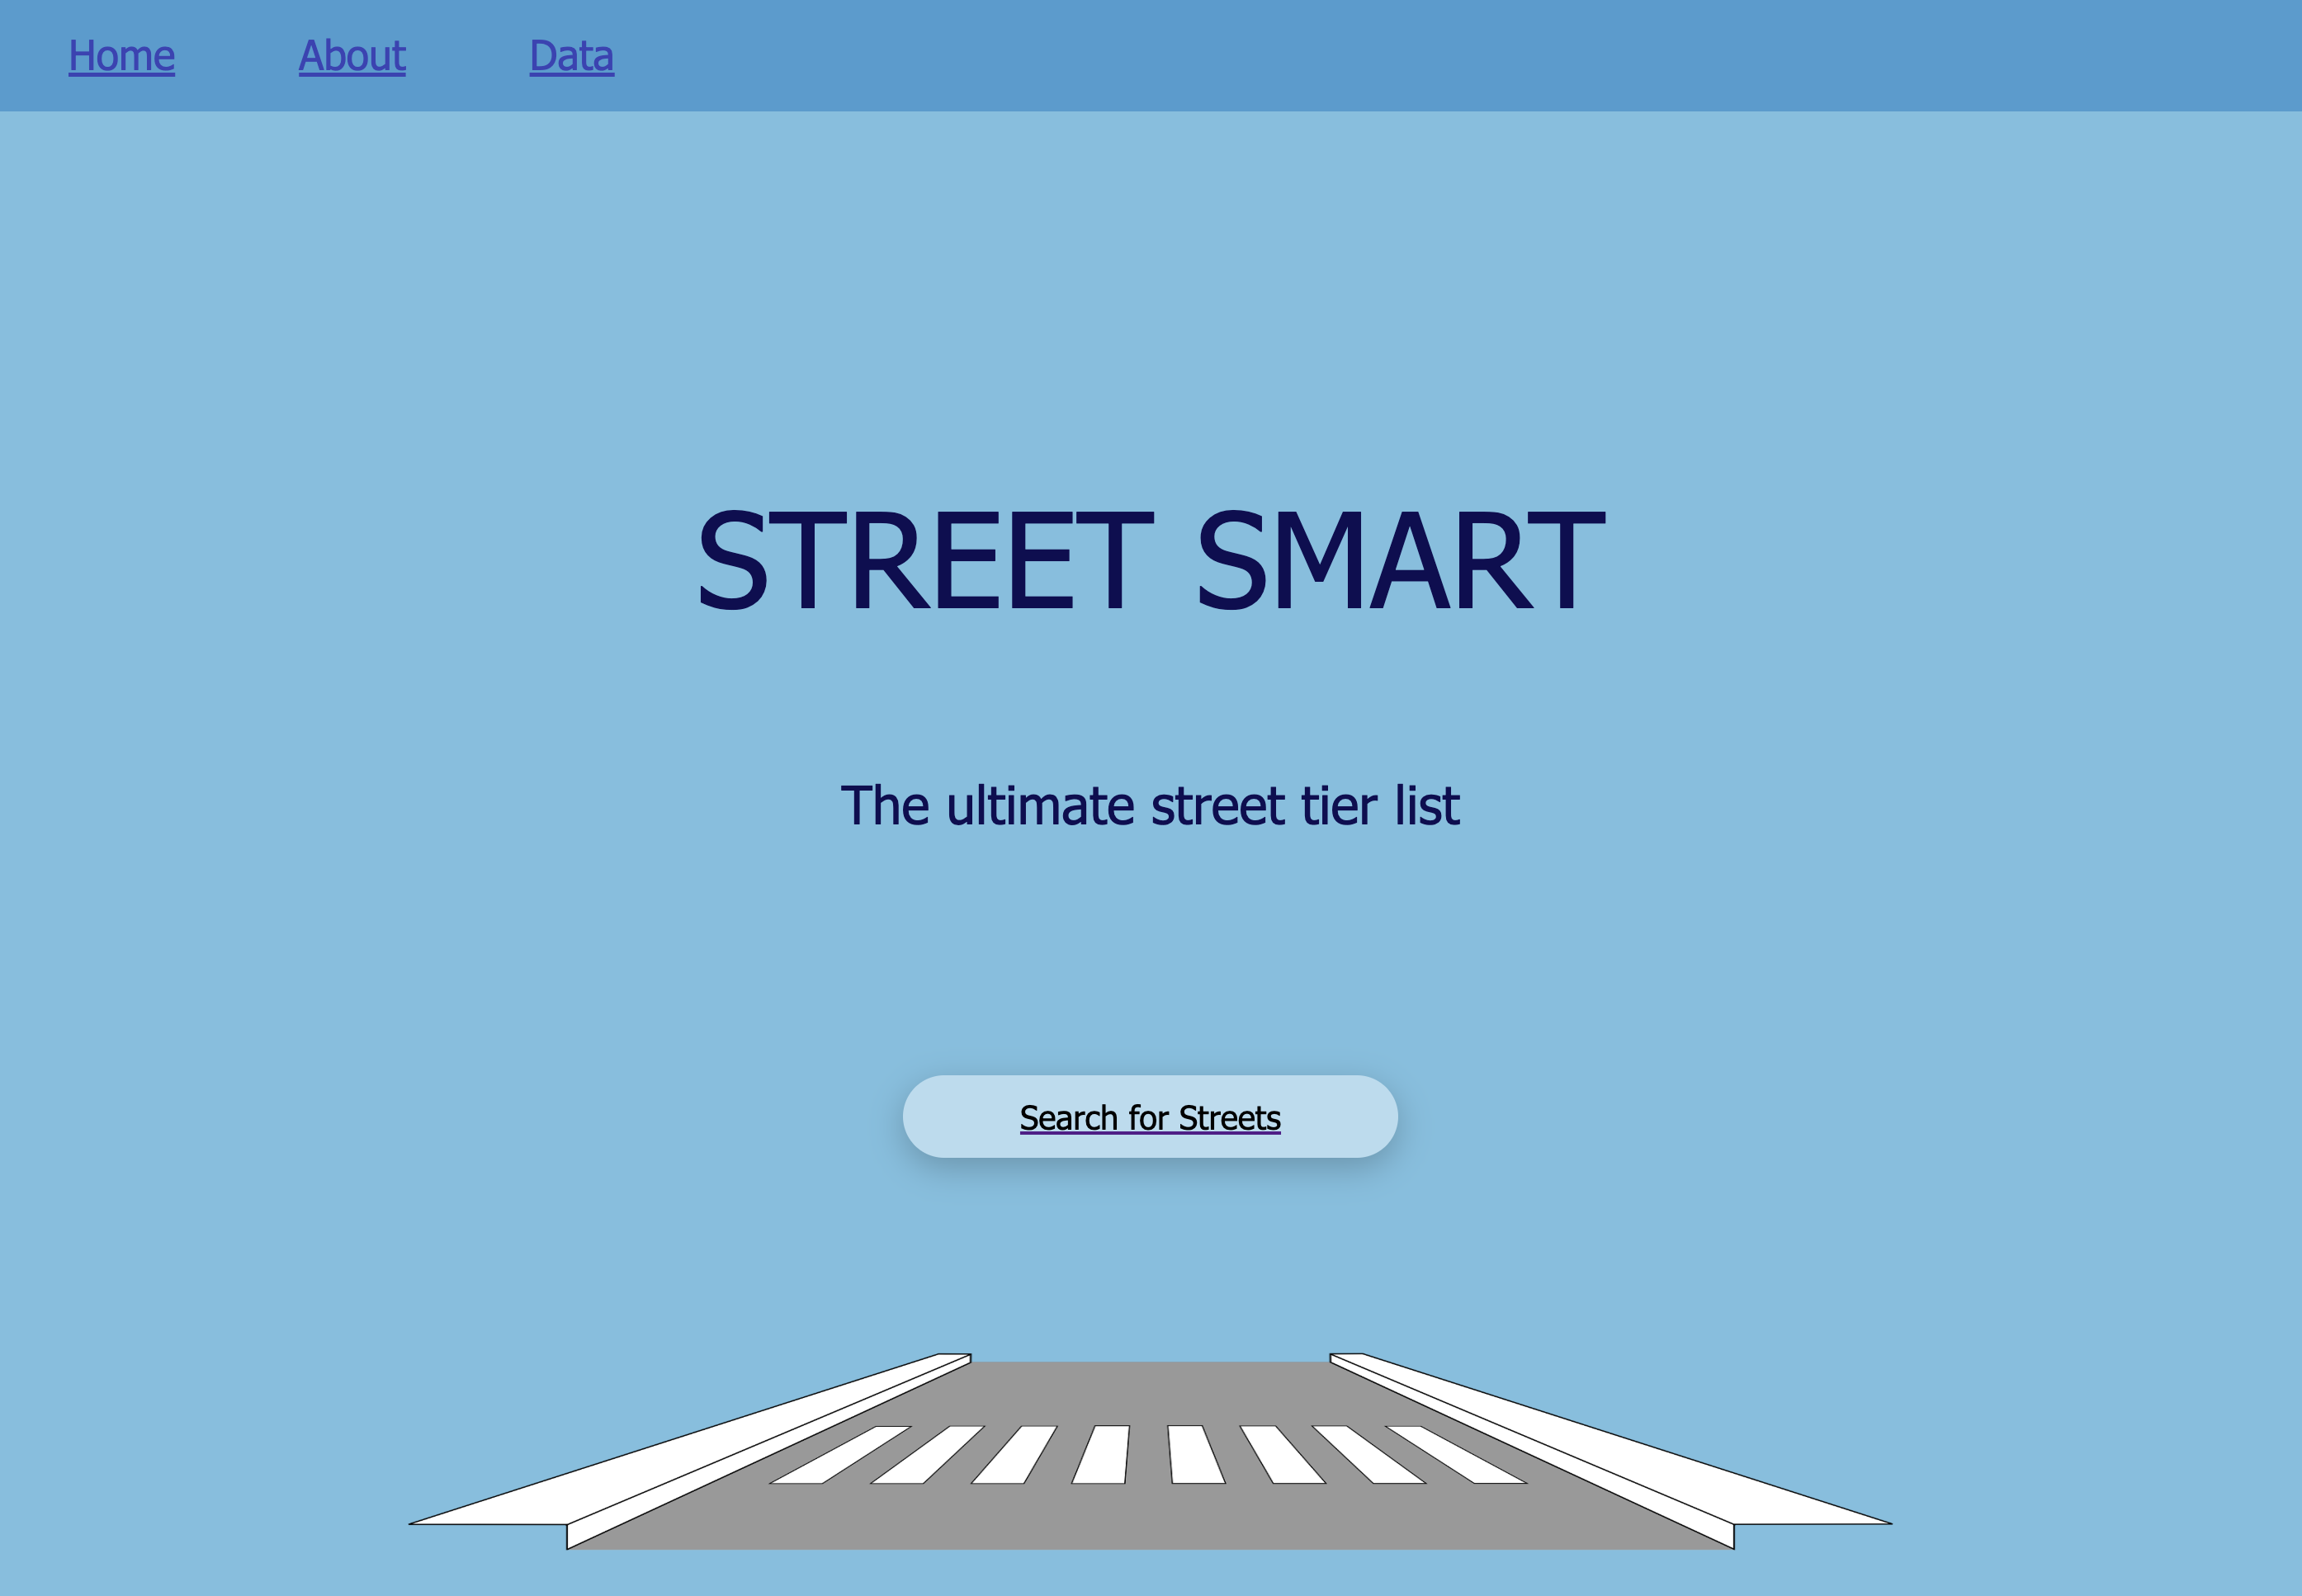
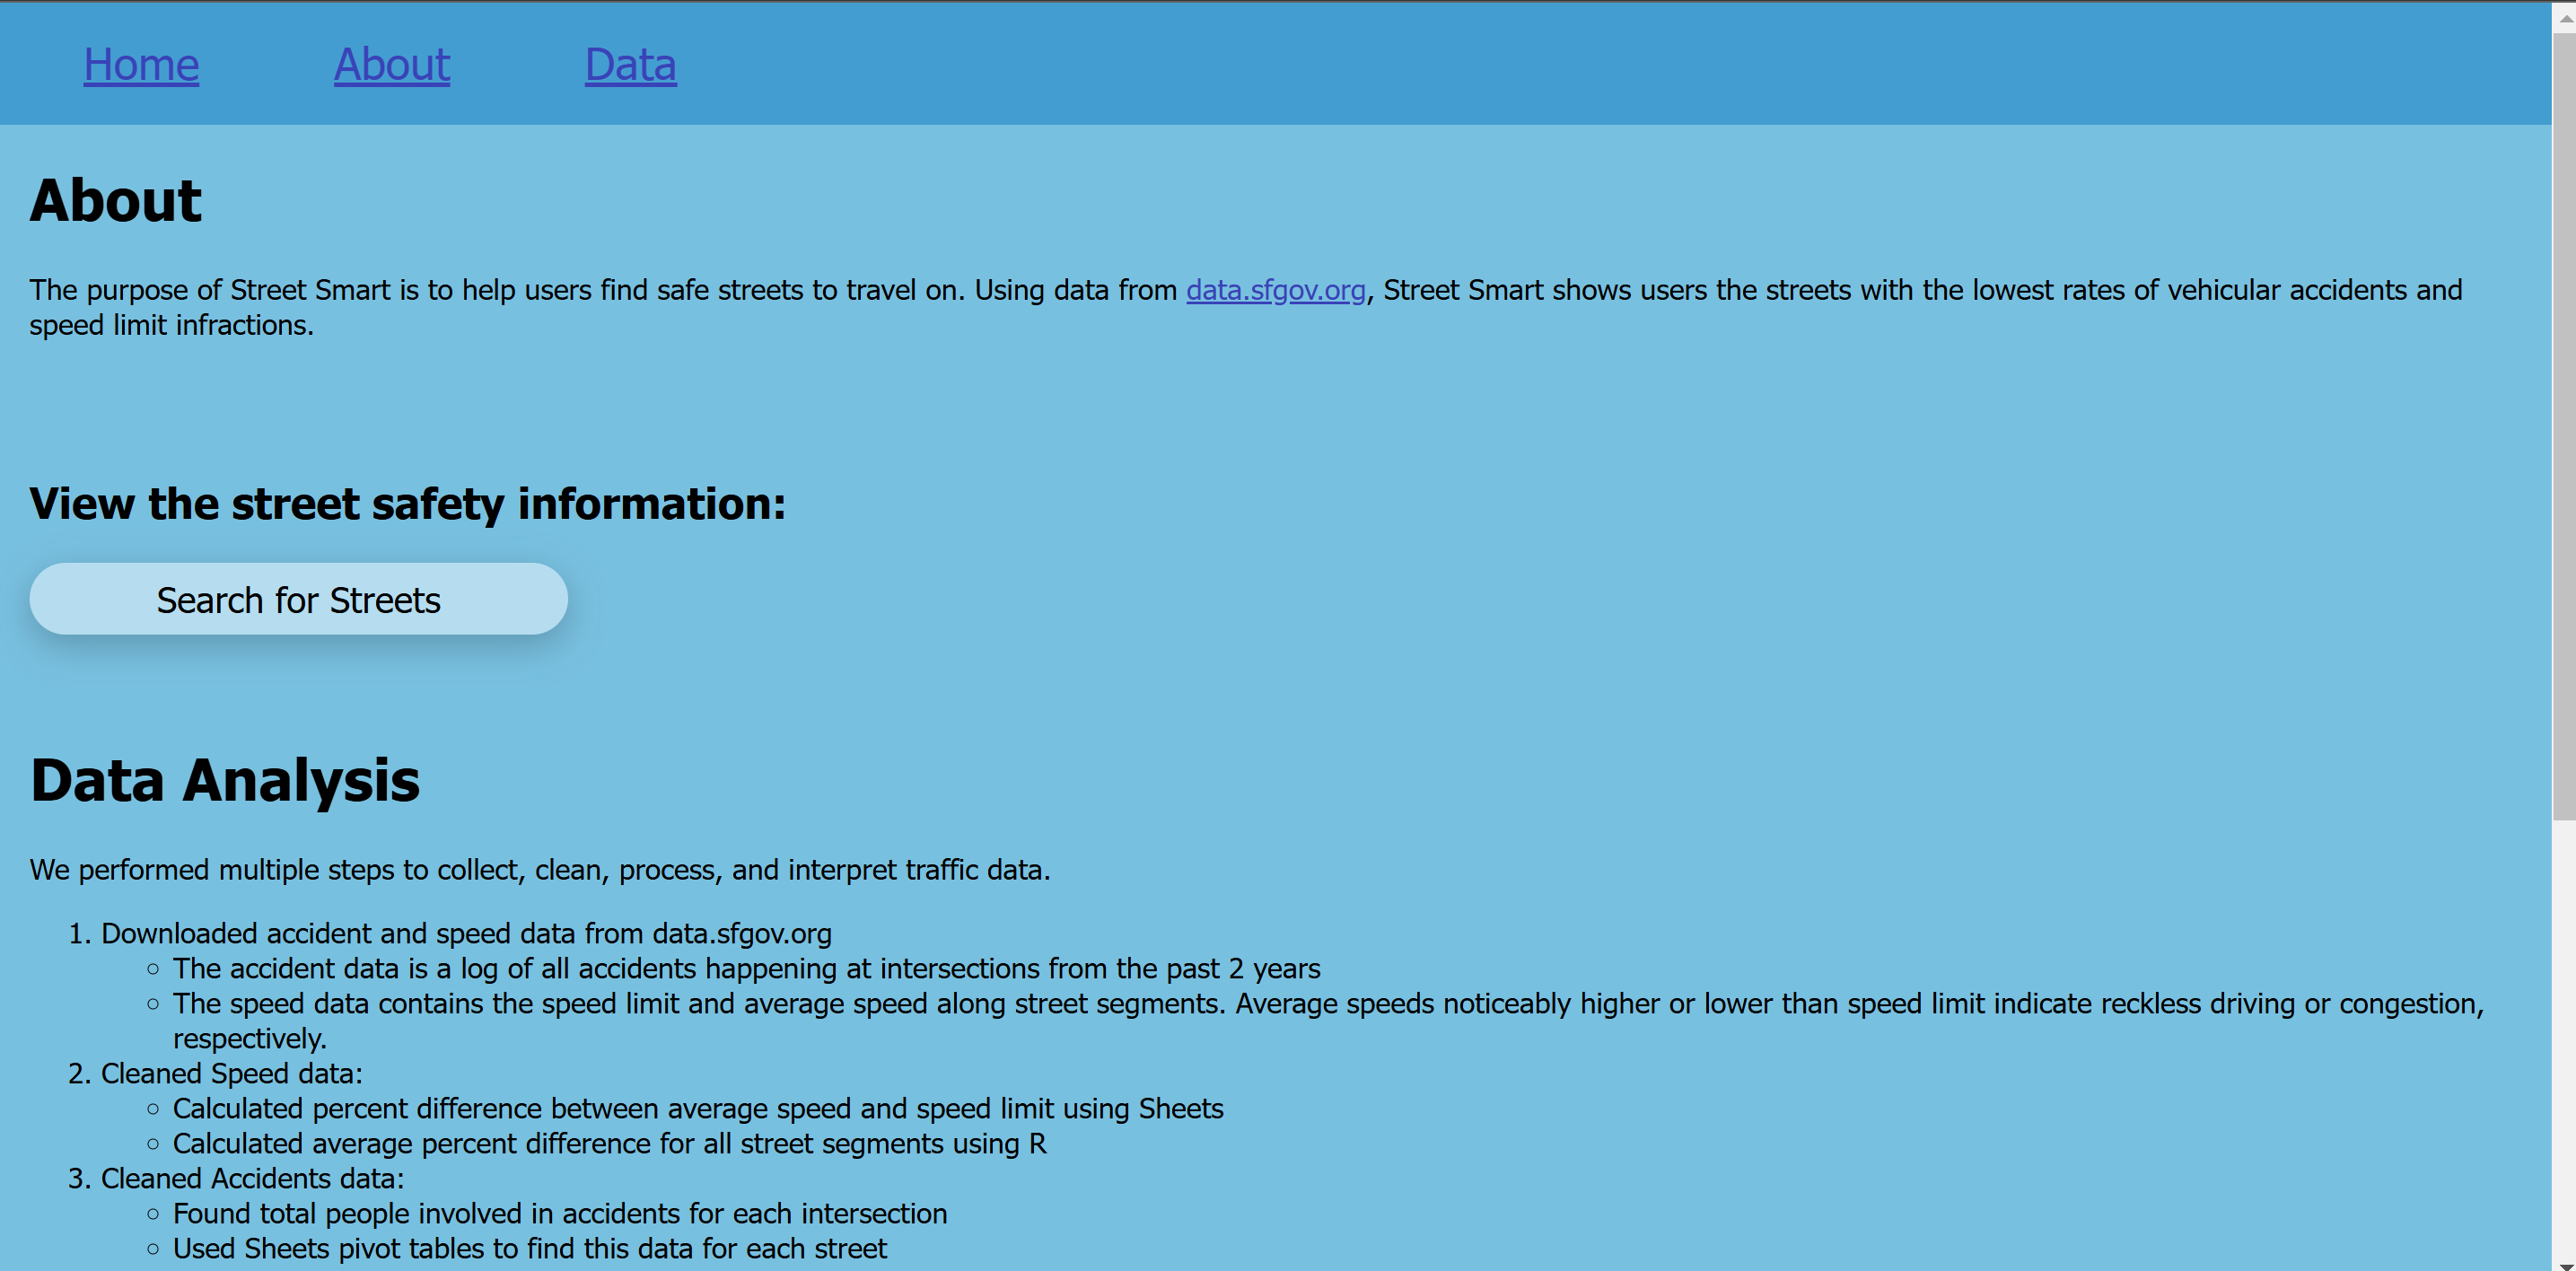
Our project has two main components: data analysis and a website to allow users to access our analysis. From the user side, the website provides functionality for the user to search for a street and see our rating of that street.
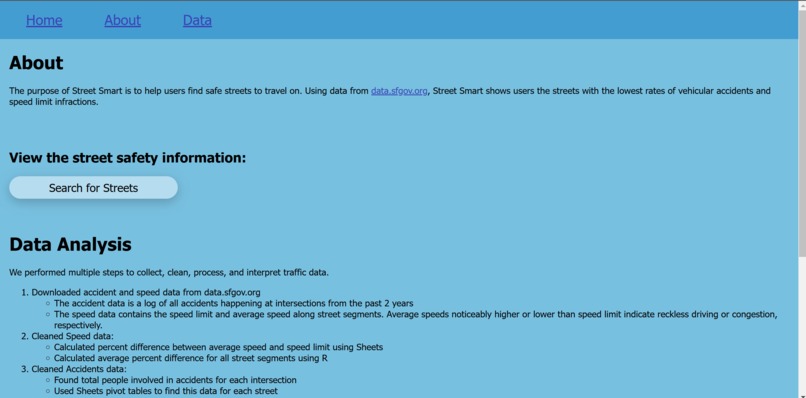
How we built it
First, we took publicly available driving data of the San Francisco area and cleaned, analyzed, and scored each street using Google Sheets combined with R. This involved iterations of filtering, averaging, pivot tables, and normalization. Then, we wrote a scoring function to combine the data and a tier rating function to more evenly distribute the scores. For the website, we created the pages using HTML and CSS. The data functionality was implemented using TypeScript.
Challenges we ran into
Starting off, aligning everyone in Git was a challenge. Pushing and pulling in a team context was new for us, but we got more comfortable with it as we went along. Another early challenge was cleaning the datasets to be usable for our goals, as well as aligning the data across multiple datasets. We found that some datasets were much smaller than others, making it less convenient to combine. Finally, getting a reasonable Score-to-Tier function took some trial and error due to outliers in that data that skewed the scores. However, intense scaling allowed us to arrive at a fairly reasonable score distribution in the end.
Accomplishments that we're proud of
We're happy that we got more comfortable with Git (plus writing reasonable commit messages)! We're also proud of the fact that everyone was able to contribute despite varying hackathon experience. For team members who had done a hackathon before, they felt more comfortable. We also set our scope to be reasonable, allowing us to finish our minimum viable product in a normal amount of time.
What we learned
We improved our data analysis skills overall, as well as brushing up on our website design. We learned that Git is very important to know when working in a team. We also experimented with new frameworks (React) though we ended up pivoting.
What's next for StreetSmart
There is a lot of room to expand this app! We can add both more data features to the scoring function (e.g. traffic citations, red lights run, etc.) as well as adding streets from other cities. Ultimately, this was a data analysis research project that can easily be applied on larger scales.


Log in or sign up for Devpost to join the conversation.