Inspiration
The inspiration is actually a website that I found on Instagram. It allowed you to connect to CCTV cameras in your area to take a selfie as you passed by. From this, I realized that open CCTV footage was a massive tool practically nobody was using to its fullest potential, so I built StreetAlpha.
What it does
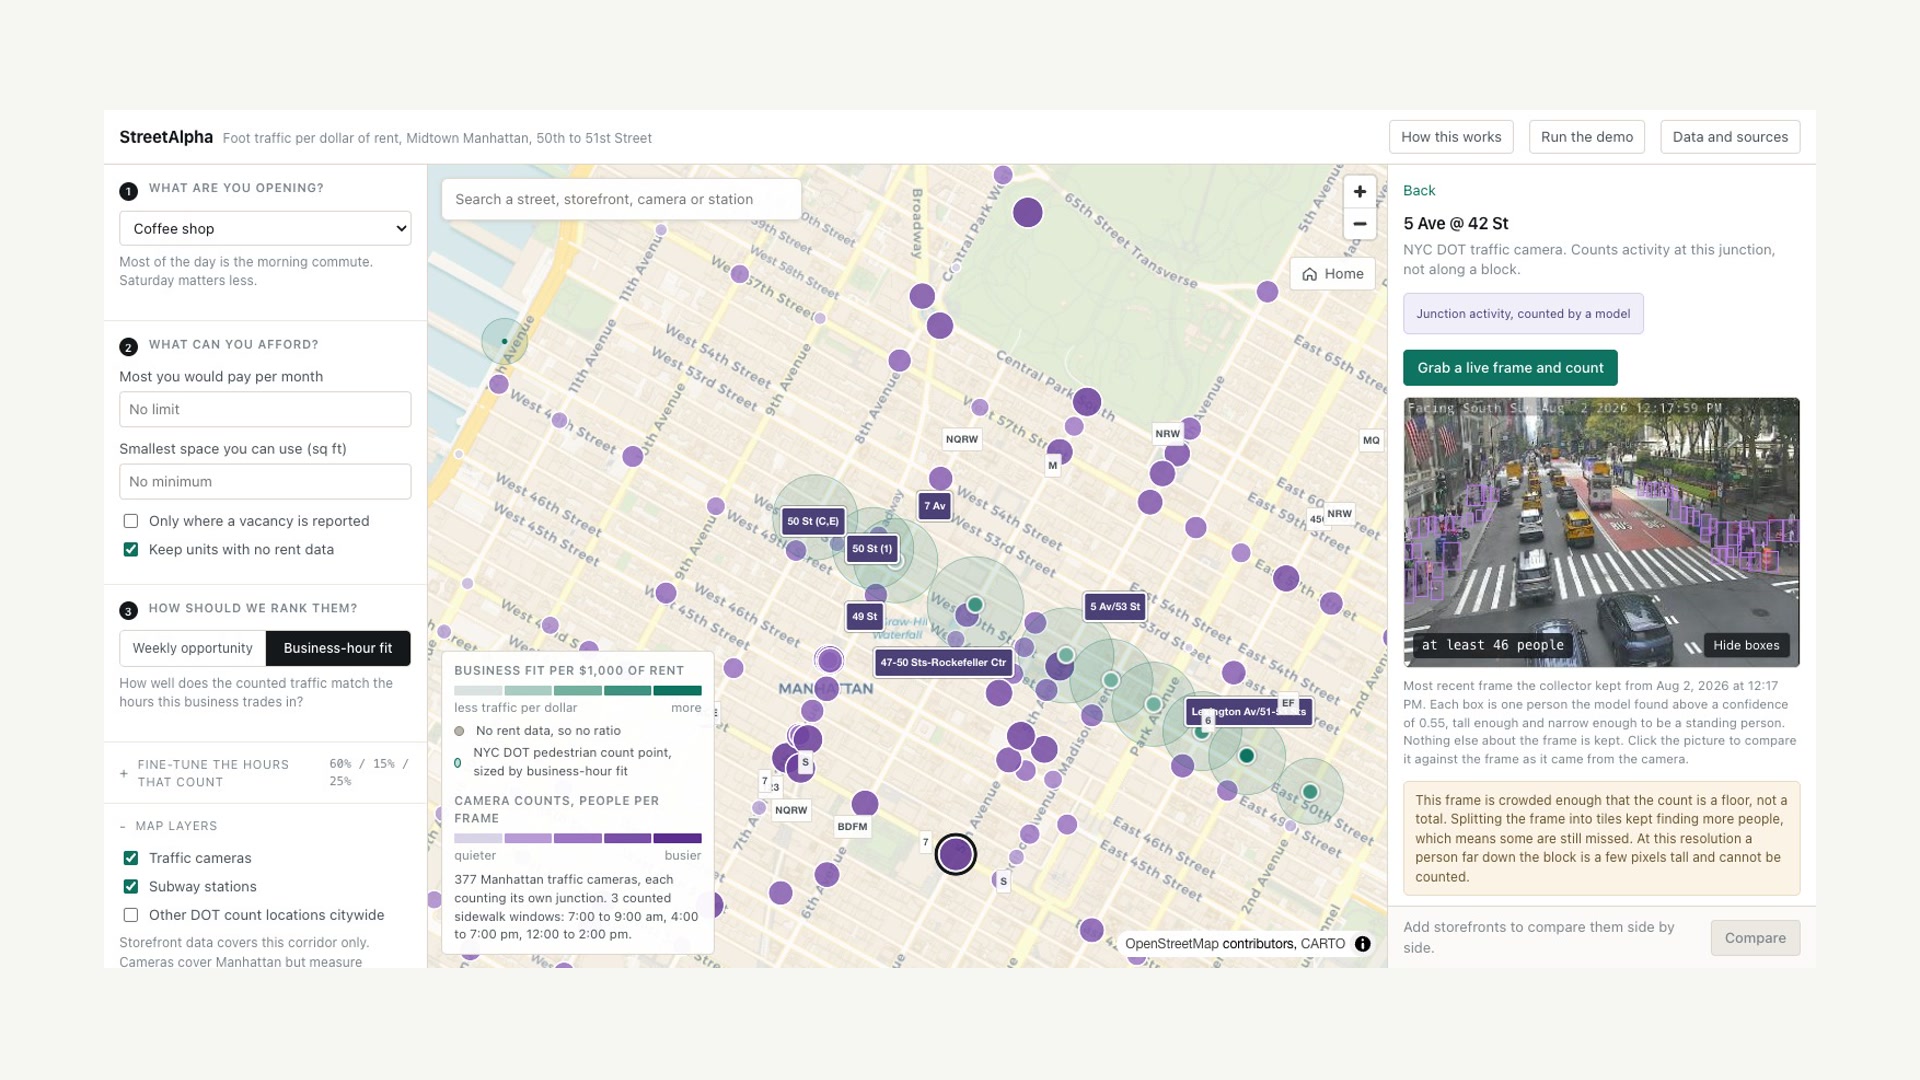
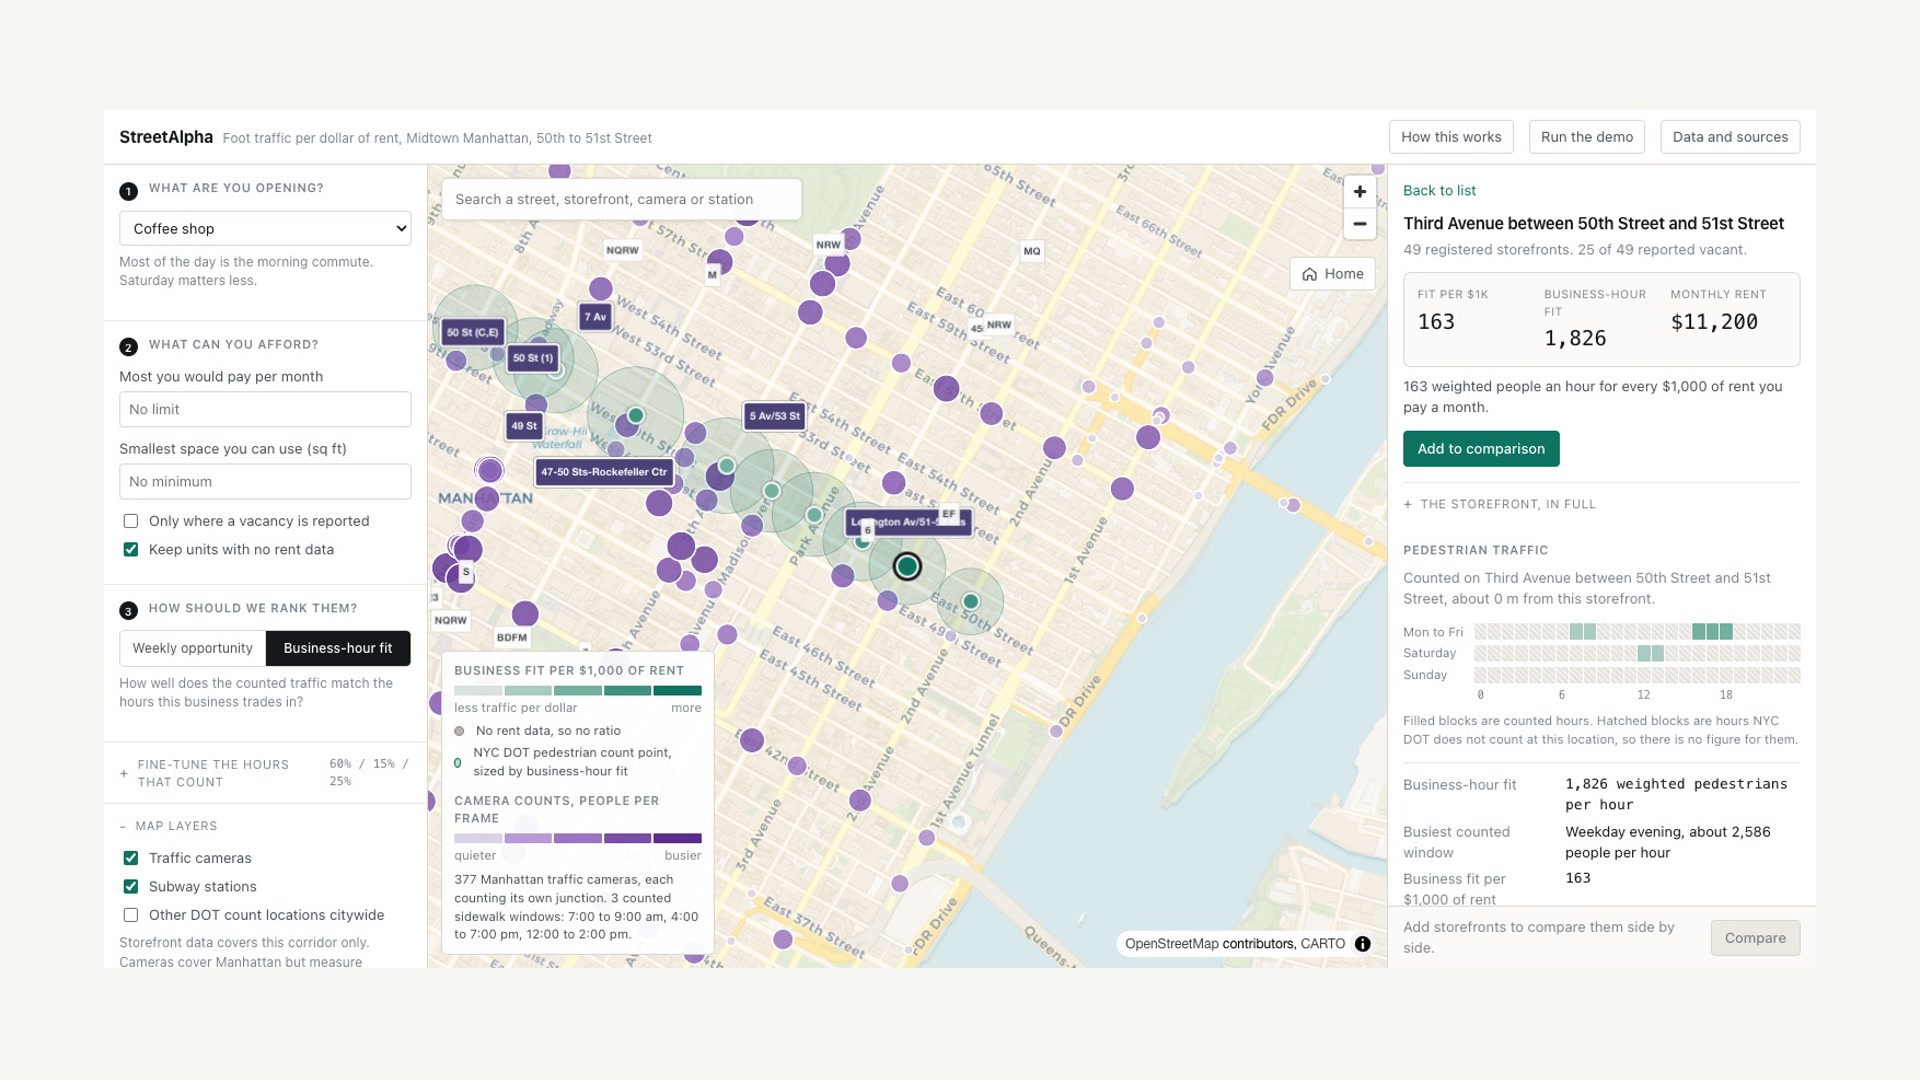
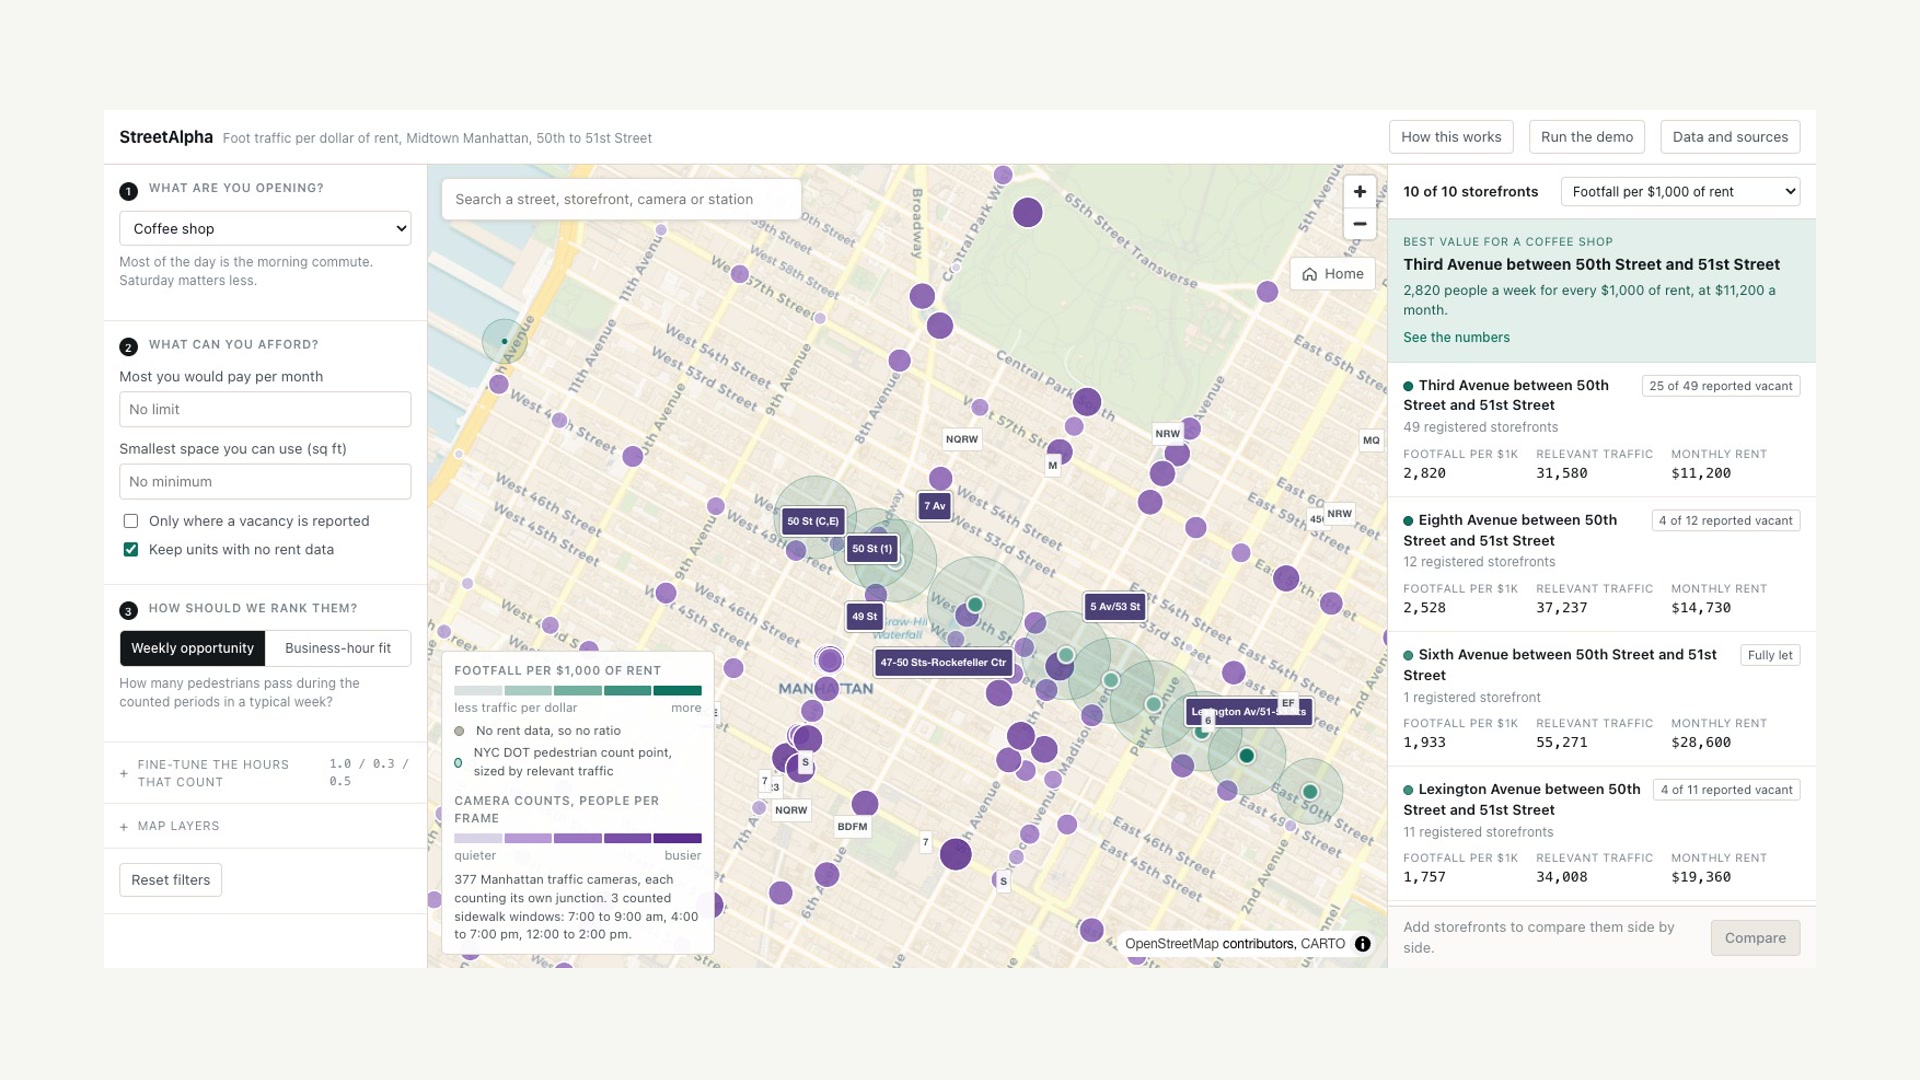
StreetAlpha answers one question for a small business: which location gives you the most useful foot traffic for the rent you would be paying? I pick a business type, set the hours I actually trade in, filter by budget and space, and it ranks ten Midtown blockfronts either by weekly opportunity or by how well each one's traffic lines up with my hours. The rents are real, taken from the registrations landlords file with the city every year, so they are what tenants signed rather than what a listing site advertises. That is where the CCTV comes in: the app watches all 377 public traffic cameras in Manhattan and counts the people at each one, so the map shows which junctions are busy right now instead of what a survey said two years ago. The result on the pilot corridor is that Seventh Avenue draws the most pedestrians but costs $39,158 a month and returns 1,896 of them per $1,000 of rent, while Third Avenue returns 5,358 at $11,200.
How we built it
React, TypeScript, Vite and MapLibre on the front end, with every figure traced to a source. Sidewalk counts come from NYC DOT's Bi-Annual Pedestrian Counts, rents and storefront inventory from the Department of Finance storefront registry filed under Local Law 157, and hourly activity from MTA subway ridership at the seven stations serving the corridor. The camera side is a service I wrote that sweeps all 377 Manhattan cameras and runs a DETR object detection model over every frame. On the nine corridor cameras I do it the way transport agencies do: the cameras refresh about every two seconds, so a burst of a dozen frames makes a short clip, people are tracked through it and counted once each however many boxes they draw, and anything that never moves is set aside as a fixed object. The collector runs continuously under a supervisor, sweeps the island in about 90 seconds, appends every reading to a log, and replays it on restart so nothing is lost.
Challenges we ran into
The data I assumed existed mostly did not. There is no daily or hourly sidewalk pedestrian count for any street in New York, and NYC DOT's automated pedestrian counters turned out to sit on park paths, average a few hundred people a day, and publish unvalidated readings, with one month at Emmons Avenue running about a hundred times its own median including sustained counts at three in the morning, so I left them out rather than clean them with a threshold I had invented. The cameras keep no archive either, only a live snapshot, so the only option was to start collecting forward. The hardest problem was working out what a camera actually measures: these cameras sit at junctions and point at the roadway, so they see people crossing, waiting at the kerb and turning the corner, which is a larger and different quantity from the people passing a shop mid-block. That changed the design. Camera figures are reported per junction and stay out of the storefront comparison, which rests on DOT's mid-block screenlines.
Accomplishments that we're proud of
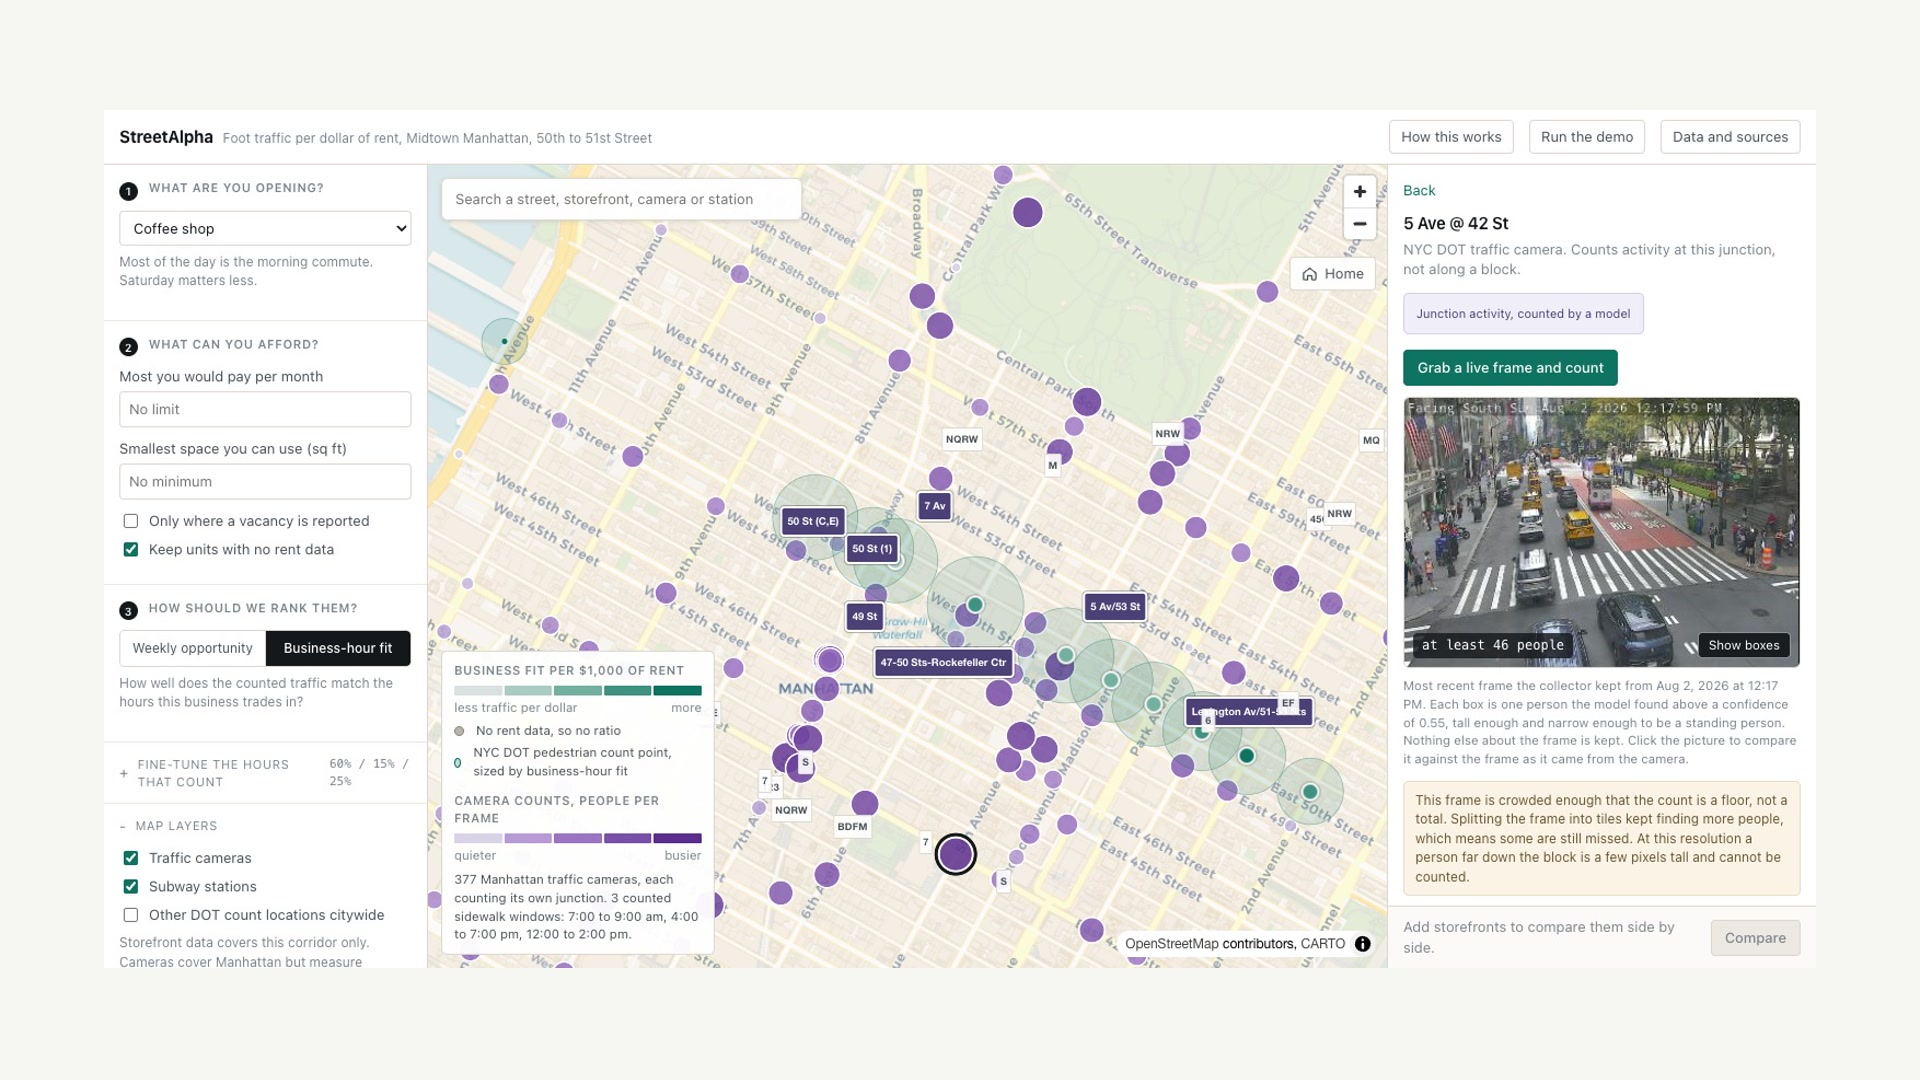
The camera pipeline works, and you can watch it work: open any camera, and it pulls a live frame and draws a box around every person it finds in about a second, or shows you the raw frame with the boxes off. Getting there took real work on a hard input, because at 352 by 240, a bollard and a standing person are both narrow vertical shapes, and no confidence threshold separates them. So each camera learns how tall a person should look in each part of its picture, spots that keep producing a detection across frames minutes apart are treated as street furniture, boxes too close together to be different people are merged, and every camera is scored on whether its own daily rhythm matches the city's. The ones pointed at motorways and bollard lines score below zero and get marked unusable. All nine corridor cameras pass, and the two nearest DOT's Fifth Avenue screenlines read 83 and 69 people a minute against DOT's 91.
What we learned
The biggest lesson was to measure the thing itself before scaling around it. My camera counts were too slow and were missing people in crowds, so I benchmarked models, tried quantization, and built a distributed work queue to borrow other computers. The actual problem was that the model's preprocessor was upscaling every 352 by 240 frame to 800 pixels on the short edge, paying four times the compute to blur away the people it was meant to count. Feeding the pixels at their native size made it eleven times faster and roughly twice as accurate, and the extra machines became unnecessary. The second lesson was about units: counting boxes in one still is the wrong measurement, because one person can draw four boxes and a pole draws one in every frame forever. Tracking people through a burst fixed both at once.
What's next for StreetAlpha
More corridors and mid-block cameras. The camera work is solid on junctions, so the next step is finding views that see a blockfront rather than a crossing, which is what a shop actually cares about, and calibrating those against the DOT screenline on the same block. After that, finer rent: the Department of Finance collects rent per storefront but publishes it only by census tract, so a unit-level figure needs either a FOIL request or landlord submissions, and that is what would make the footfall per dollar figure usable for an actual lease decision.
I used codex to review my codebase.
Built With
- detr
- maplibre
- mta-open-data
- node.js
- nyc-open-data
- onnx
- react
- socrata
- transformers.js
- typescript
- vite

Log in or sign up for Devpost to join the conversation.