-

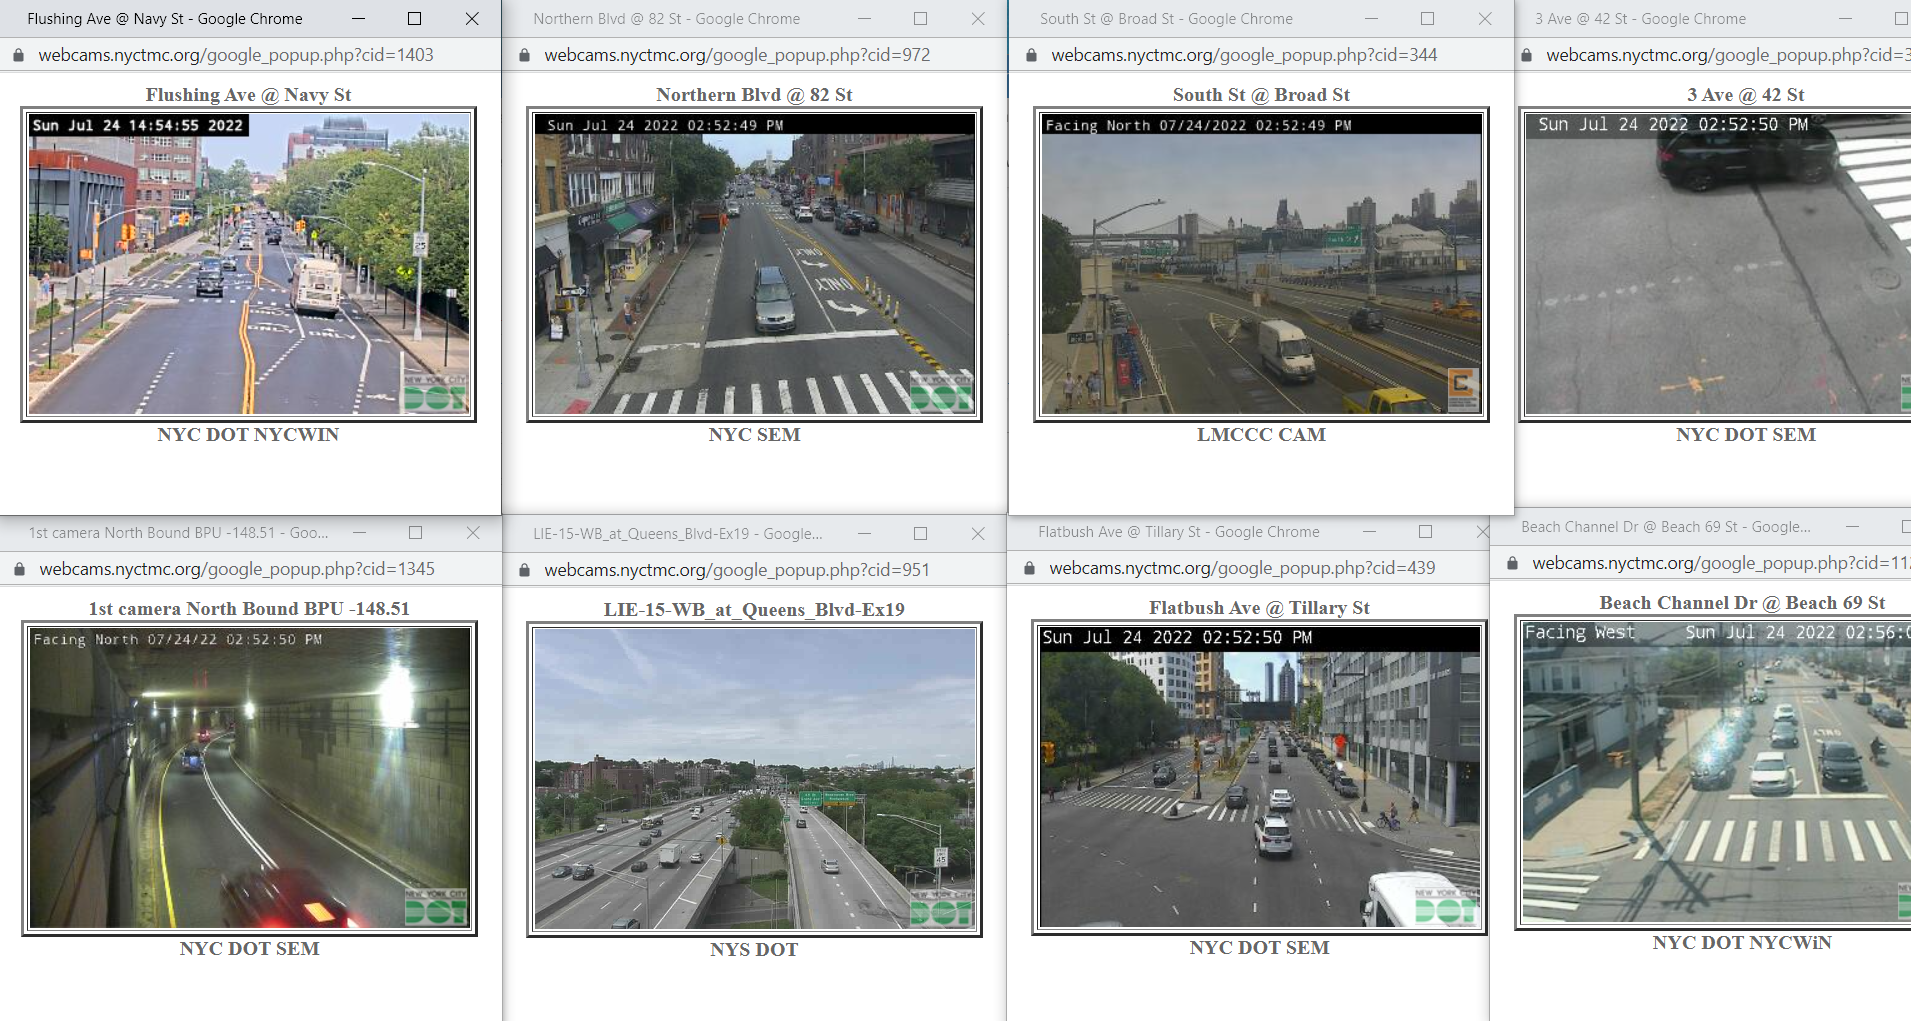
Our Data Derives from Live Traffic Camera Polylines
-
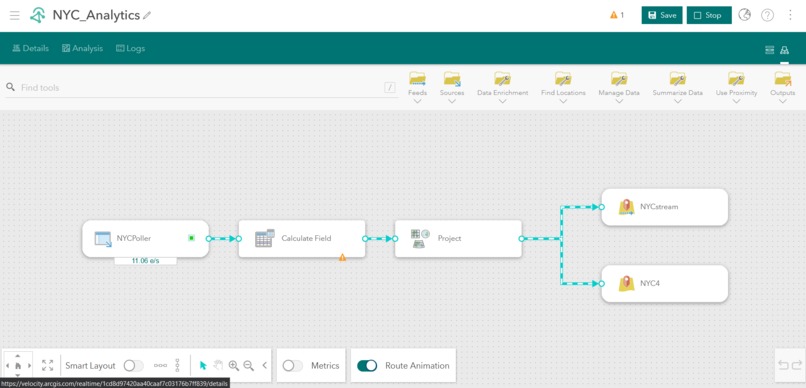
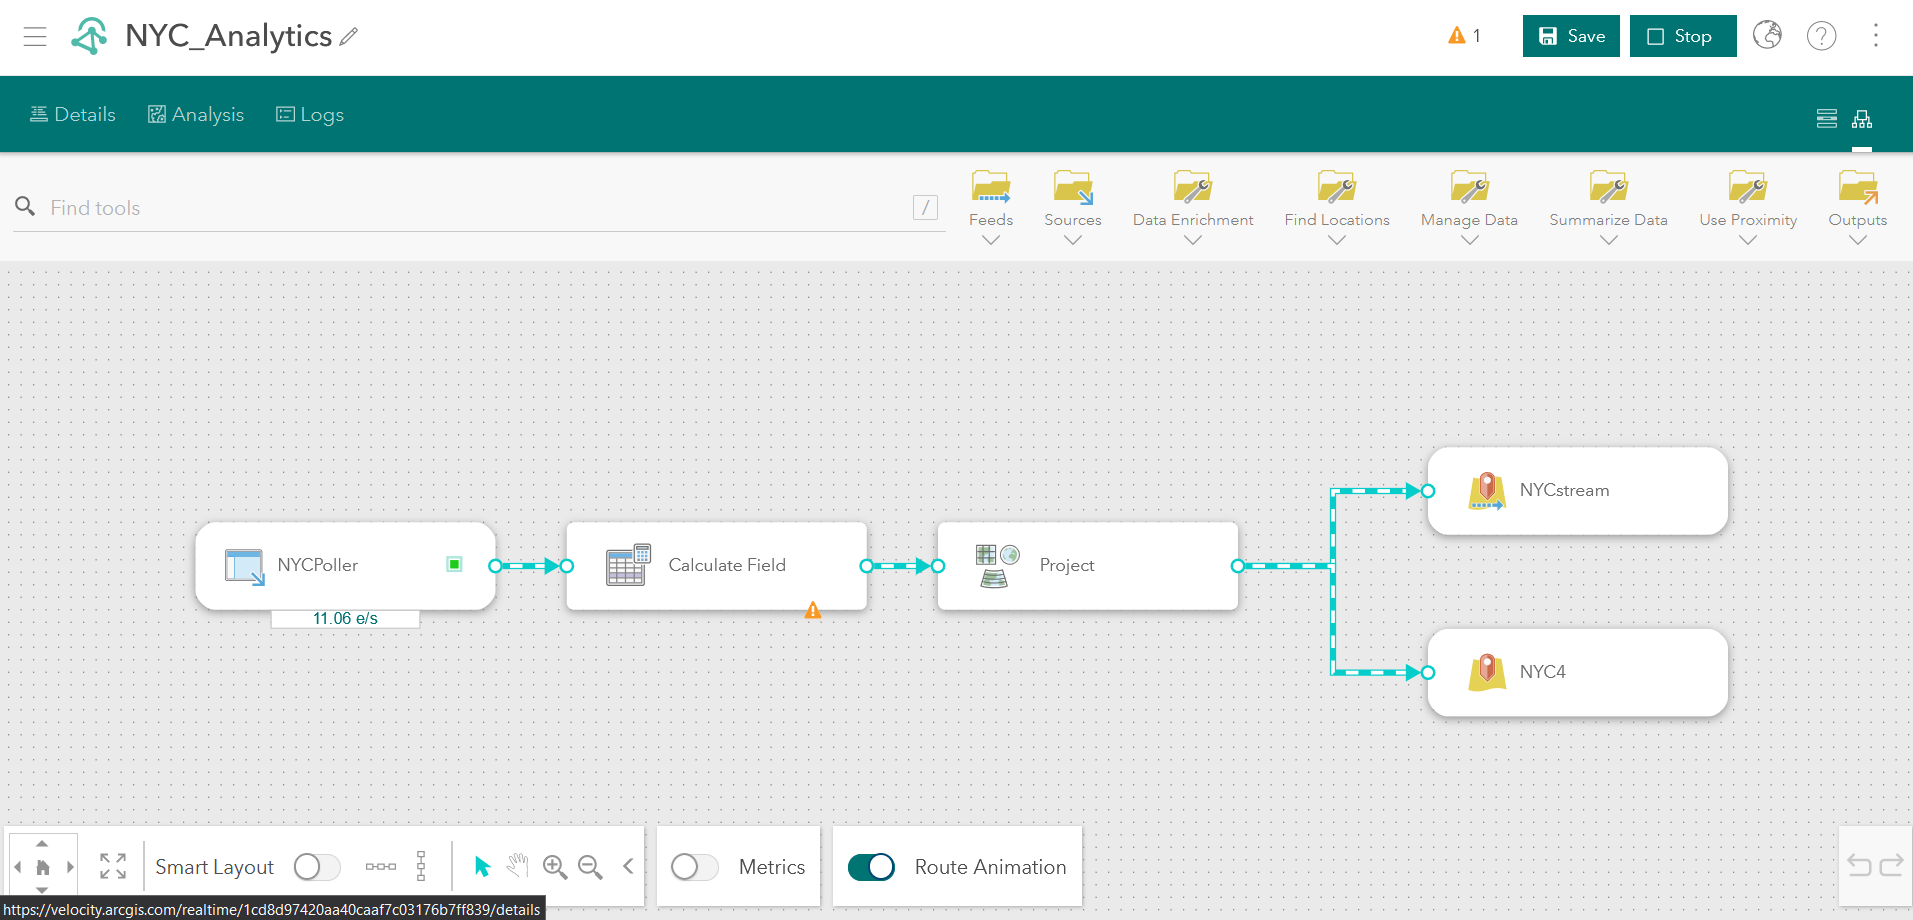
ArcGIS Velocity WorkFlow
-
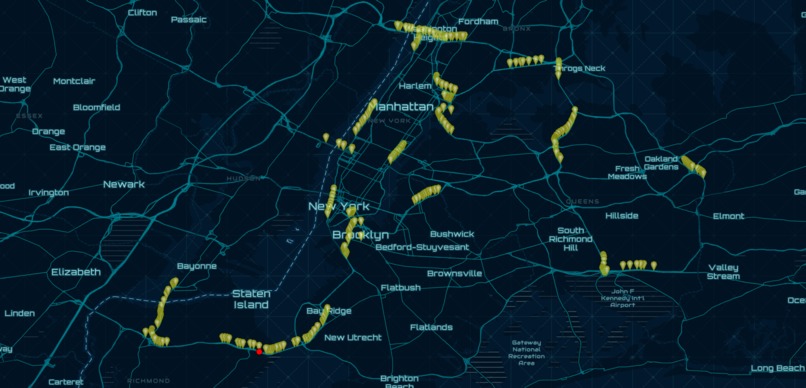
ArcGIS Pro MapView
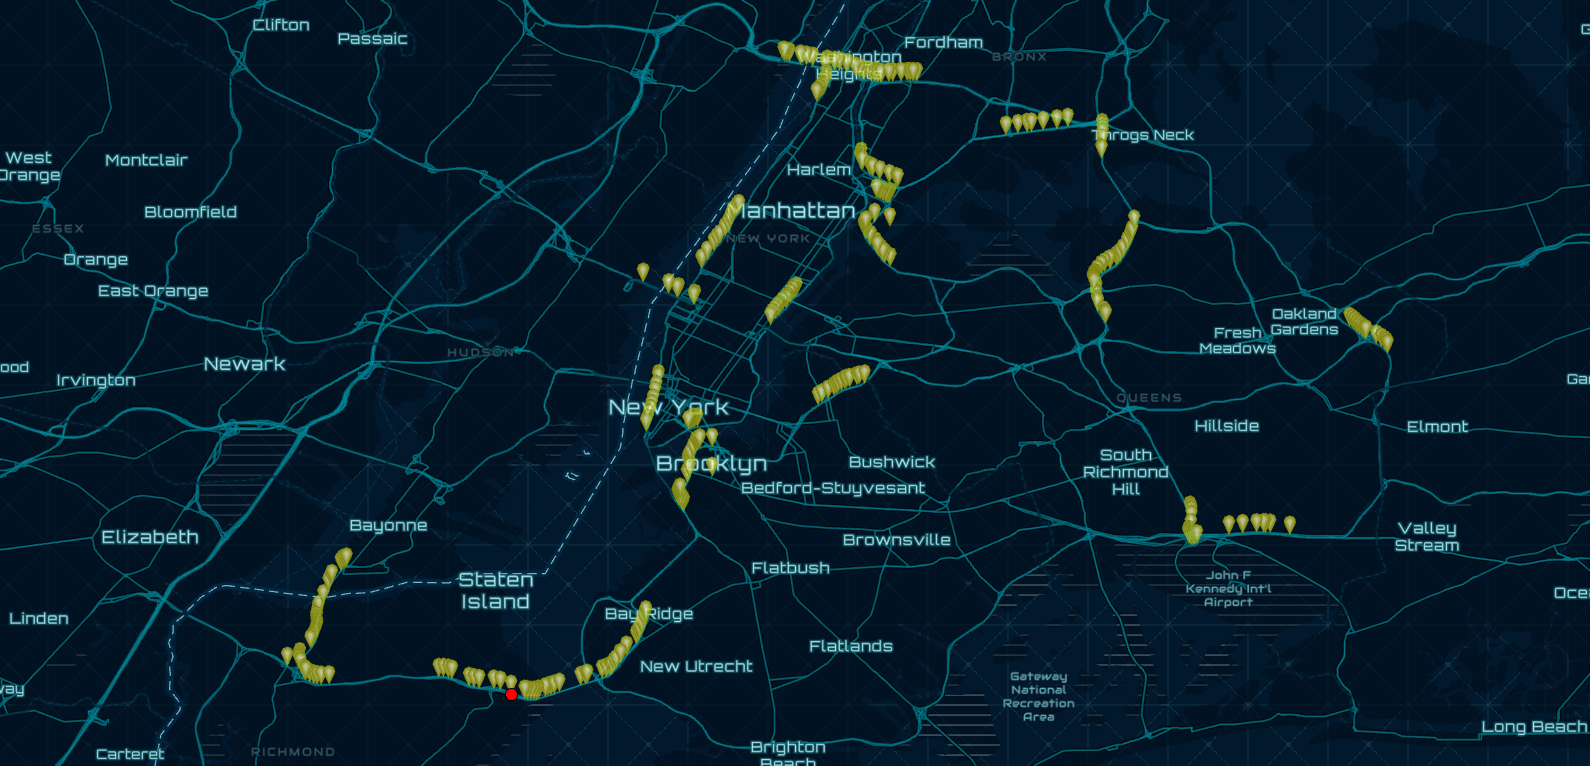
Inspiration
We wanted to pivot traffic models to a 'post pandemic' paradigm in order to empower everyone with the knowledge of how the world around us continues to change.
What it does
Our application shows how mobility changes throughout the day now that we live in a hybrid world.
How we built it
By taking data from the NYC Open Data Portal, we processed the data through ArcGIS, ArcGIS Velocity and the GeoAnalytics Engine.
Challenges we ran into
Using newly released technologies can be a challenge and sometimes even when everything works you may still not get the output you desire. But with a little creativity you can still meet the vision you laid out
For example, our sample dataset was configured to be co-compatible with Google's ecosystem rather than ESRI's. Therefore we ran into issues surrounding the auto conversion of that data from Google's proprietary algorithm encoded in ASCII to the default UTF. Similarly when testing the dataset despite being written in a degree, minute, second format the data points would be plotted on a generic Cartesian plane.
Accomplishments that we're proud of
We are proud of our resourcefulness, vision, the ability to work together as a team, troubleshoot and pivot as problems arouse, and making meaningful contributions to Esri products.
What we learned
We learned a lot about the GeoAnalytics Engine, ArcGIS Velocity, Python, troubleshooting rare geospatial issues and communicating and pitching our vision to others.
What's next for Street Smart
We built Street Smart with scalability in mind. With a little additional configuration and capital this could be achieved in real time in any city around the world using live anonymized cell phone geolocation. Furthermore, additional features can be added such as running it through machine learning models and AI.
Built With
- arcgis-velocity
- geoanalytics-engine
- nyc-open-data
- python


Log in or sign up for Devpost to join the conversation.