Inspiration
A healthy stream is more than just a healthy stream. The water around us is connected to the health of people, animals, and the ecosystems we all share.
But when you collect measurements like pH, temperature, water clarity, or habitat conditions, those numbers can be difficult to understand without a scientific background.
That’s where StreamPulse started.
I wanted to make local stream monitoring easier to explore and easier to communicate—to bring observations together, show how conditions change over time, and help people understand why those changes might matter.
That idea naturally connects with the One Health approach: human health, animal health, and environmental health are deeply connected.
What it does
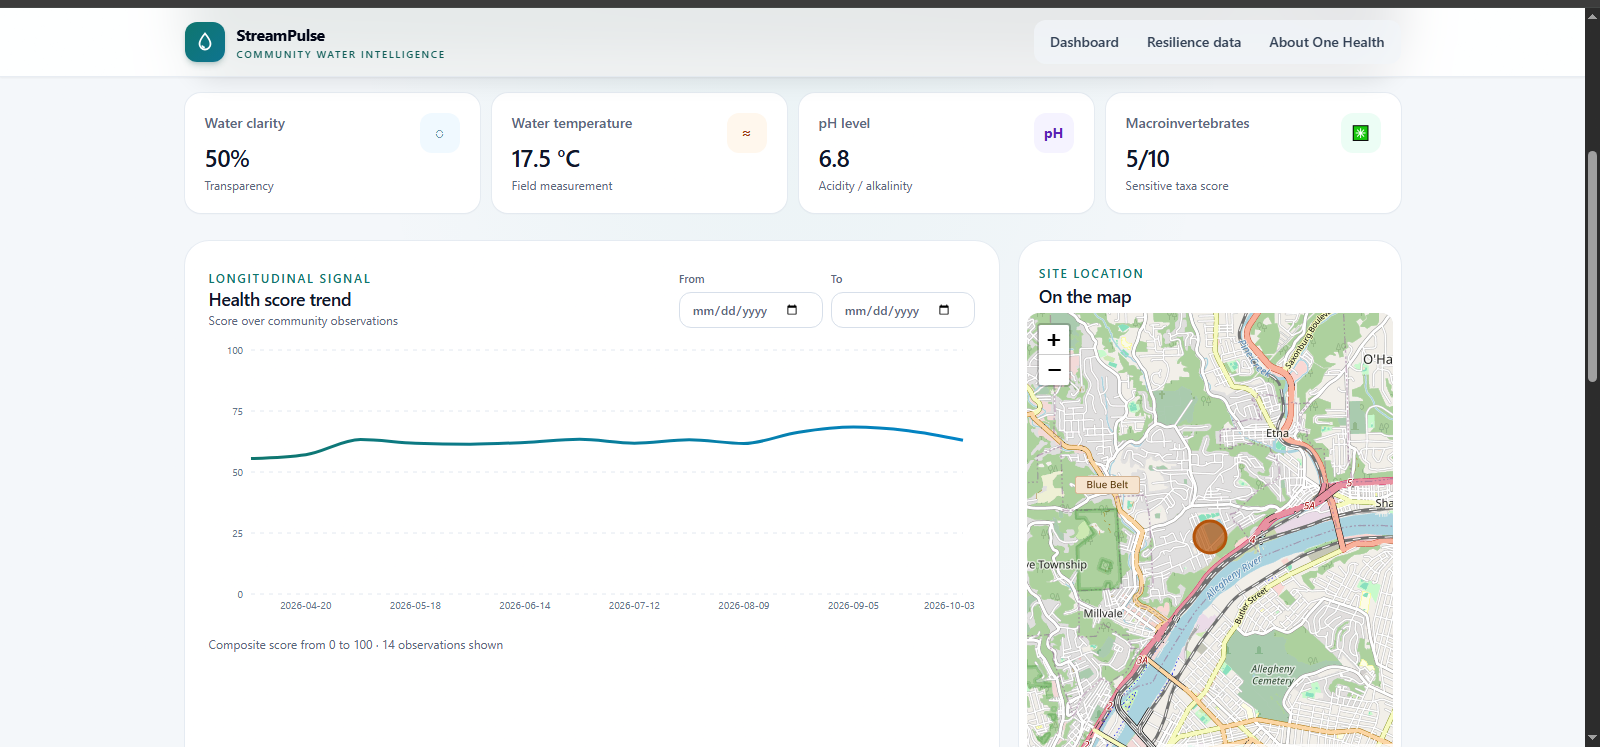
StreamPulse turns individual stream observations into a simple watershed dashboard.
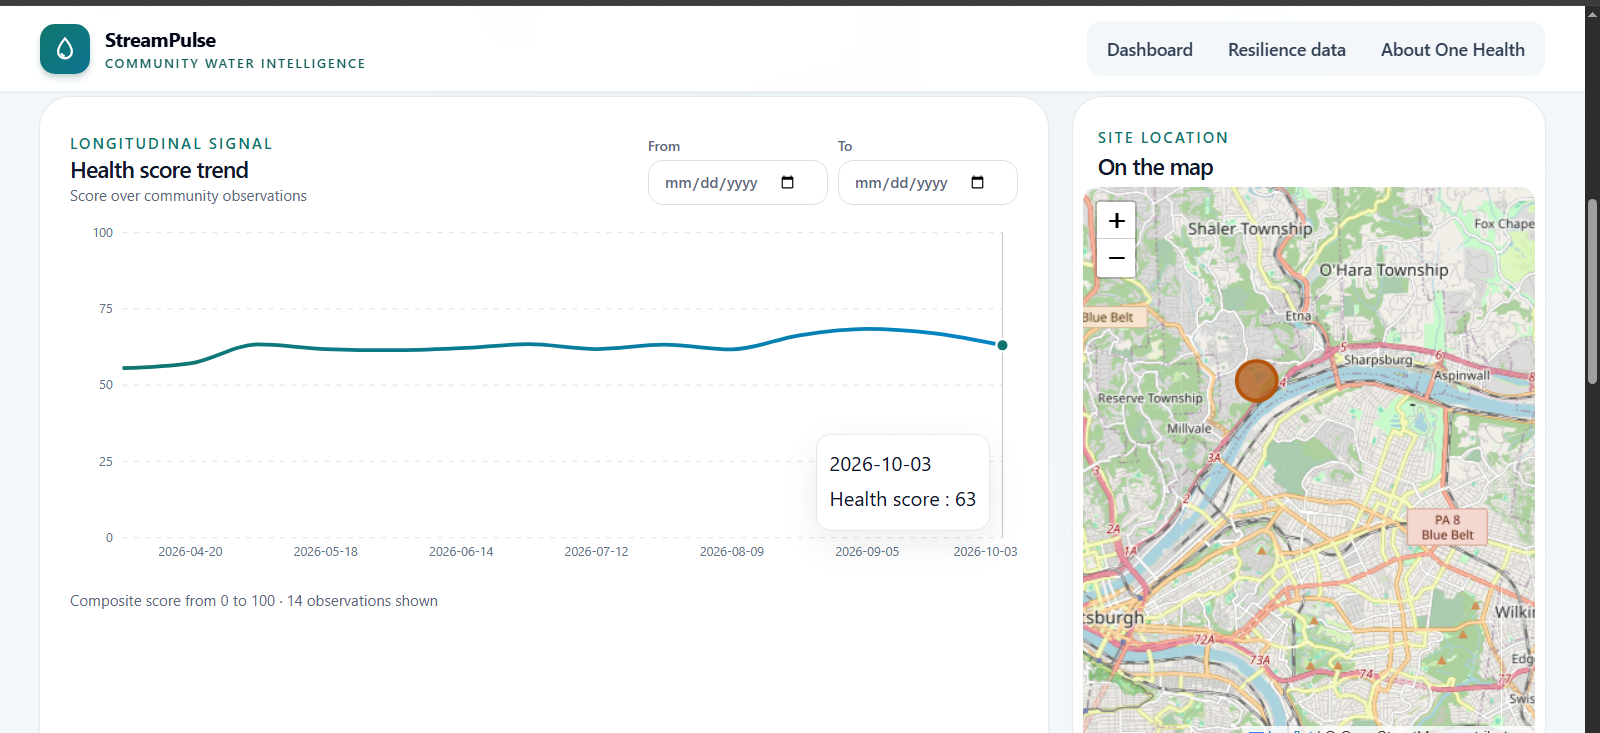
You can explore streams on a map, see which sites may need attention, open an individual stream profile, and look through its observation history.
Each profile brings together six indicators:
- Water clarity — 20%
- pH — 15%
- Temperature — 10%
- Macroinvertebrate score — 25%
- Visible pollution signs — 15%
- Habitat score — 15%
These indicators are combined using a transparent weighted formula to produce a score from 0 to 100.
The important part is that the score isn't a black box. Users can see what goes into it and still access the underlying measurements.
StreamPulse also looks at recent scores to show whether a stream appears to be improving, worsening, or staying stable.
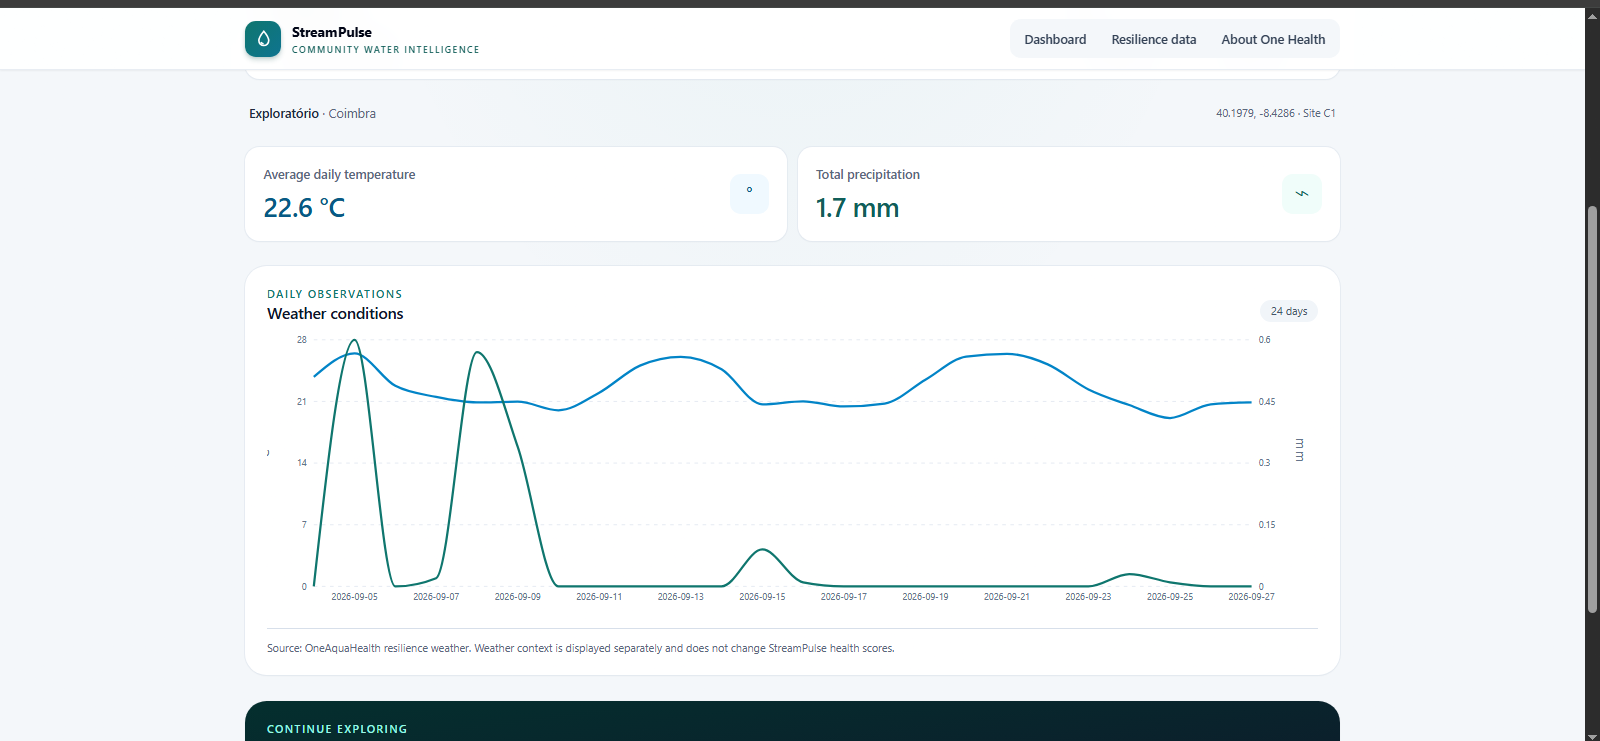
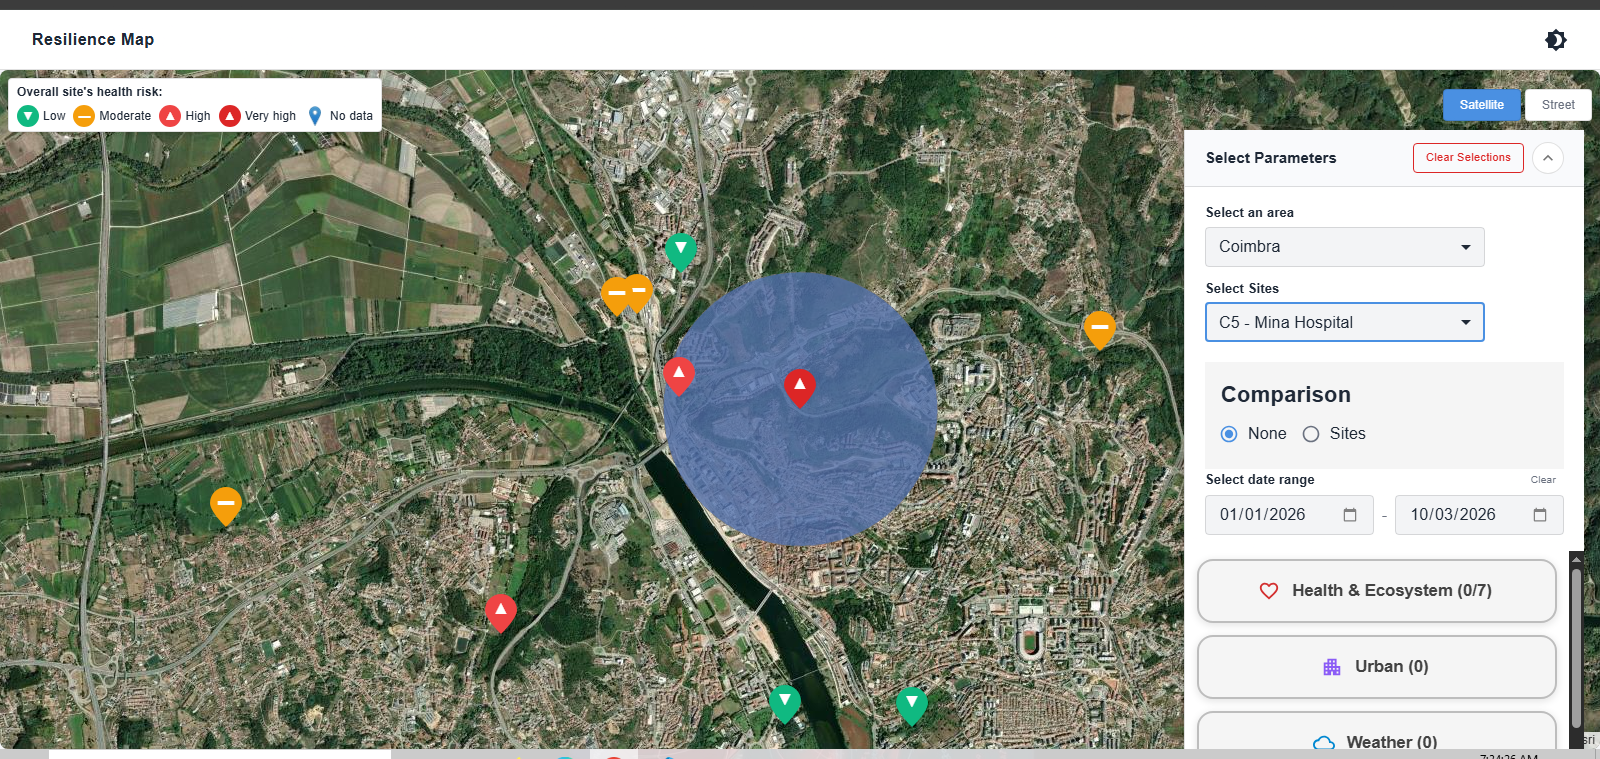
For additional environmental context, the Research Resilience page connects to OneAquaHealth research sites and displays daily temperature and precipitation for a selected date range.
I intentionally keep that weather data separate from StreamPulse's stream-health score. It provides context; it doesn't change the local assessment.
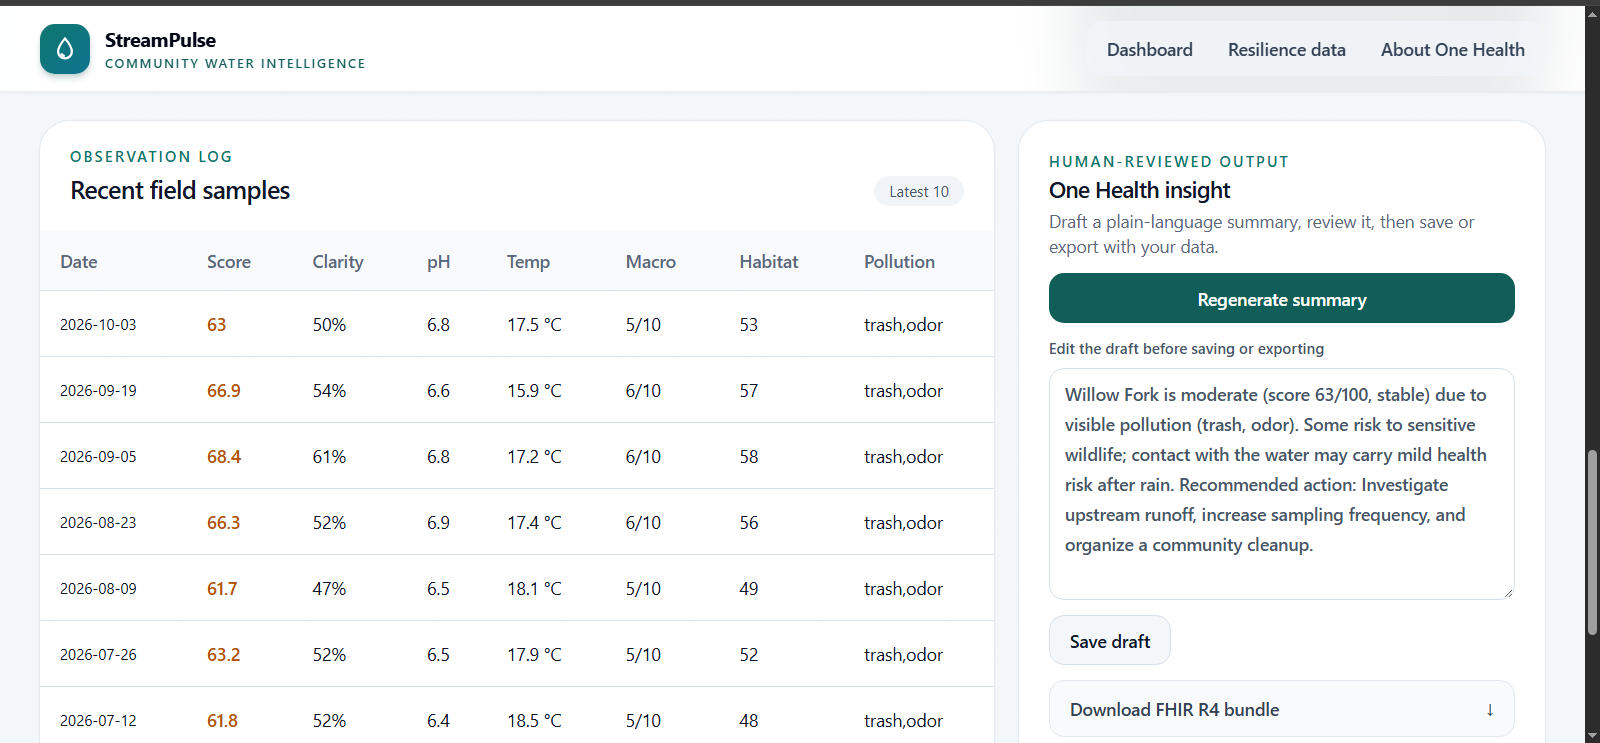
When a Gemini API key is configured, StreamPulse can also turn the latest readings, score, and trend into a plain-language One Health summary.
The summary can be reviewed and edited by a person before being saved or included in a FHIR R4 JSON export.
How I built it
I built StreamPulse with Next.js, TypeScript, and the App Router, with Prisma connecting to Supabase-hosted PostgreSQL.
For the interface, I used Leaflet for the watershed map and Recharts for the time-series visualizations.
When observations are submitted, the measurements and calculated score are stored together. The scoring system normalizes and clamps the indicators before applying their weights, while the trend compares the latest three scores with the three before them.
For the AI layer, Gemini receives the latest observation data, calculated score, status, and trend. I instruct it to explain possible risks and suggest reasonable next steps without making up measurements.
And importantly, the app doesn't stop working if Gemini isn't available. A deterministic, rule-based summary acts as a fallback.
I also added FHIR export, which creates a Bundle containing the stream's Location, recorded Observation resources, and an optional DiagnosticReport containing the human-reviewed summary.
The OneAquaHealth integration works as a read-only server-side proxy. It retrieves research sites and weather securely, validates the returned data, and keeps upstream requests and credentials away from the browser.
Challenges I ran into
One of my biggest challenges was moving from a local SQLite database to PostgreSQL for deployment.
A local database file works well during development, but it isn't reliable shared storage for a serverless application. I had to rethink how Prisma connected to the database and configure Supabase for both runtime requests and database operations.
Another challenge was keeping different data sources honest.
My demonstration streams are in Pittsburgh, while the OneAquaHealth research sites are in Europe. Connecting those datasets as if they represented the same locations would have created a misleading relationship.
So instead of forcing the data together, I gave the OneAquaHealth weather its own space in the application.
That taught me something important: integrating data isn't just about connecting APIs. It's about preserving the meaning and context of that data.
I also wanted StreamPulse to remain useful when external services fail. The weather integration validates responses and has a timeout, while the AI summary falls back to deterministic rules if Gemini isn't available.
What I'm proud of
I'm proud that I turned what could have been several disconnected features into one complete workflow:
explore a watershed → inspect a stream → understand its measurements → see how conditions are changing → generate an explanation → export the results.
I'm especially proud of the transparency behind the health score.
The weights are visible, the calculations are deterministic, and Gemini doesn't decide the score.
The data determines the score. AI helps explain it. A person remains in the loop.
That distinction was important to me.
What I learned
One of my biggest lessons was that environmental data becomes much more useful when people can understand where it came from, what it means, and where its limitations are.
A single score can make a watershed easier to scan, but it shouldn't hide the measurements behind it.
I also learned that AI works best here as an assistant, not an authority.
Gemini can help turn technical observations into language that more people can understand, but the summary is still reviewed by a person before it is shared.
And finally, I learned that sometimes the responsible choice is not to combine datasets.
Weather can provide valuable context, but only when the location and time period actually make sense. Keeping those boundaries clear makes the overall system more trustworthy.
What's next for StreamPulse
There are several directions I'd like to take StreamPulse.
First, I'd like to make field monitoring easier with a mobile-friendly observation workflow, including photo attachments and clearer data provenance for community and imported observations.
I'd also like to add alerts when a stream's trend begins to worsen.
On the interoperability side, I want to strengthen FHIR validation and eventually support direct export to a FHIR server.
For the AI experience, I'd like users to clearly see whether a summary came from Gemini or the rule-based fallback, and eventually support multilingual summaries so the information can reach more local communities.
The current OneAquaHealth integration is read-only, so another future step would be supporting the exchange of community observations with that ecosystem.
Ultimately, I see StreamPulse as a bridge between environmental measurements and human understanding.
The goal isn't to replace scientists or laboratory testing.
It's to make the information we already collect easier to explore, easier to discuss, and easier to act on—because healthier waterways contribute to healthier communities, animals, and ecosystems.


Log in or sign up for Devpost to join the conversation.