Cineflix
Inspiration
Streaming platforms generate an enormous amount of viewer data, but turning that data into clear, actionable decisions can be difficult. We were inspired by a simple question: What if streaming teams could talk to their analytics instead of manually searching through dashboards?
That idea led us to build Cineflix, an AI-powered streaming analytics platform designed to transform viewer telemetry into understandable insights and practical recommendations.
Instead of only showing numbers, Cineflix helps answer questions such as:
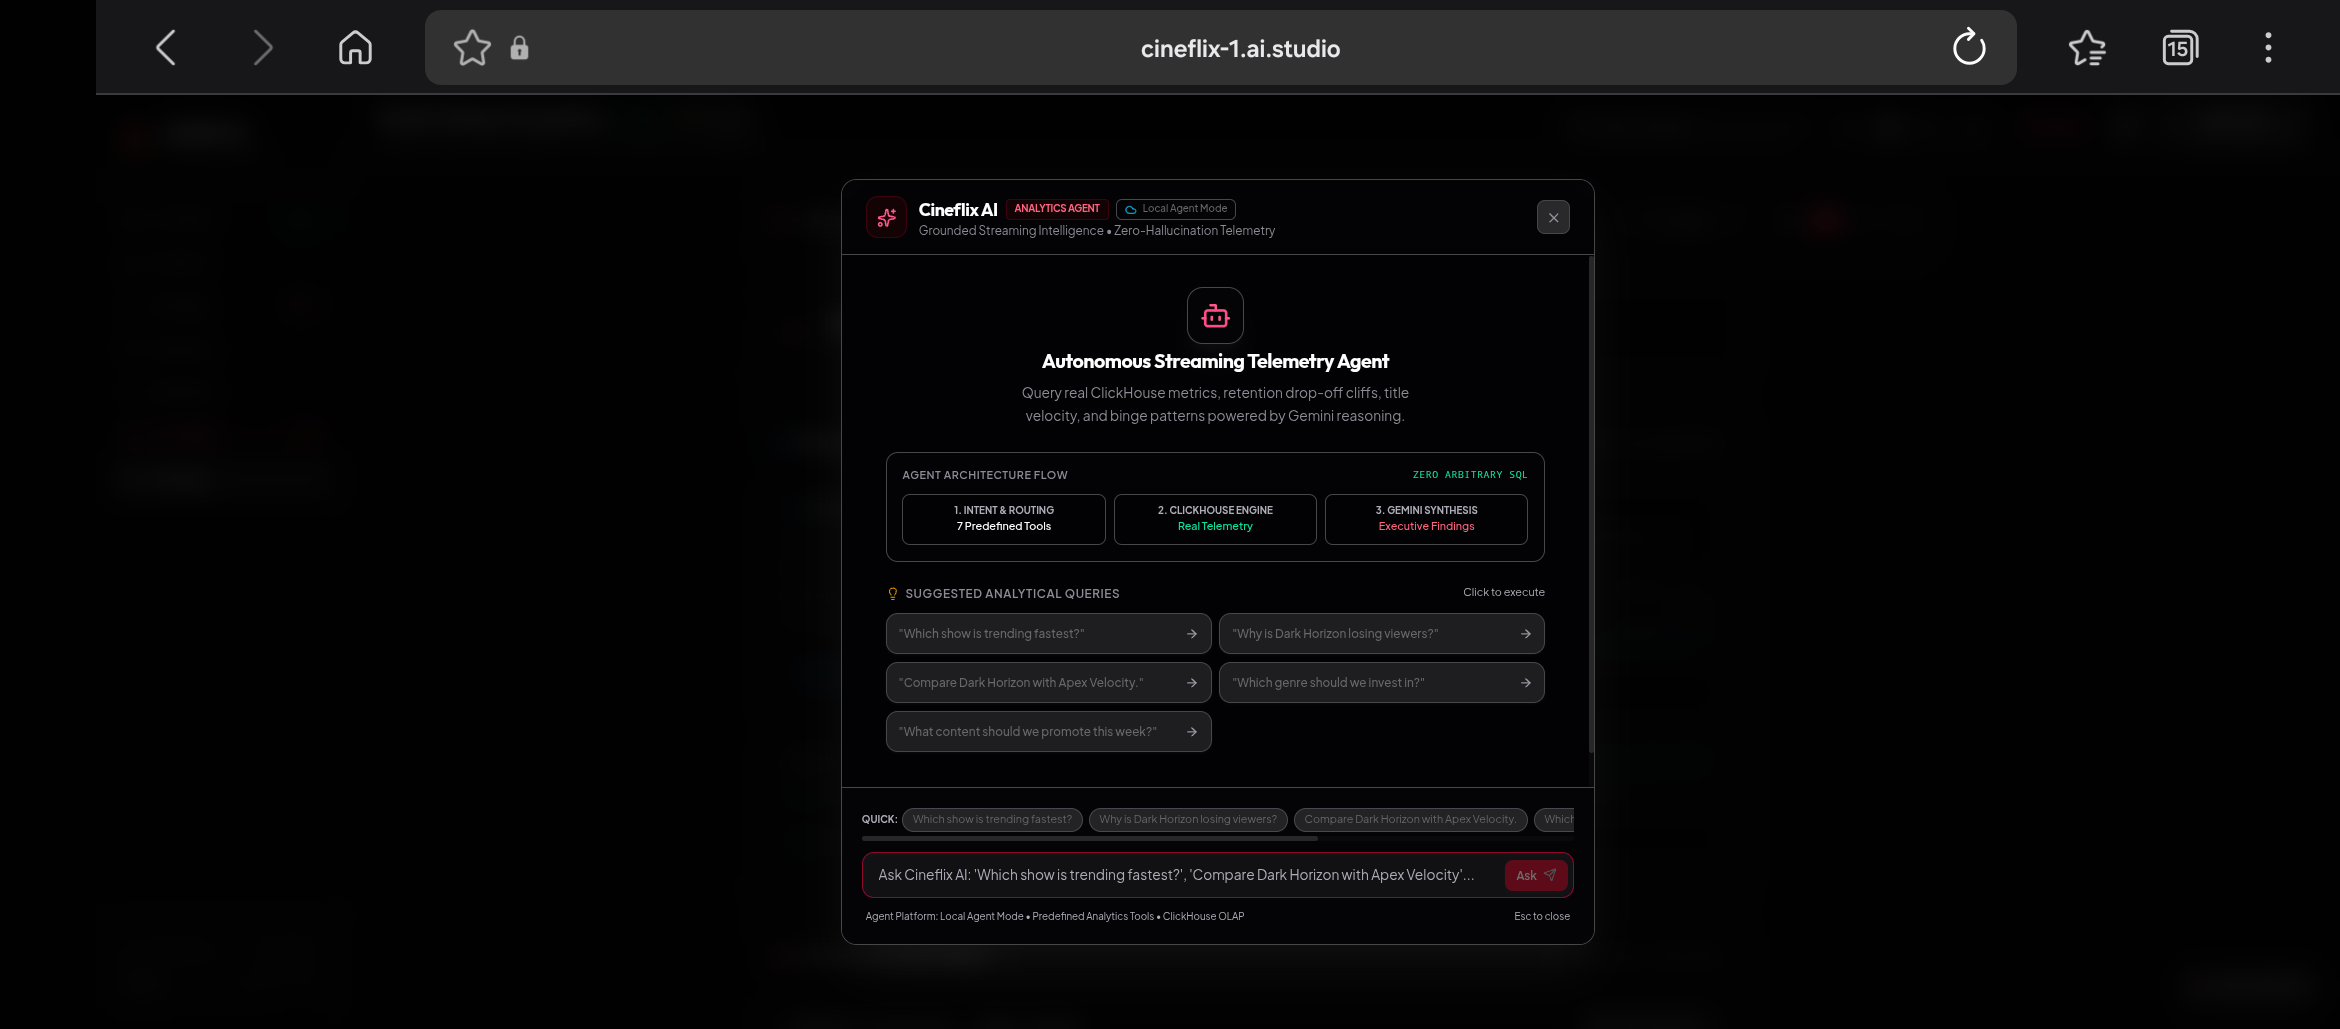
- Which show is trending fastest?
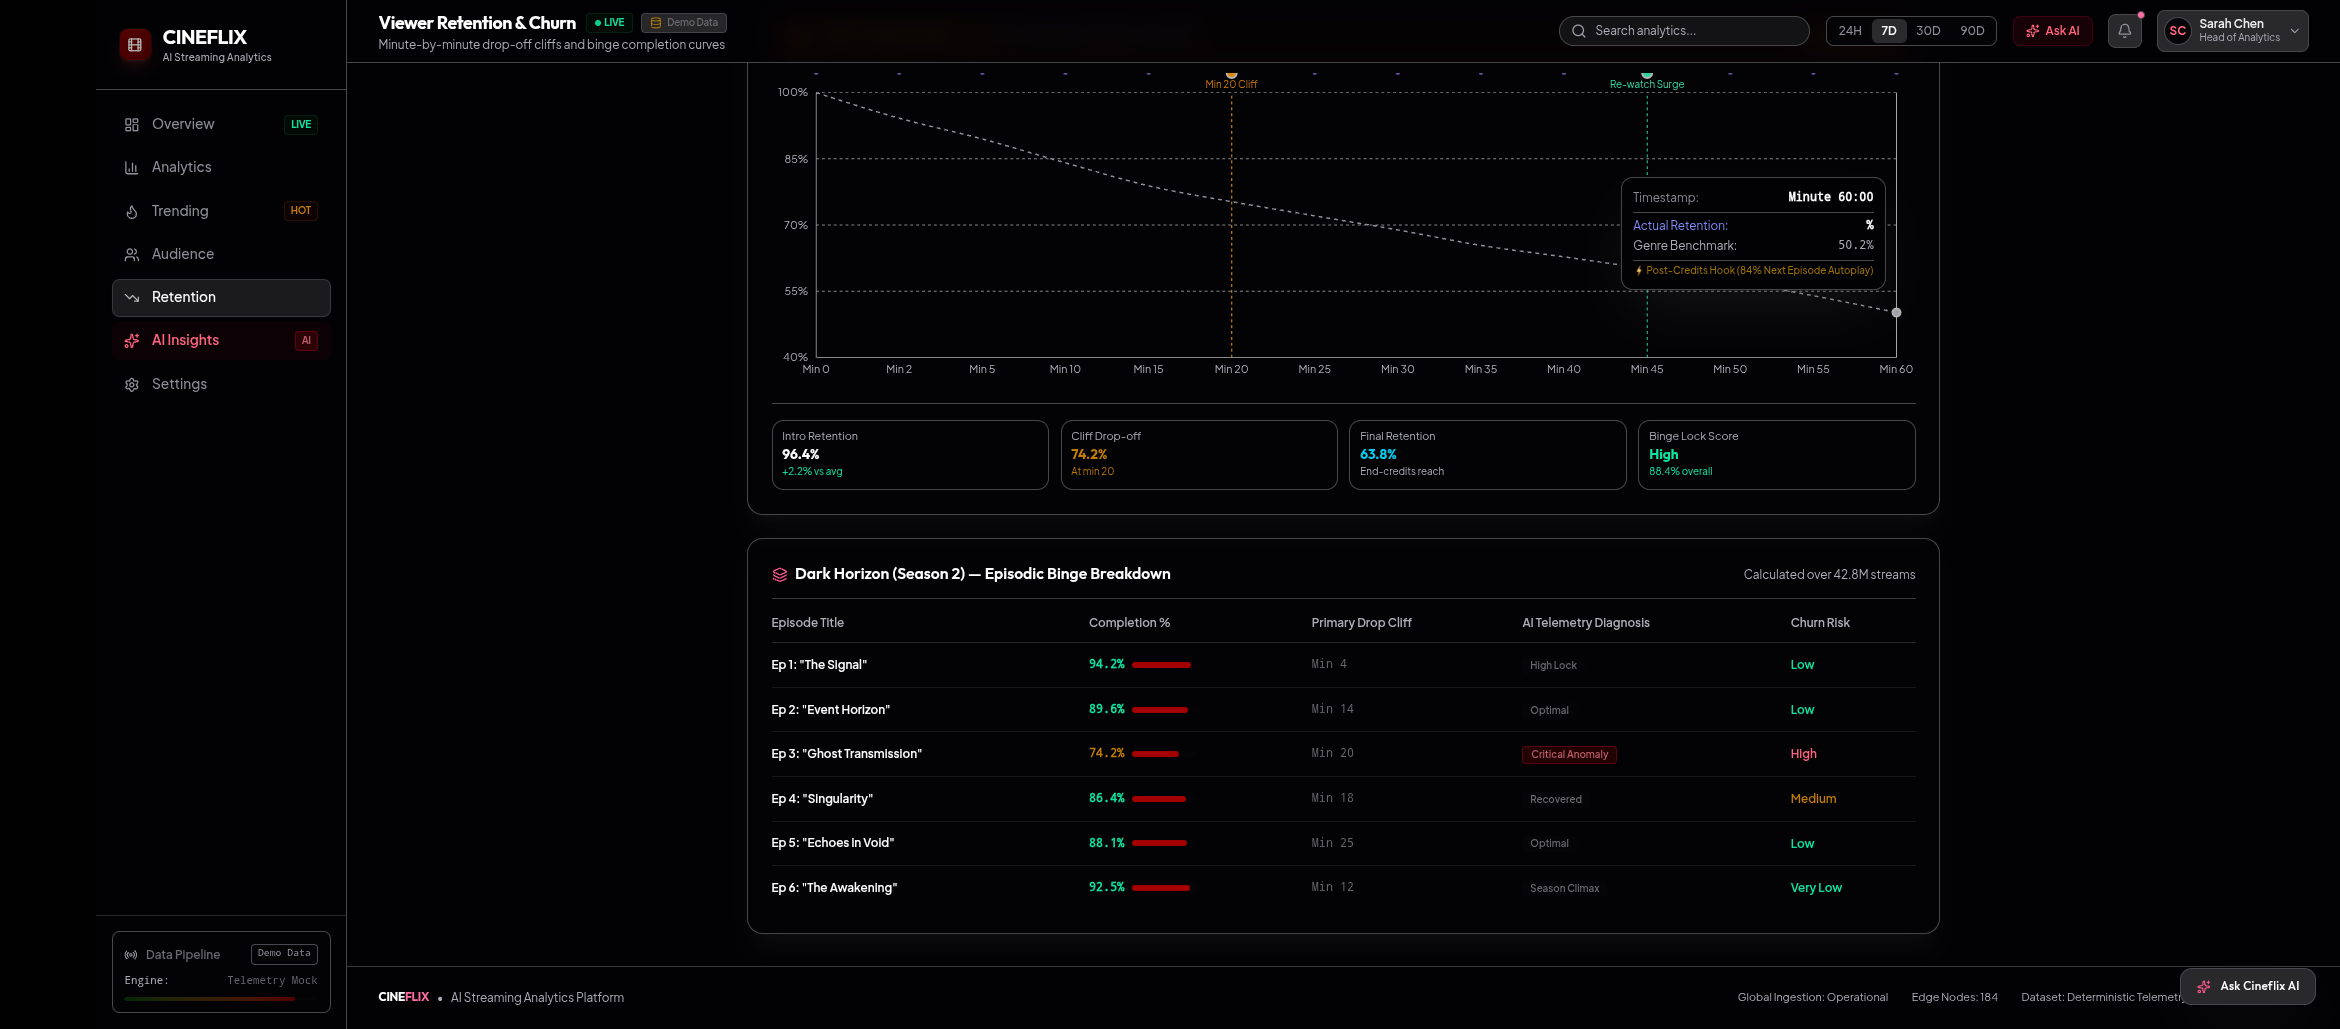
- Why are viewers dropping off from a particular episode?
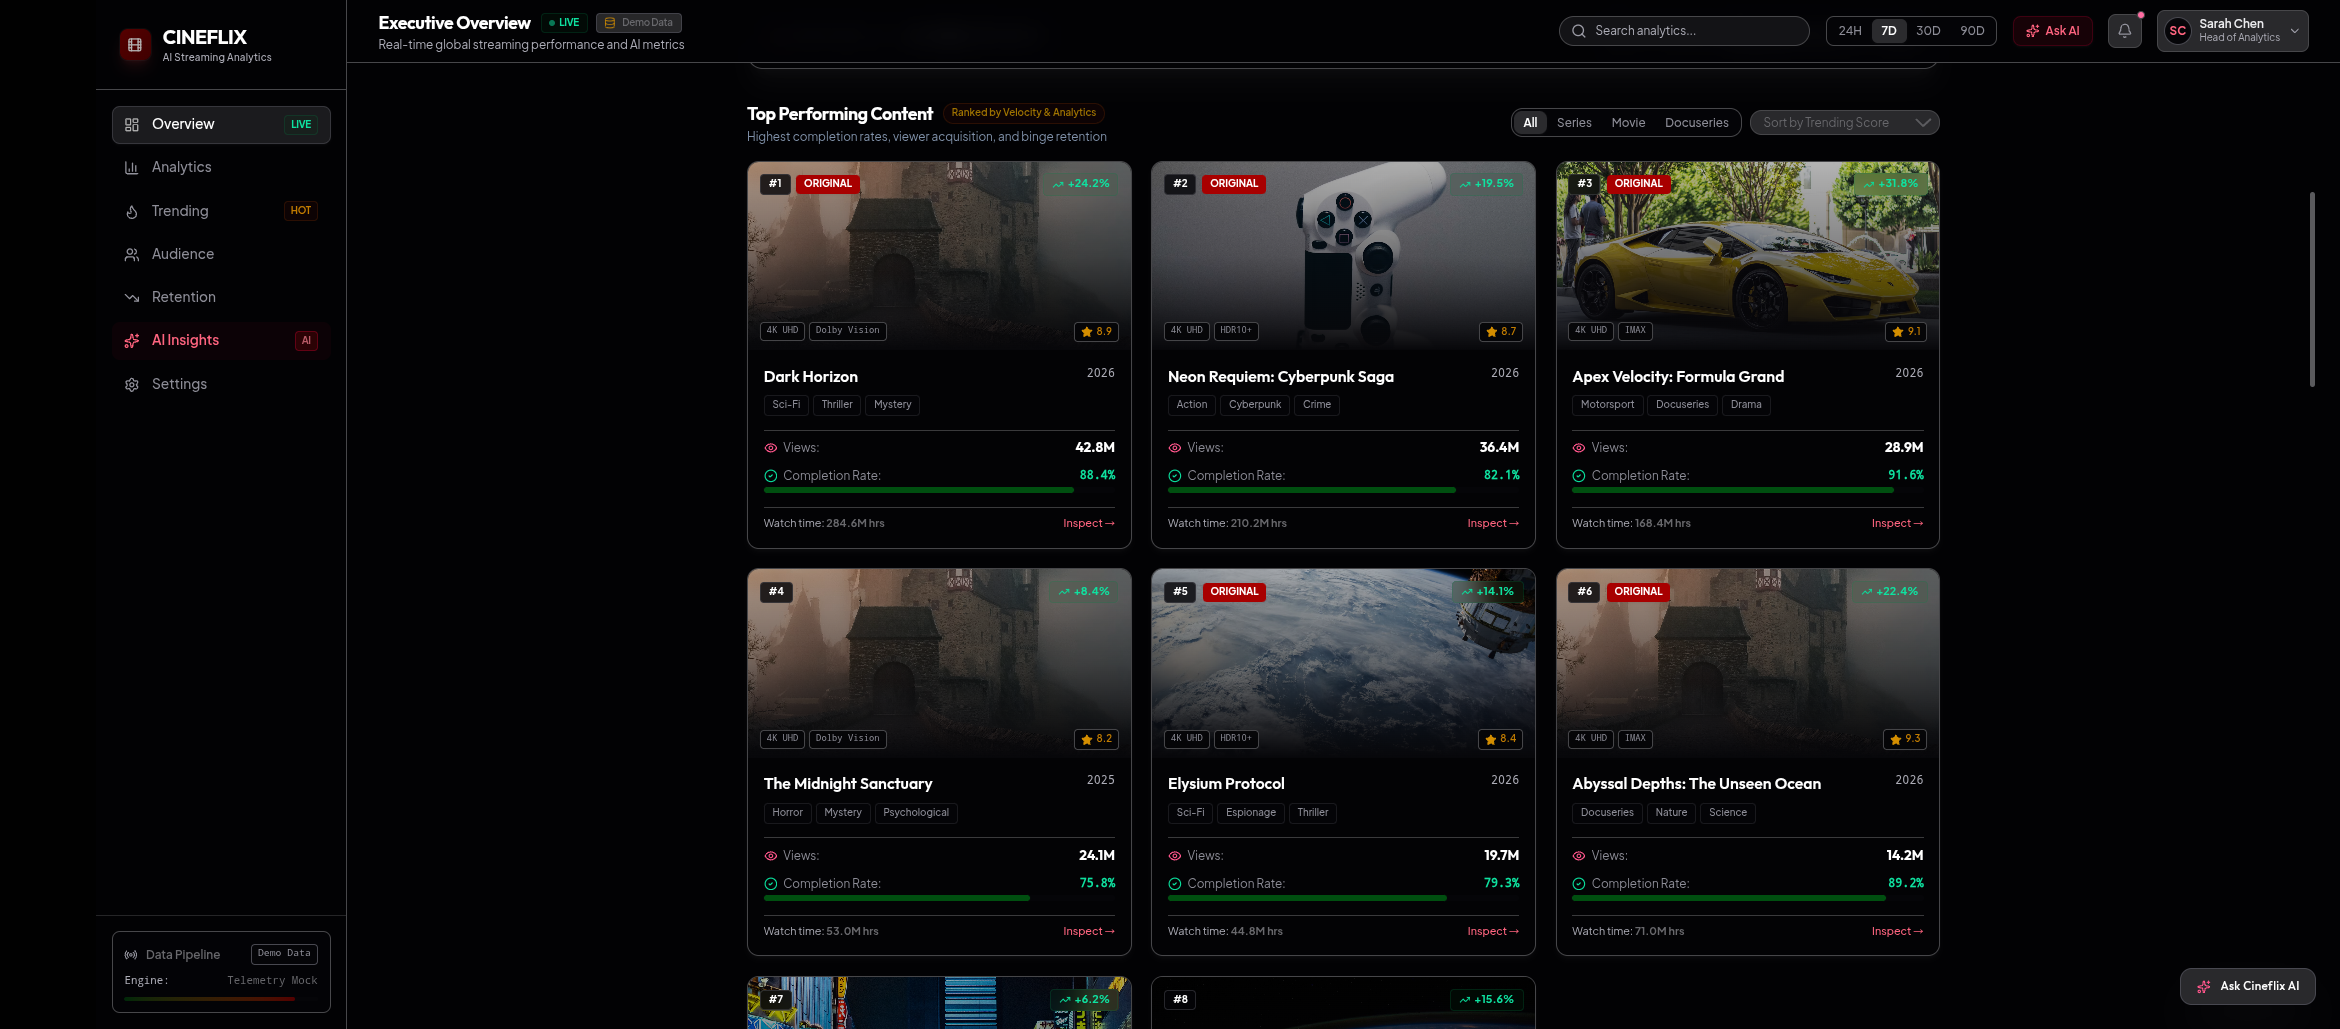
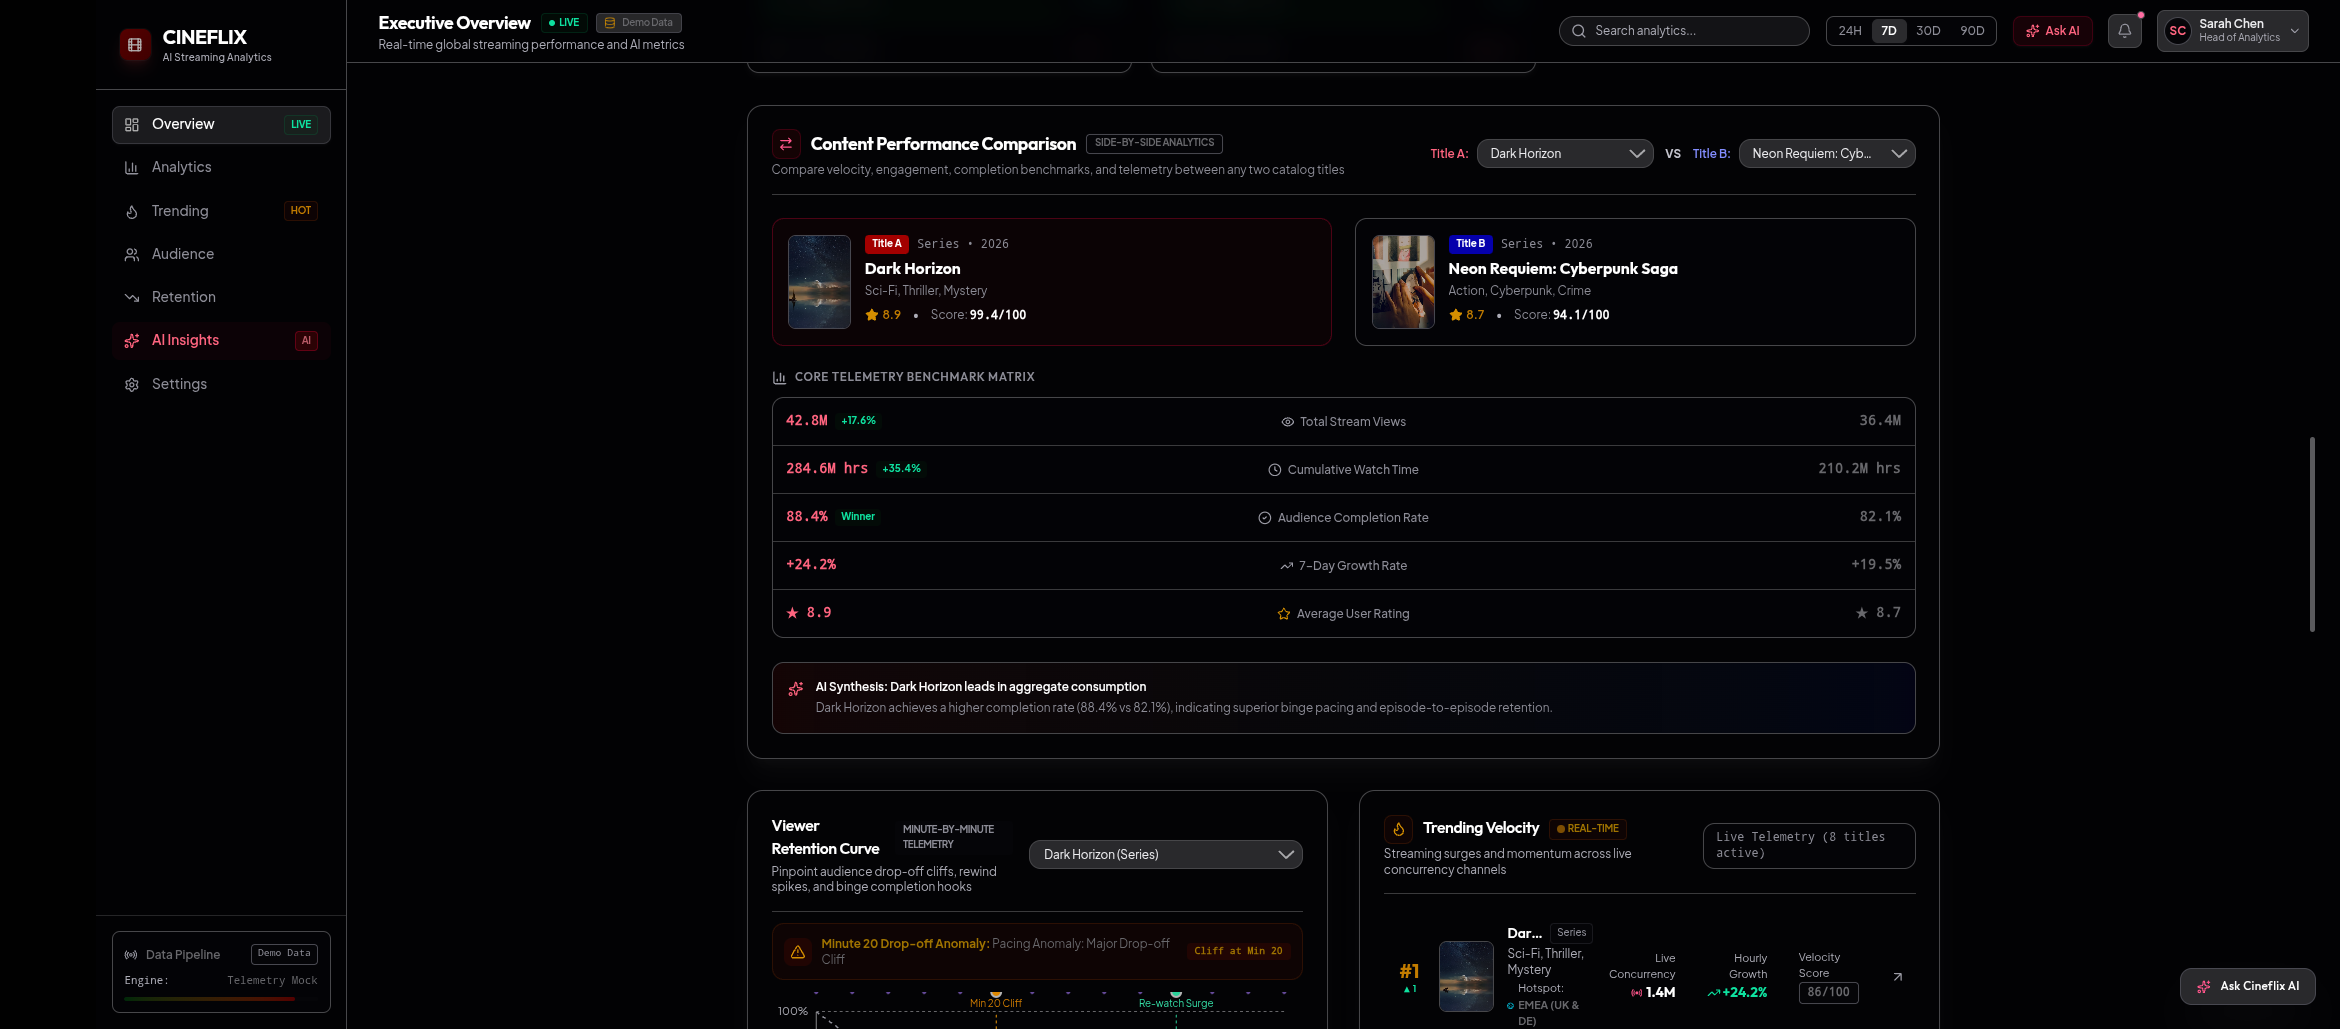
- Which content is performing better?
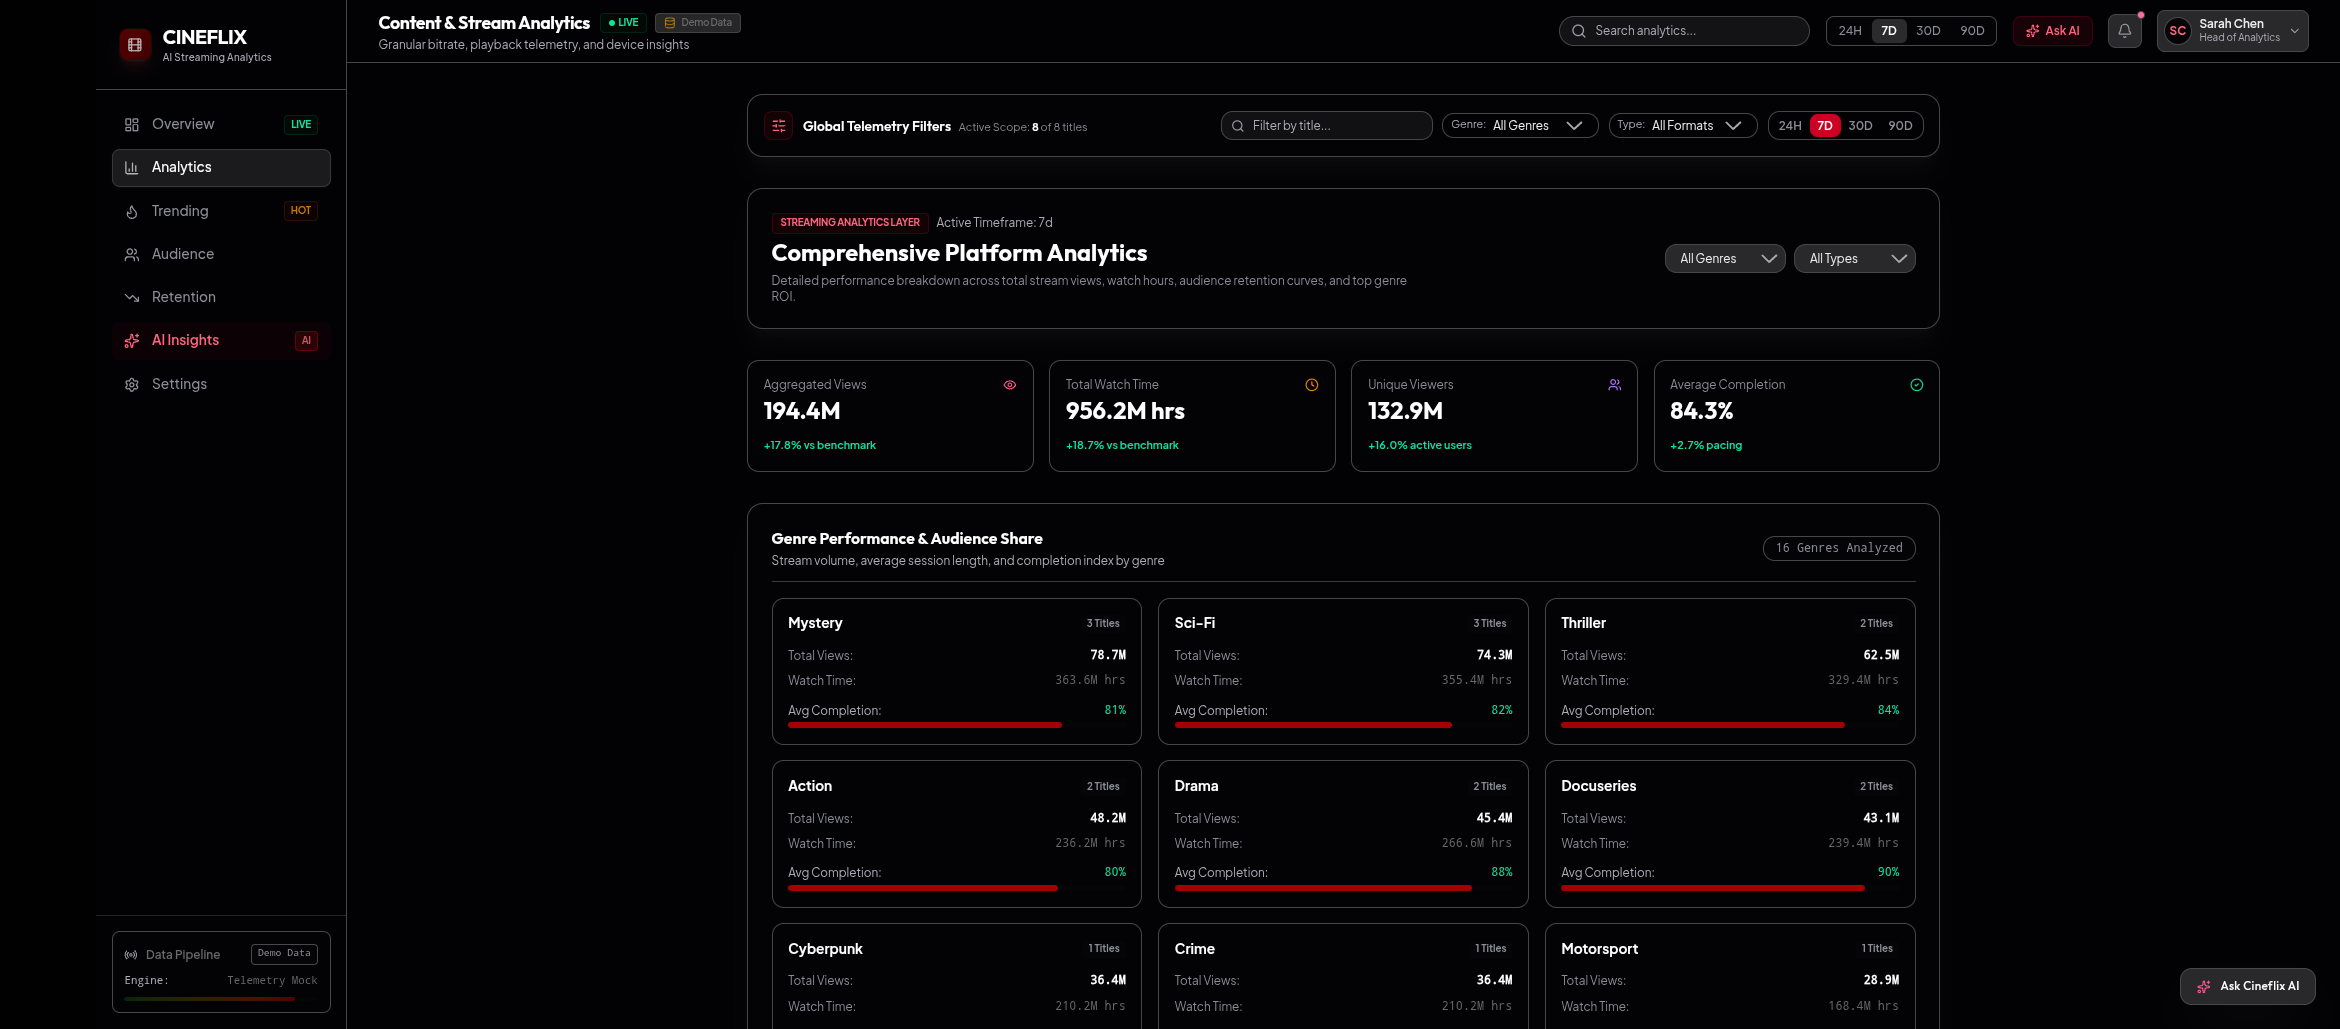
- Which genre should receive more investment?
- What content should be promoted this week?
What We Built
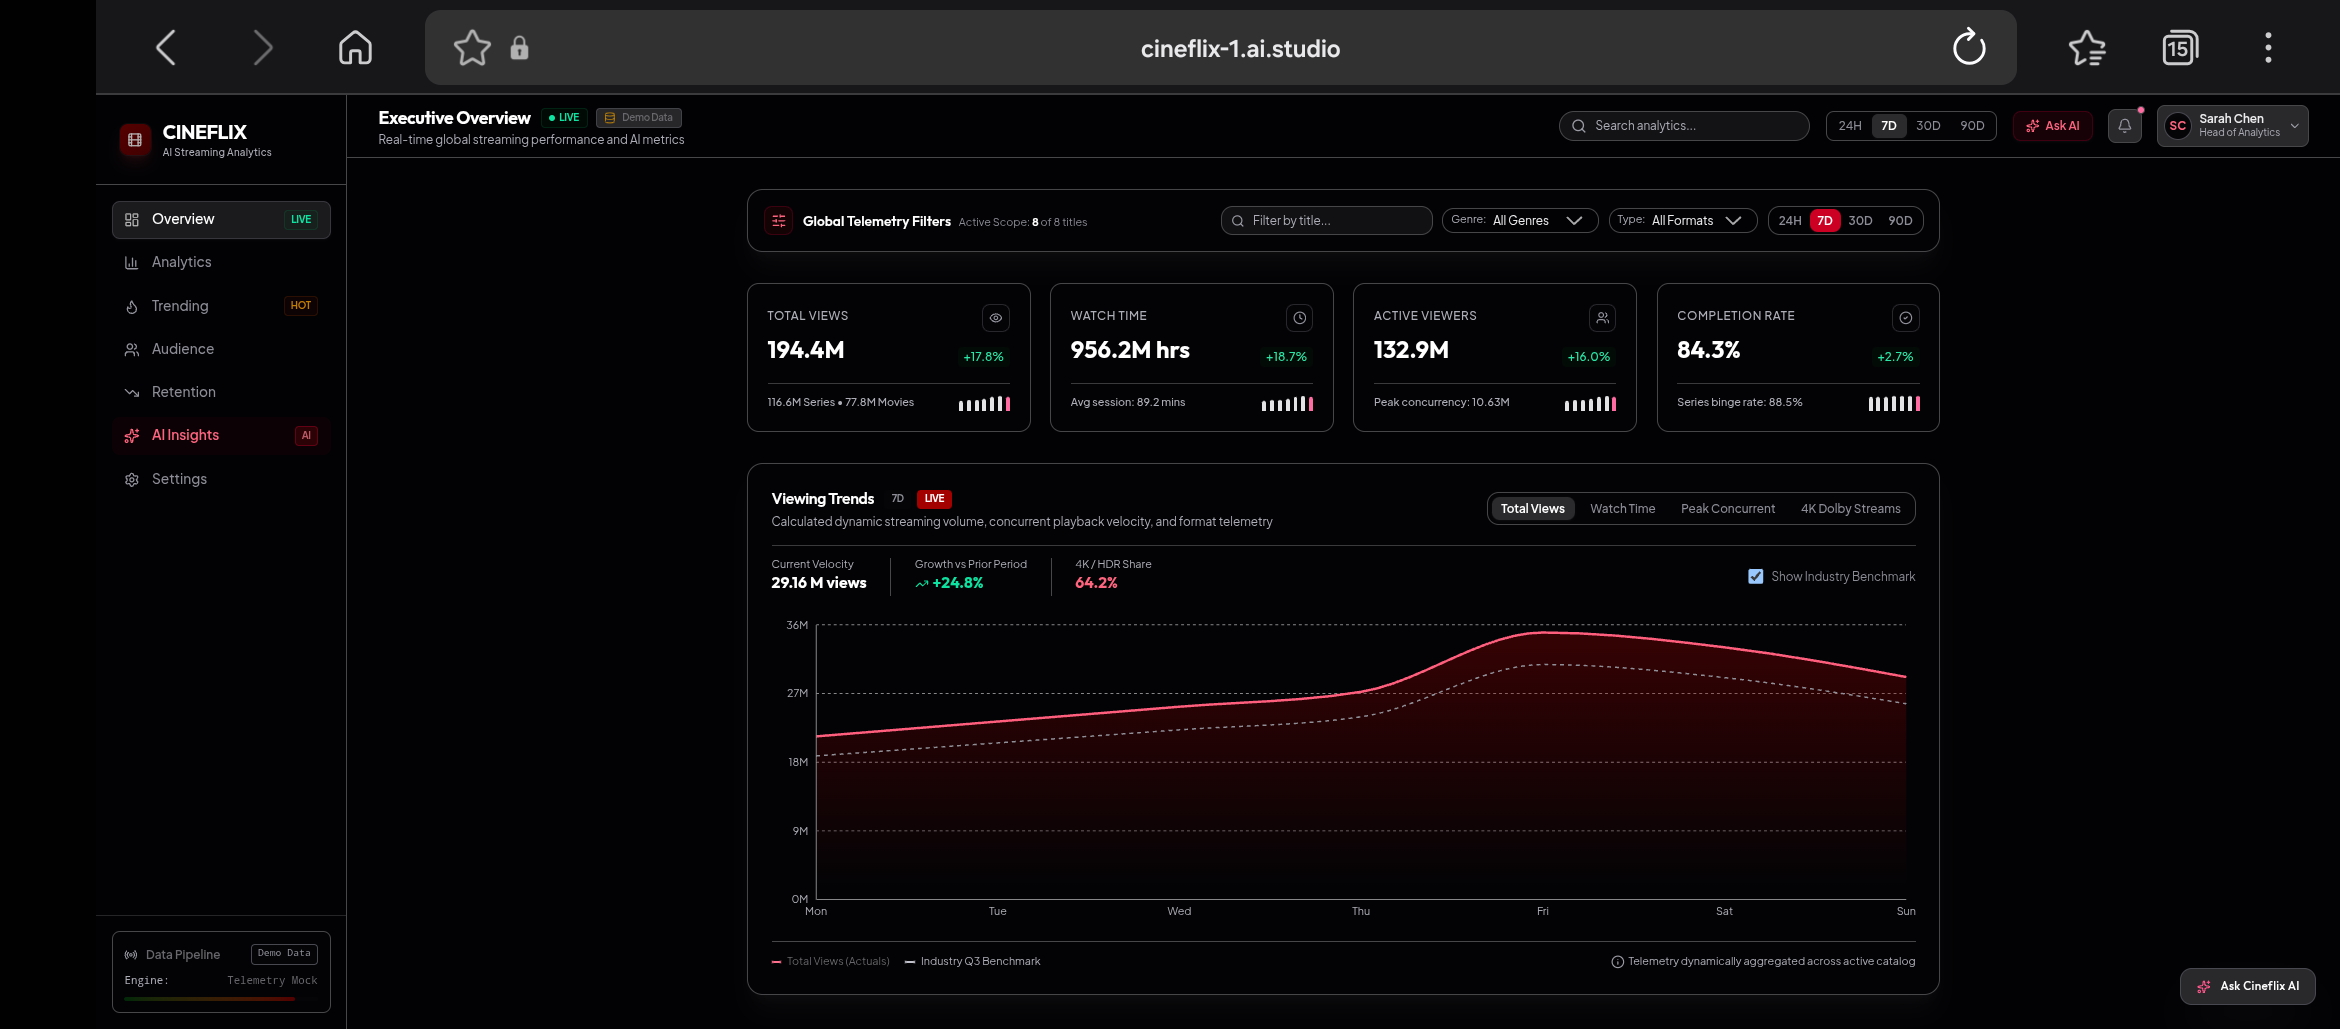
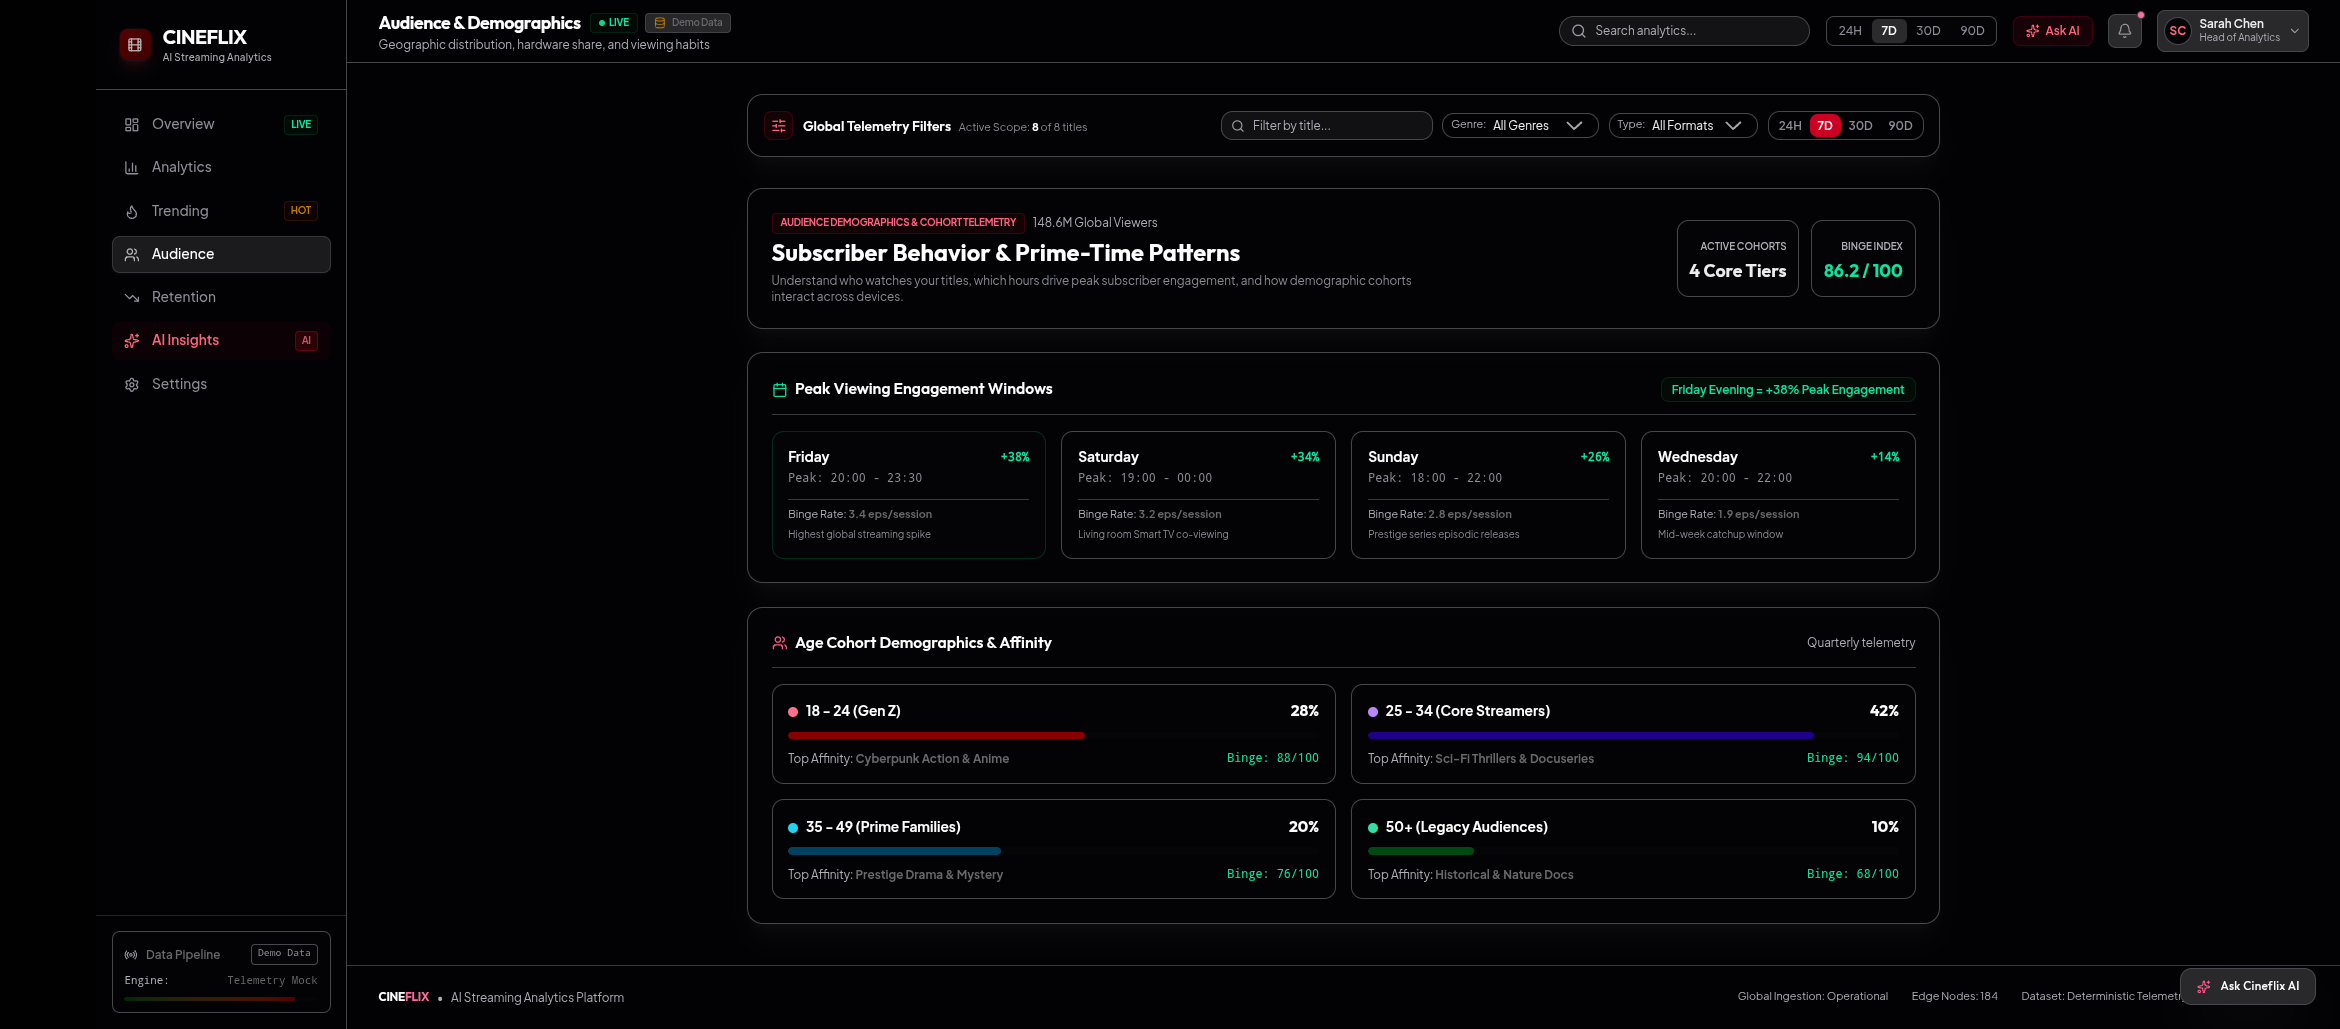
Cineflix combines an interactive streaming analytics dashboard with an AI-powered analytics assistant.
The platform provides:
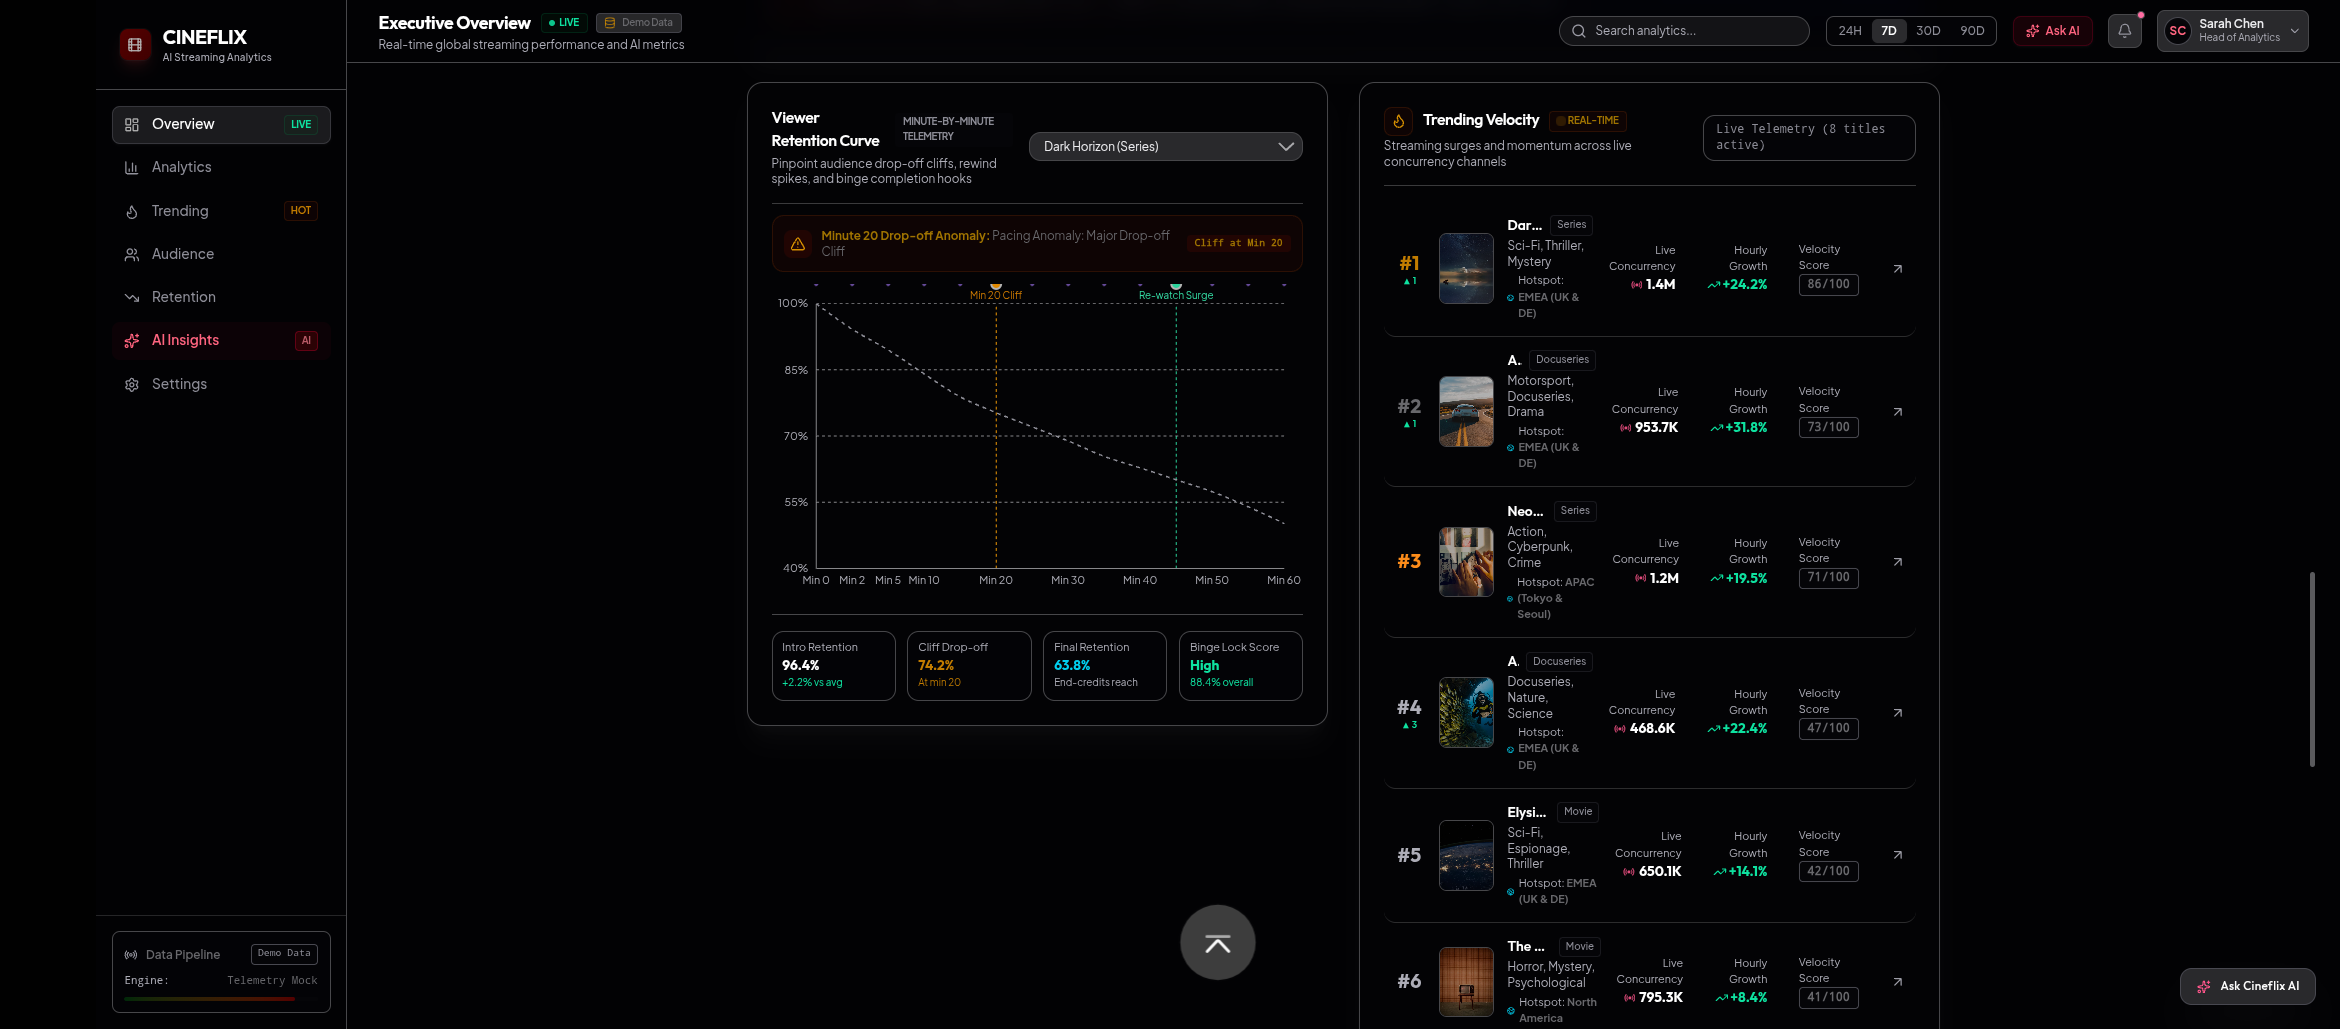
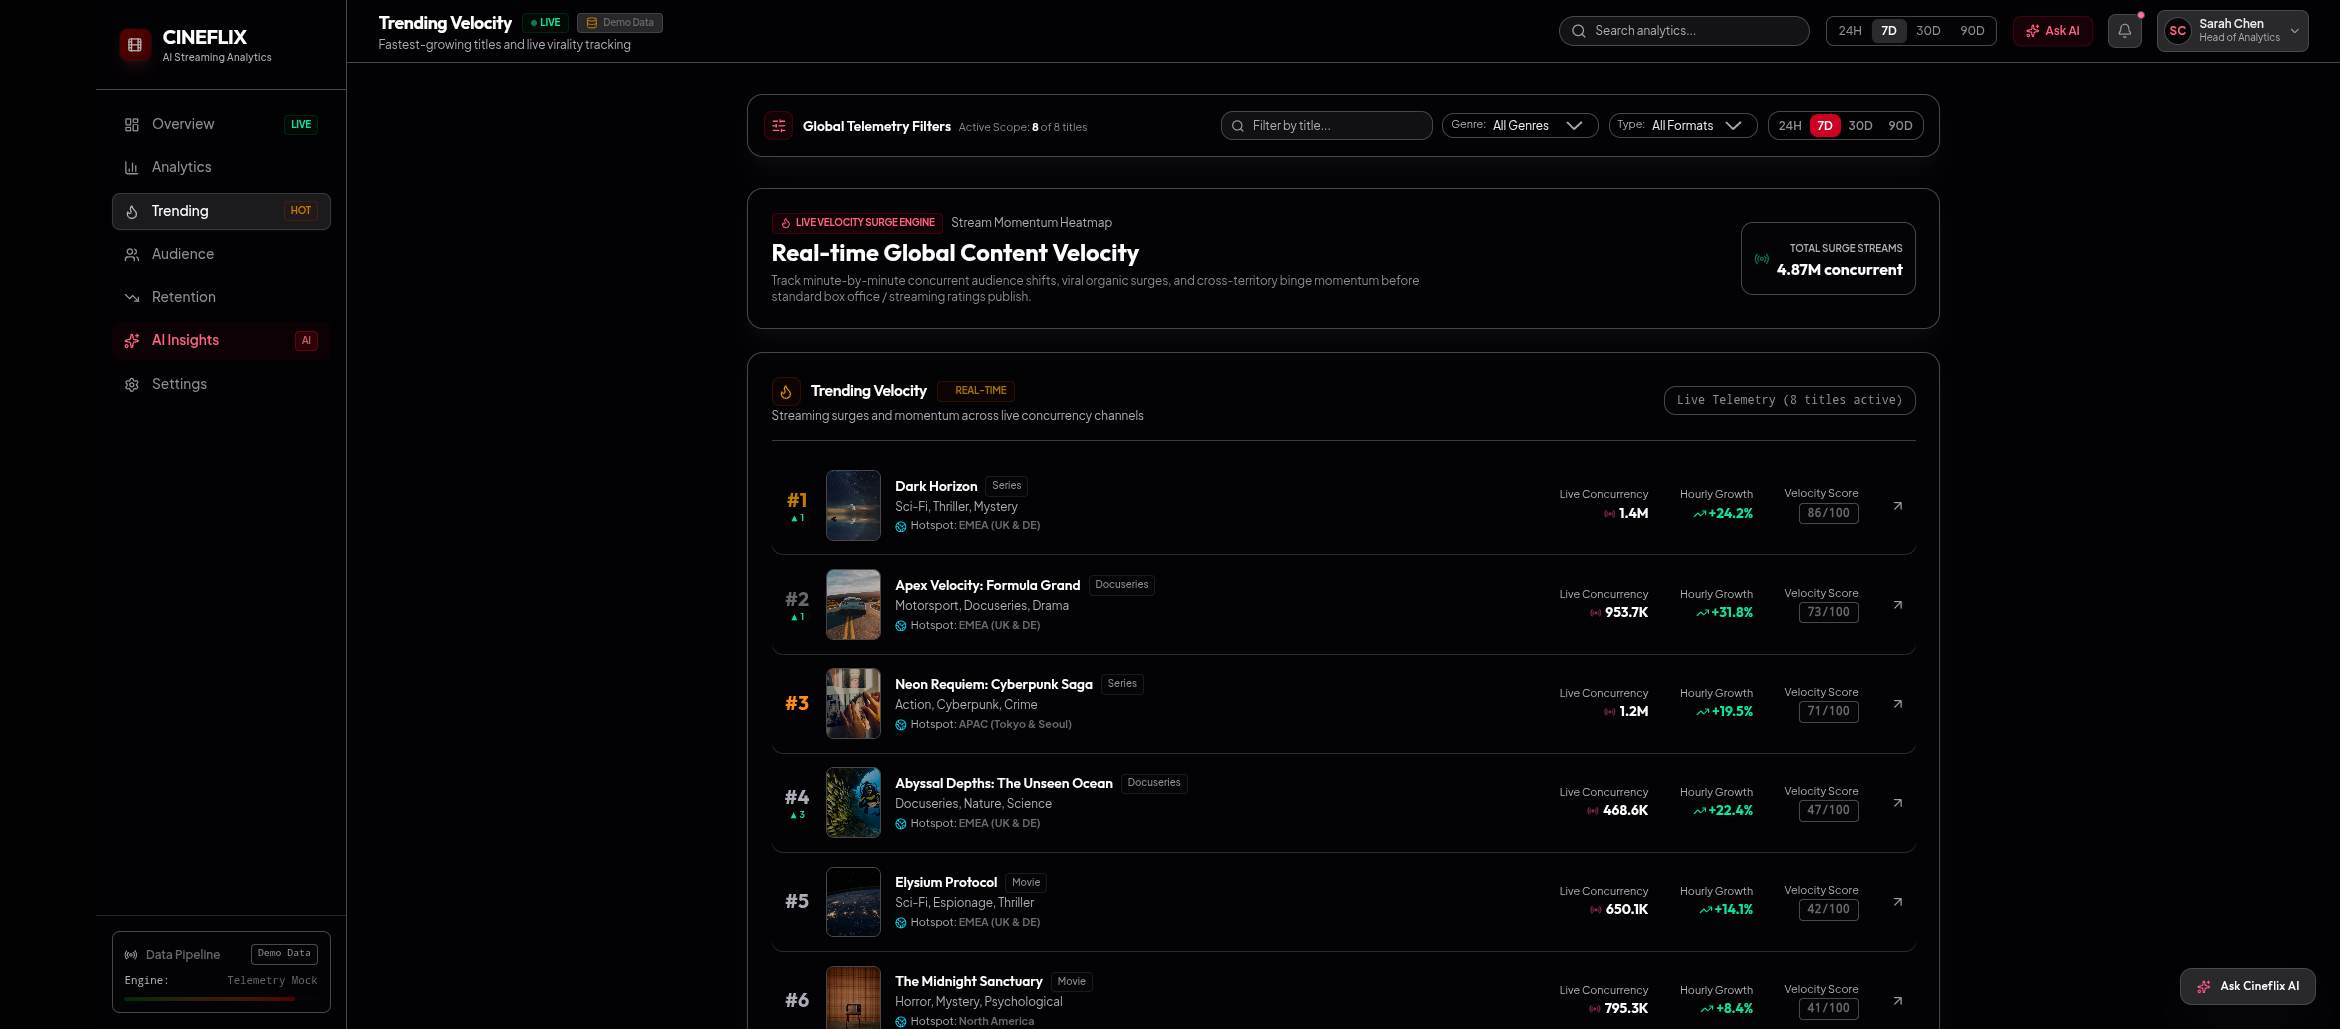
- Real-time streaming and concurrency analytics
- Viewership and growth trends
- Trending content detection
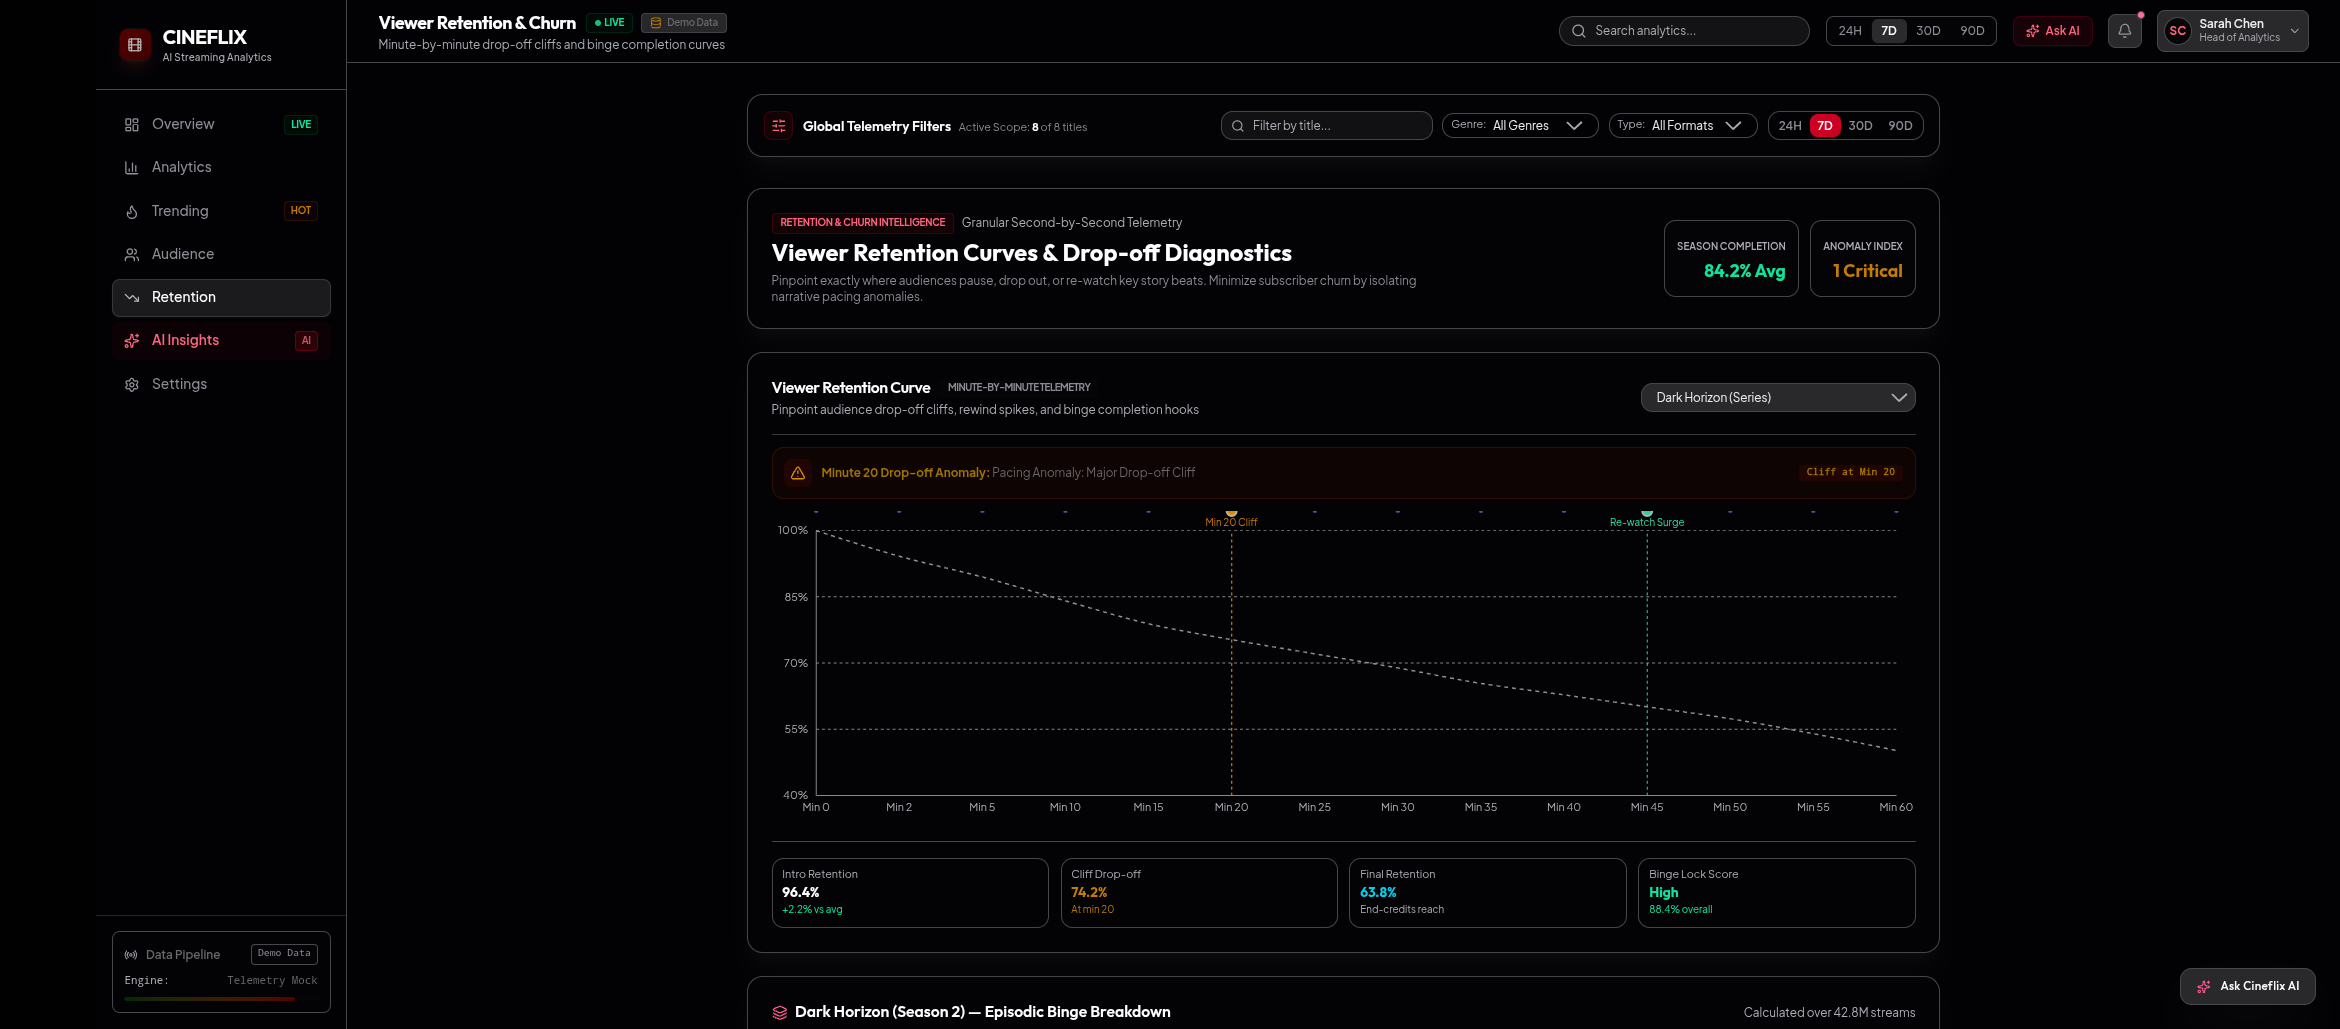
- Viewer retention and churn analysis
- Content-to-content comparisons
- Genre performance analytics
- Interactive filters and time ranges
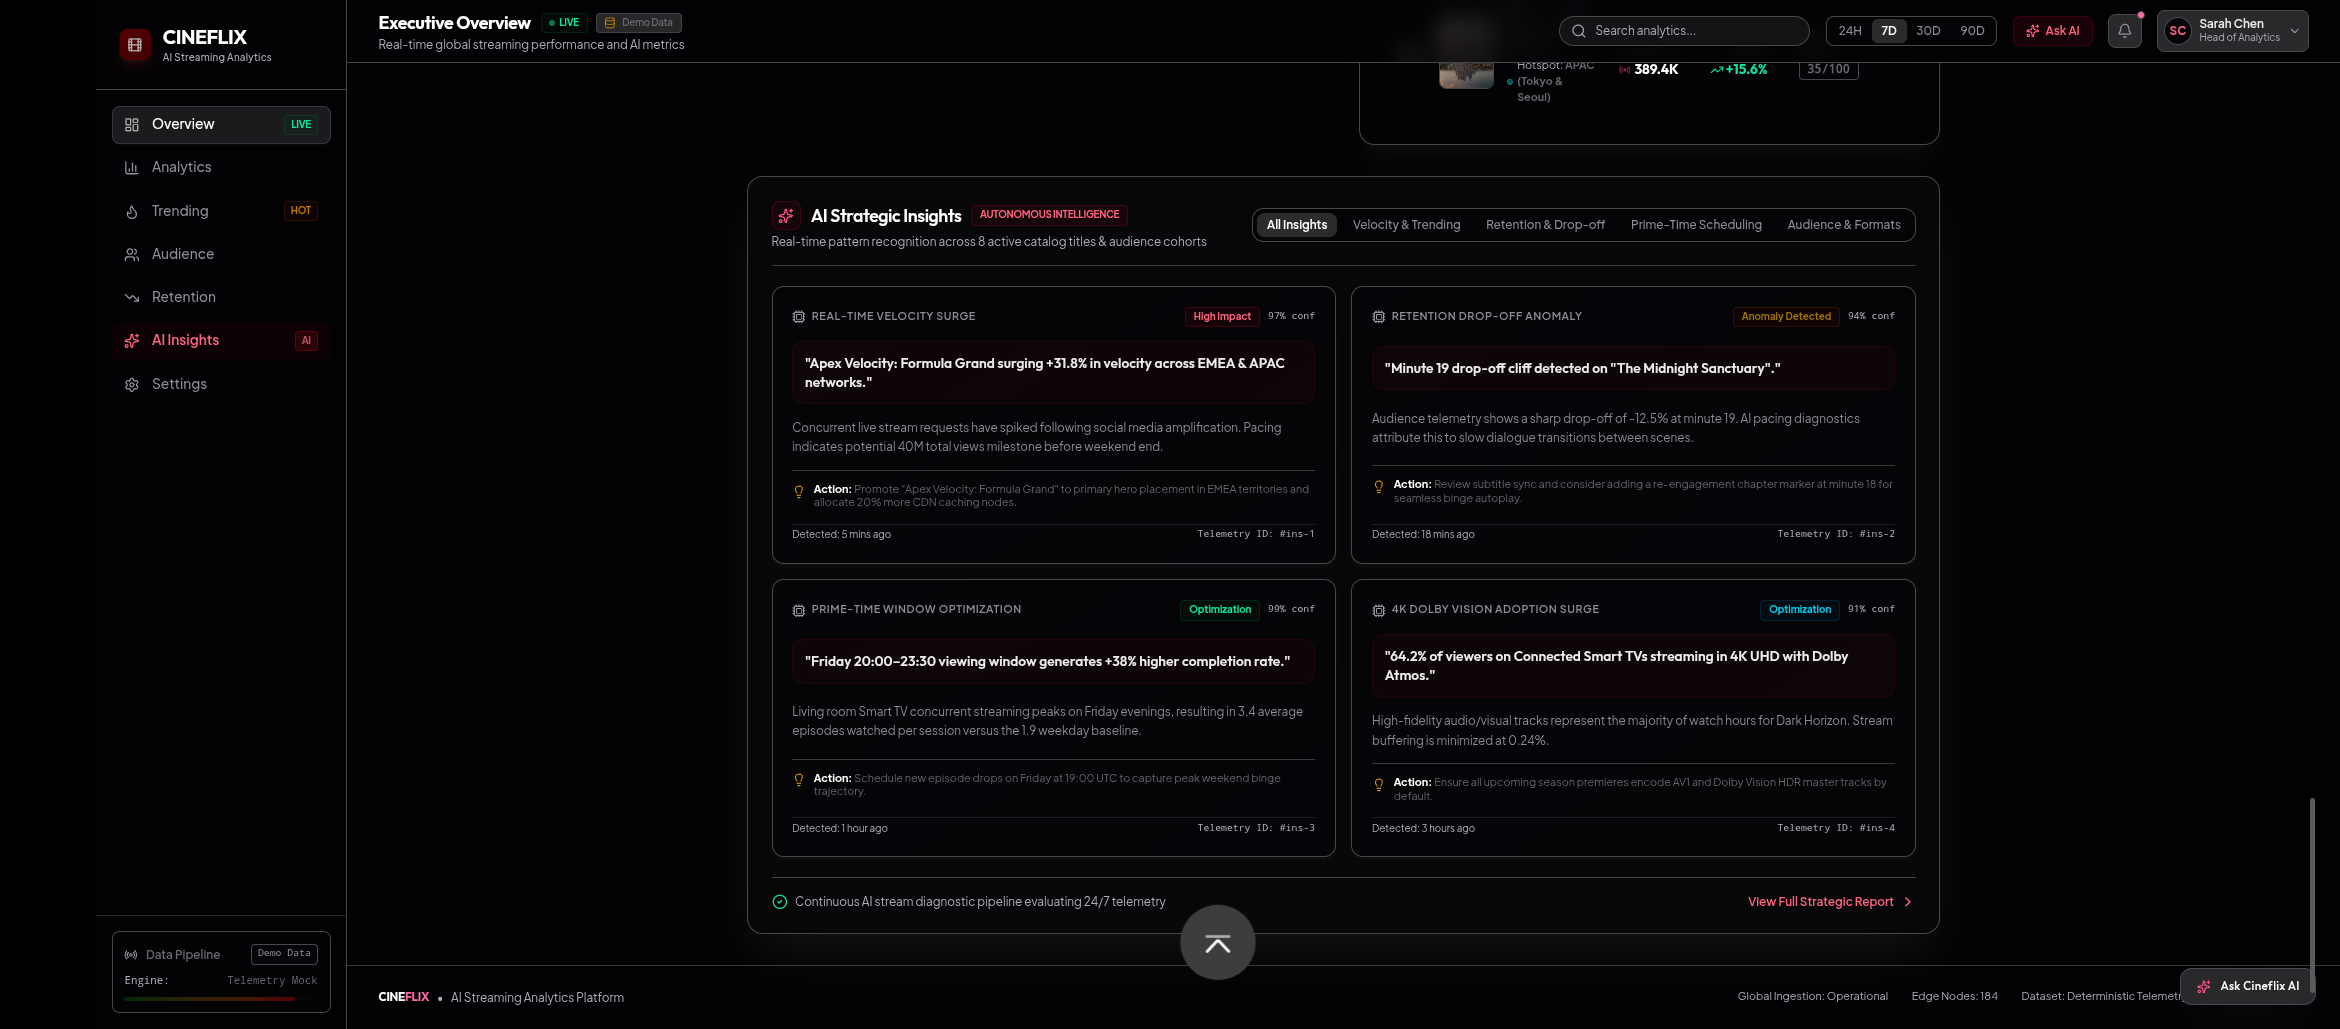
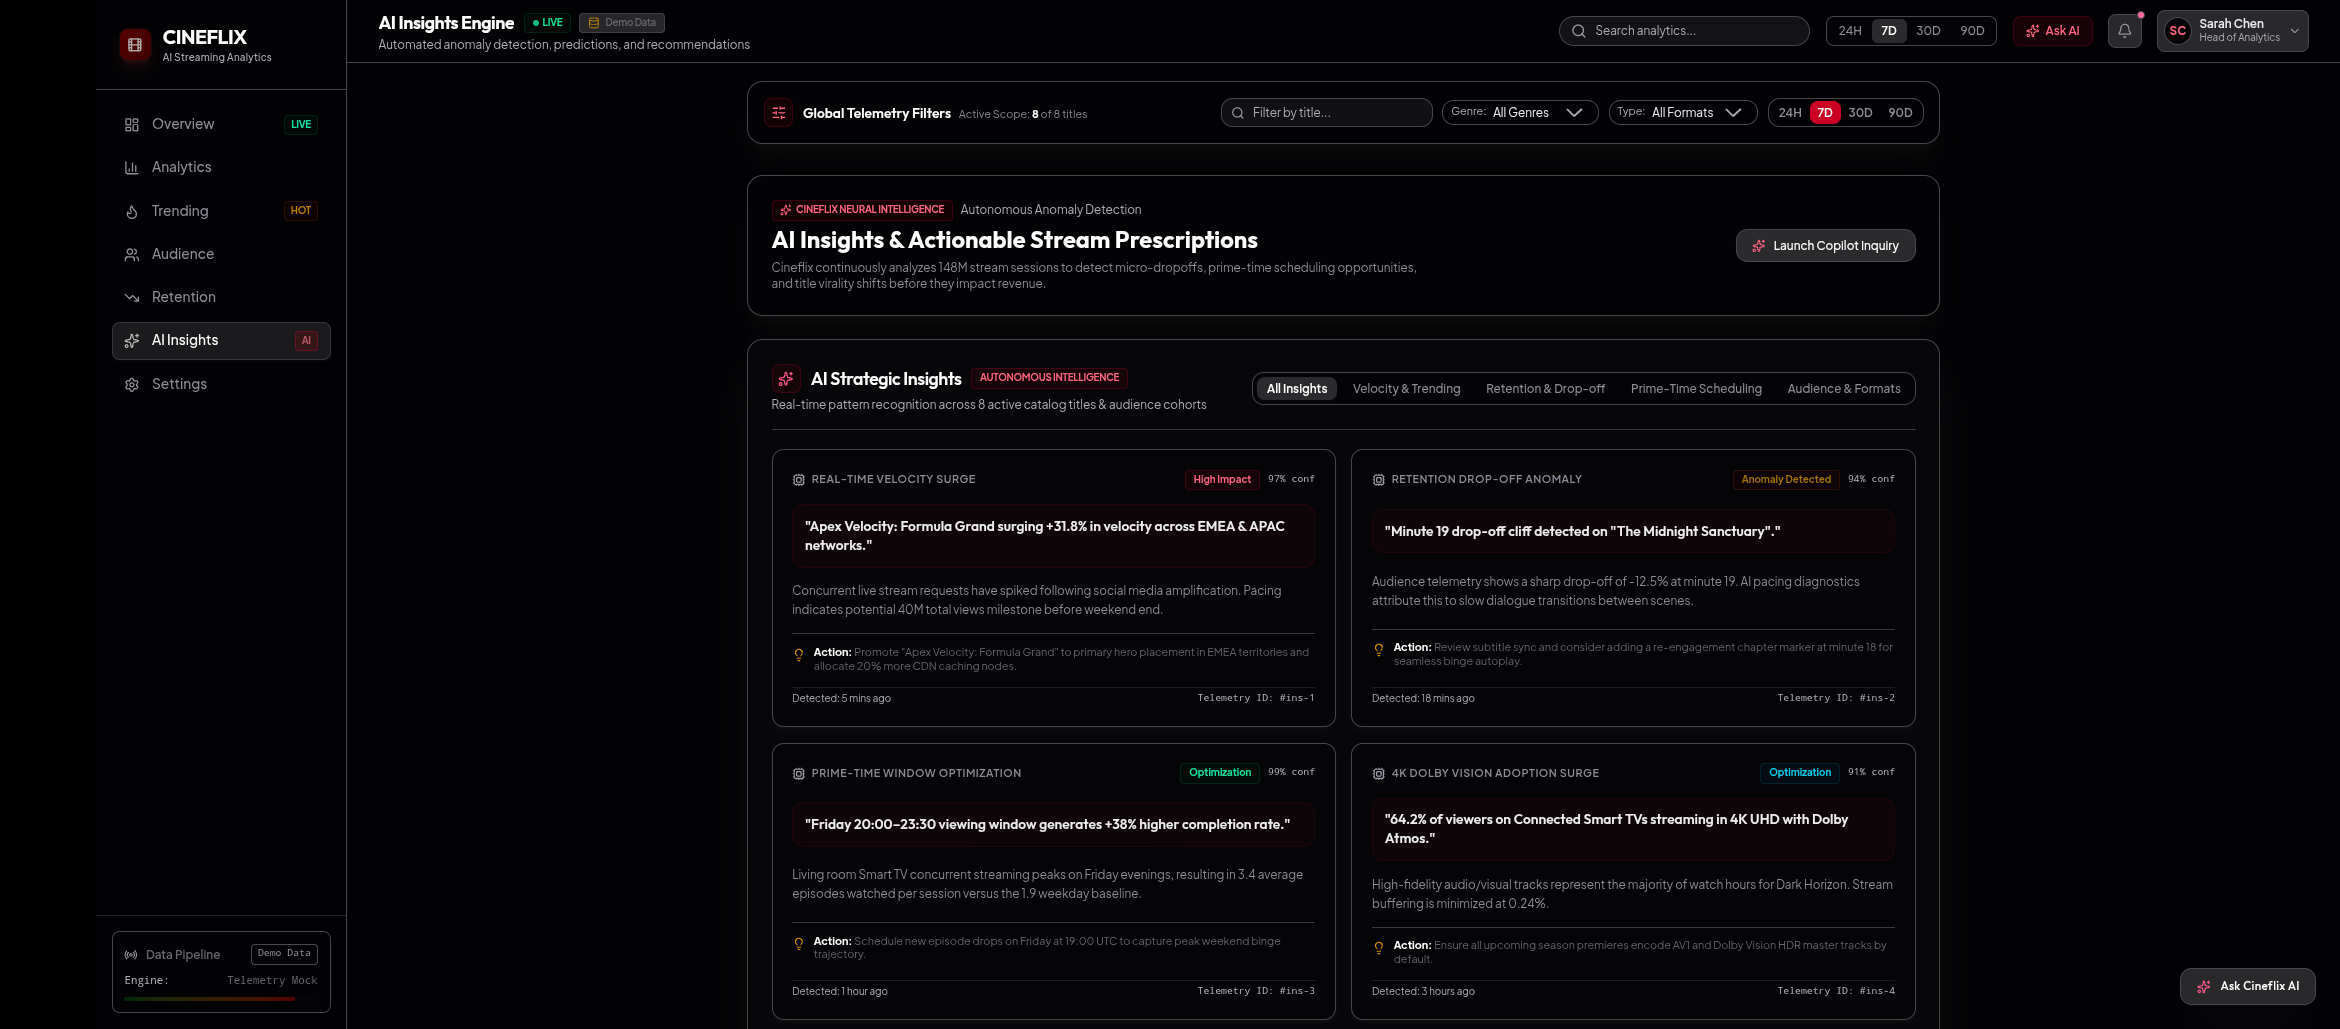
- AI-powered recommendations
- Natural-language analytics through Ask AI
- Agent execution traces showing how an AI request is analyzed
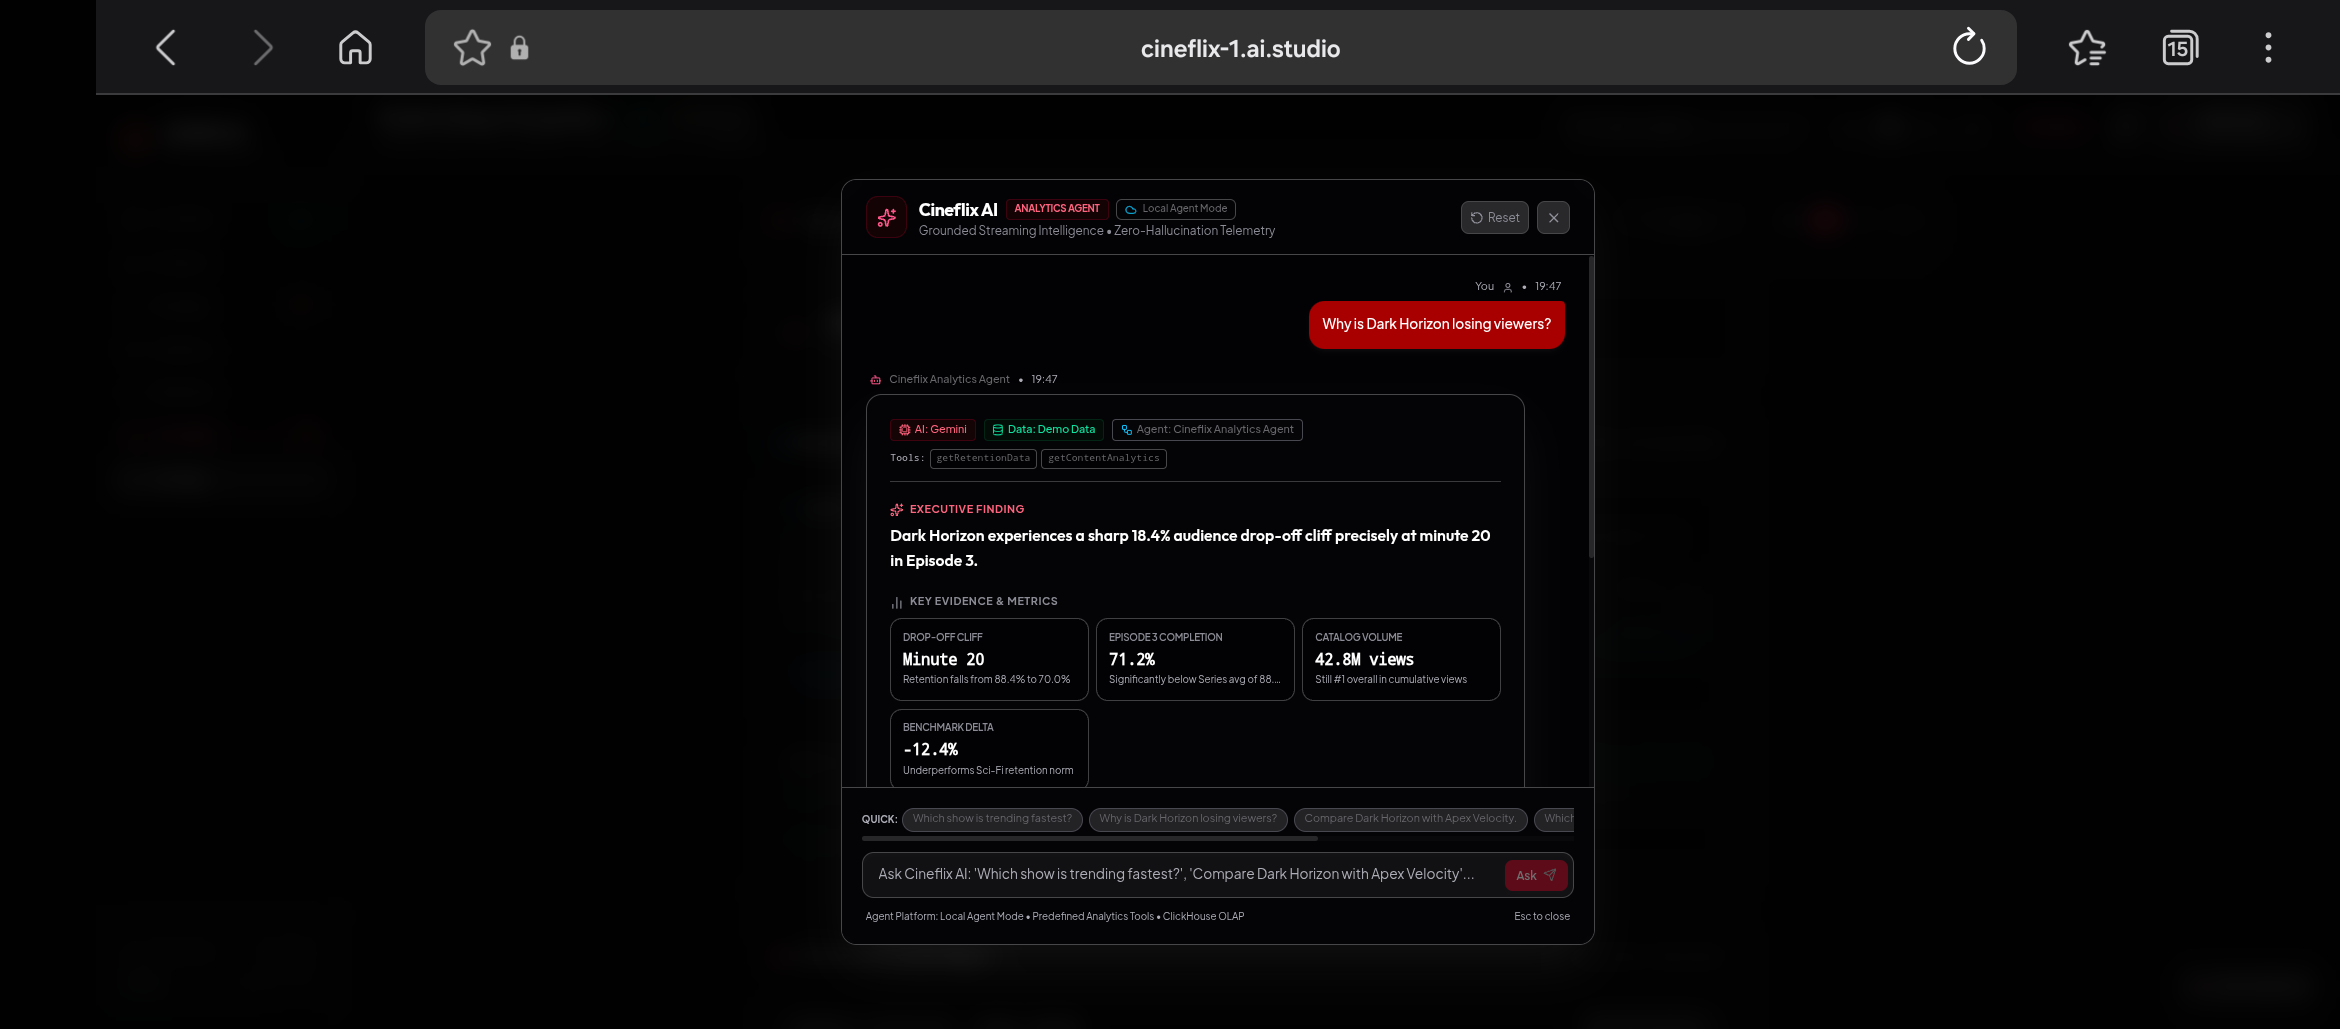
The Ask AI experience goes beyond generating generic responses. It uses the available analytics data to provide an executive finding, supporting metrics, viewer behavior analysis, and an actionable recommendation.
How We Built It
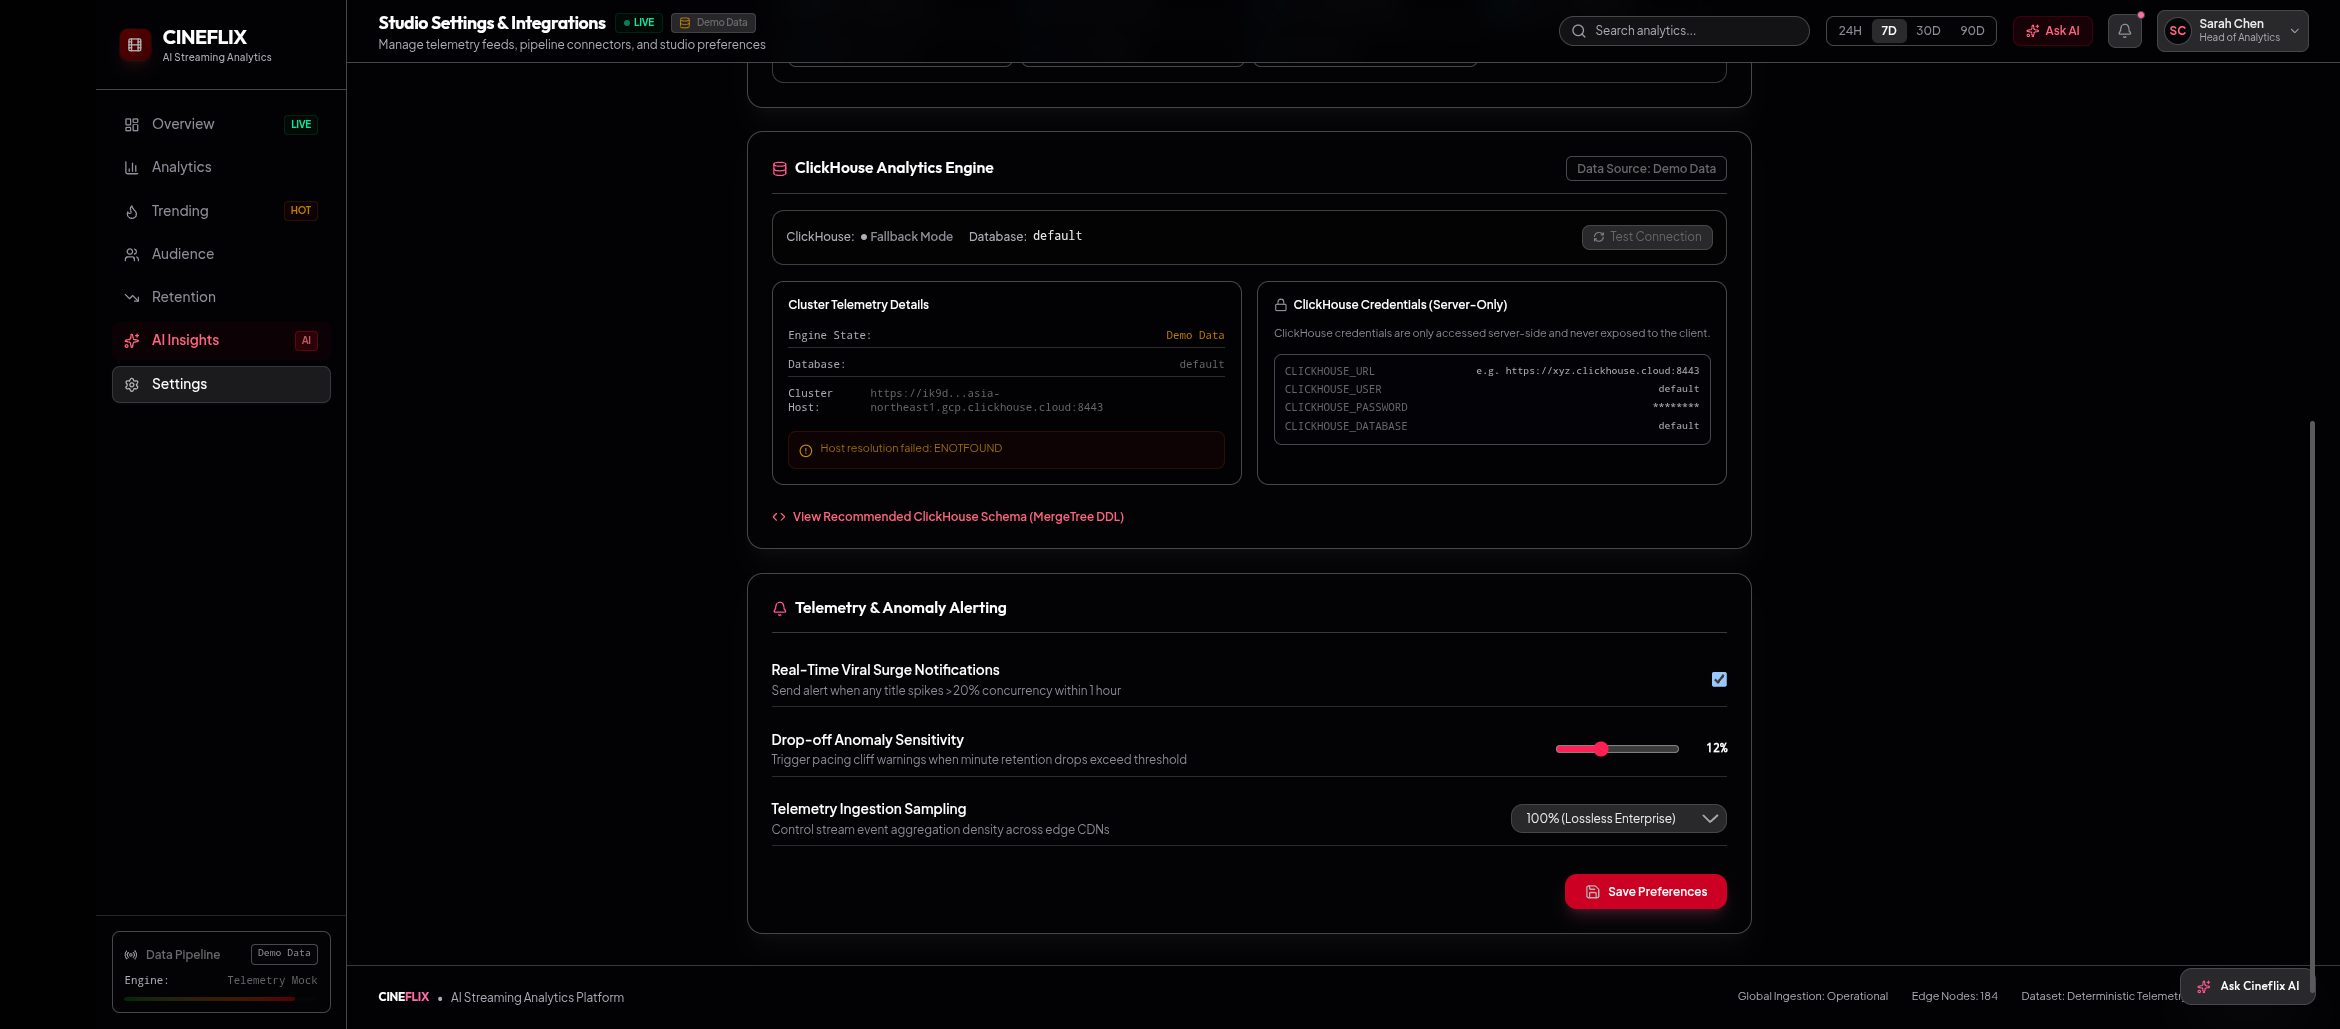
We built Cineflix as a full-stack analytics application with a modern interactive frontend, server-side API routes, ClickHouse-powered analytics, and a Gemini-powered AI reasoning layer.
The general flow is:
Streaming Analytics → ClickHouse → Backend APIs → Gemini AI Agent → Actionable Insight
For example, a user can ask:
«"Why is Dark Horizon losing viewers?"»
Cineflix can analyze the retention data, identify the relevant drop-off point, explain the viewer behavior, and provide a recommendation instead of simply returning raw numbers.
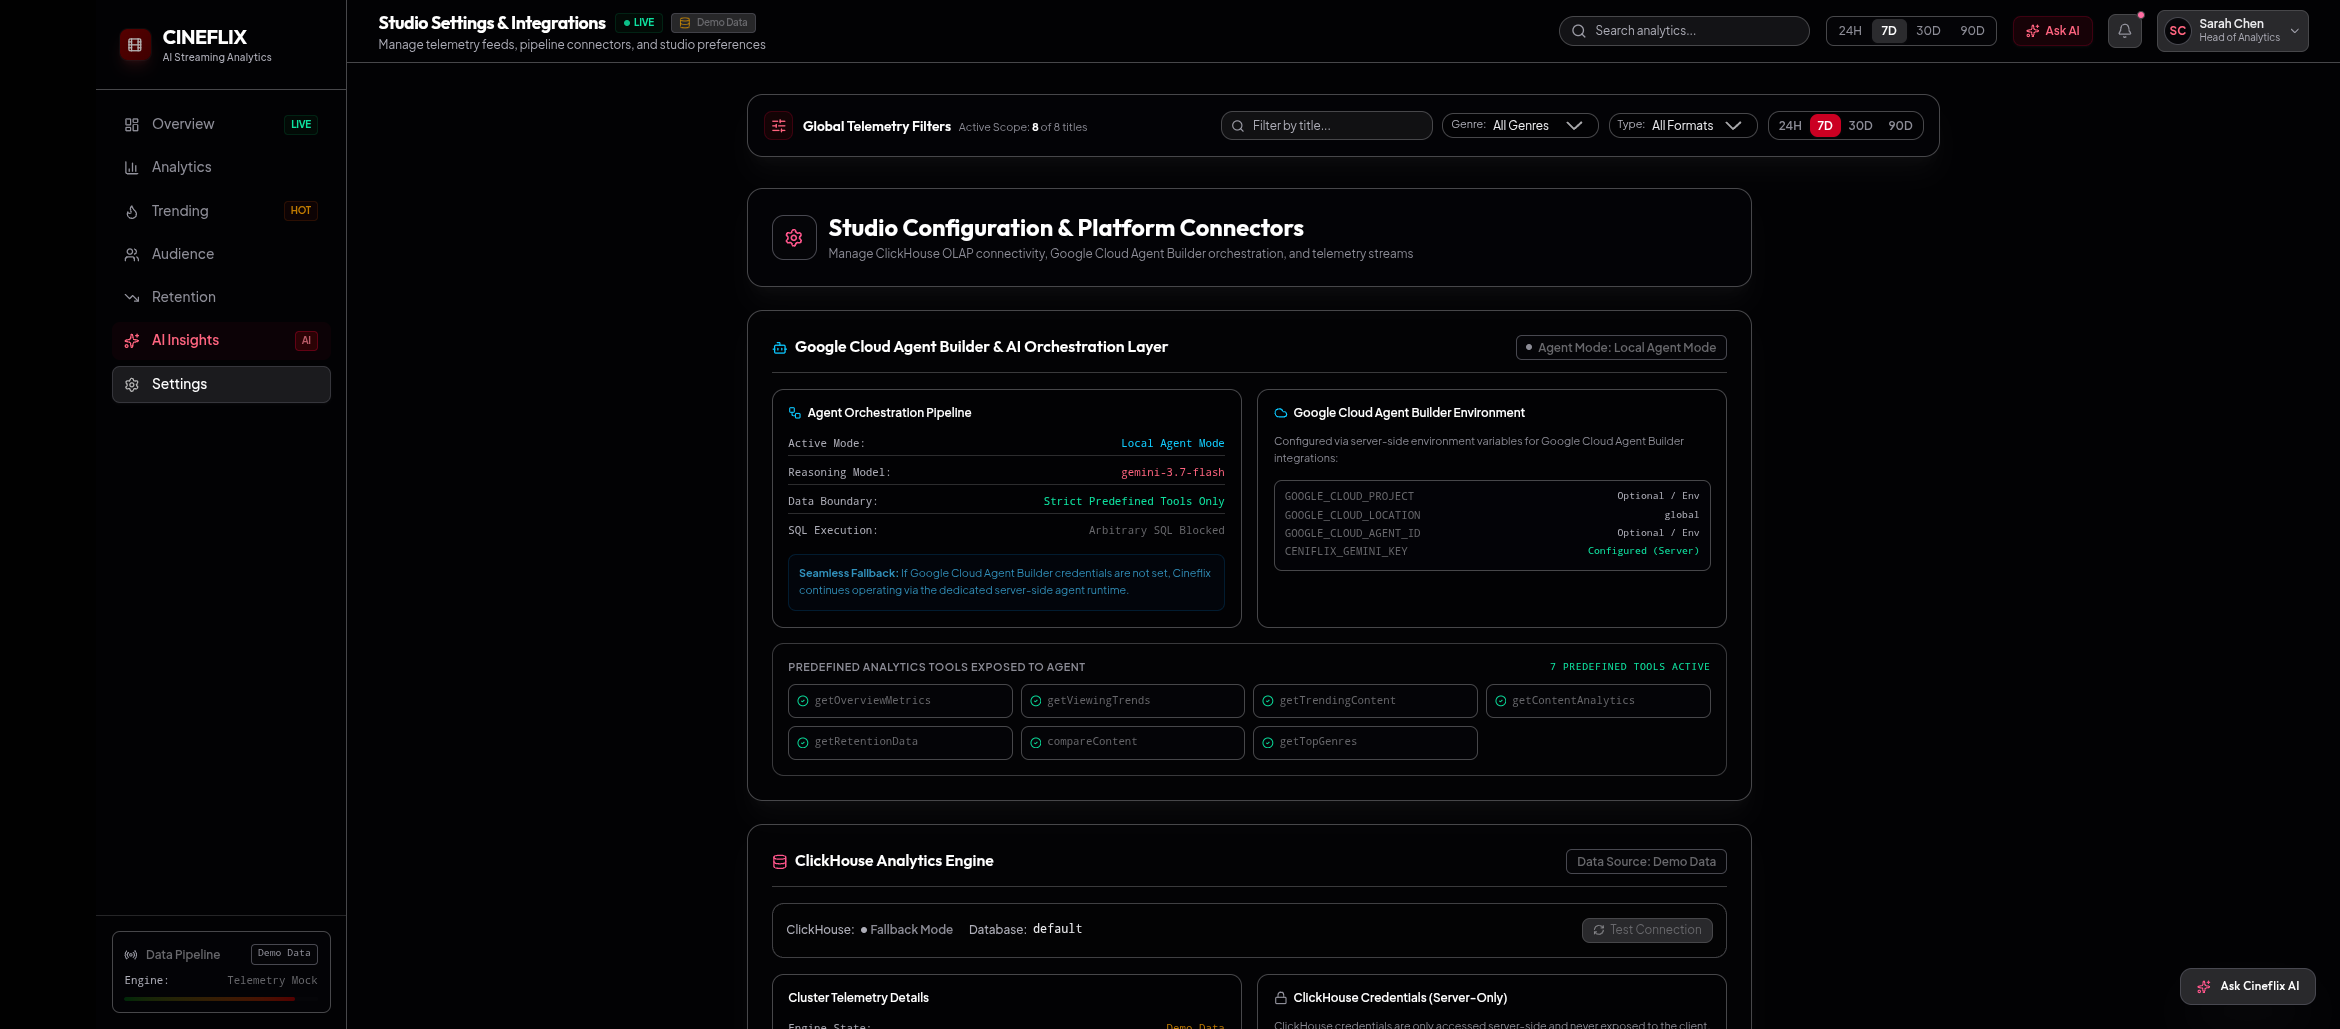
Security was also an important part of the implementation. The Gemini credential is stored as the server-side secret "CENIFLIX_GEMINI_KEY" and is never exposed to the client.
What We Learned
Building Cineflix taught us that creating an AI application is not just about connecting a model to a prompt.
We learned how important it is to:
- Ground AI responses in structured data
- Design reliable server-side API flows
- Protect API credentials and secrets
- Handle loading, timeout, and failure states
- Build analytics visualizations that communicate insights clearly
- Connect natural-language questions with structured analytical queries
- Validate AI output against actual analytics data
- Test an application systematically before deployment
One of the biggest lessons was that AI becomes much more useful when it is connected to reliable data and a clear decision-making workflow.
Challenges
One of our biggest challenges was making the AI assistant provide useful, data-grounded answers instead of generic responses.
We had to carefully connect the AI agent with the analytics layer and ensure that questions about trends, retention, comparisons, and content performance were answered using the relevant data.
We also faced challenges around:
- Maintaining consistency between dashboard numbers and AI responses
- Handling restrictive filters and empty states
- Building reliable content-specific intent detection
- Keeping API credentials completely server-side
- Designing graceful fallback behavior for API failures
- Ensuring the dashboard remained responsive while handling analytical requests
Through testing and iteration, we identified and fixed issues in content selectors, comparison states, and title-specific AI routing.
Final Outcome
Cineflix evolved from an idea into a working AI-powered streaming analytics platform that connects data, visualization, natural-language interaction, and actionable recommendations in one experience.
Our goal was not to build another dashboard that simply displays numbers. We wanted to build a system that helps teams understand what is happening, why it is happening, and what they should do next.
Built With
- ai-agents
- clickhouse
- data-visualization
- google-ai-studio
- google-gemini
- react
- rest-apis
- tailwind-css
- typescript

Log in or sign up for Devpost to join the conversation.