-
-
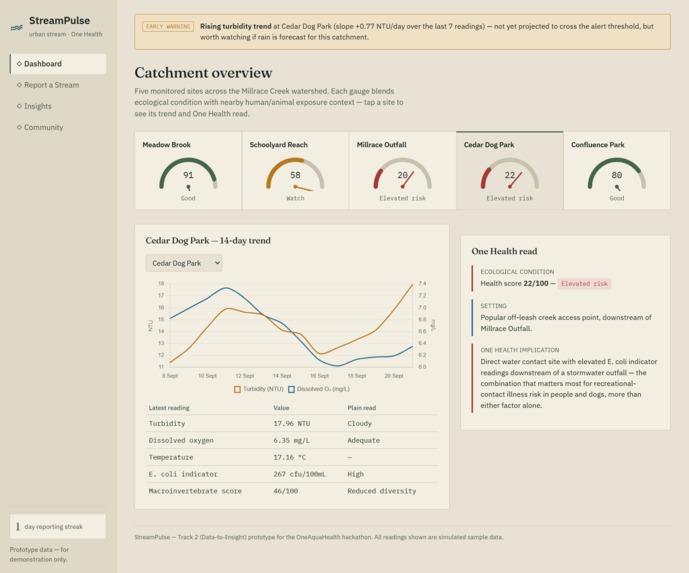
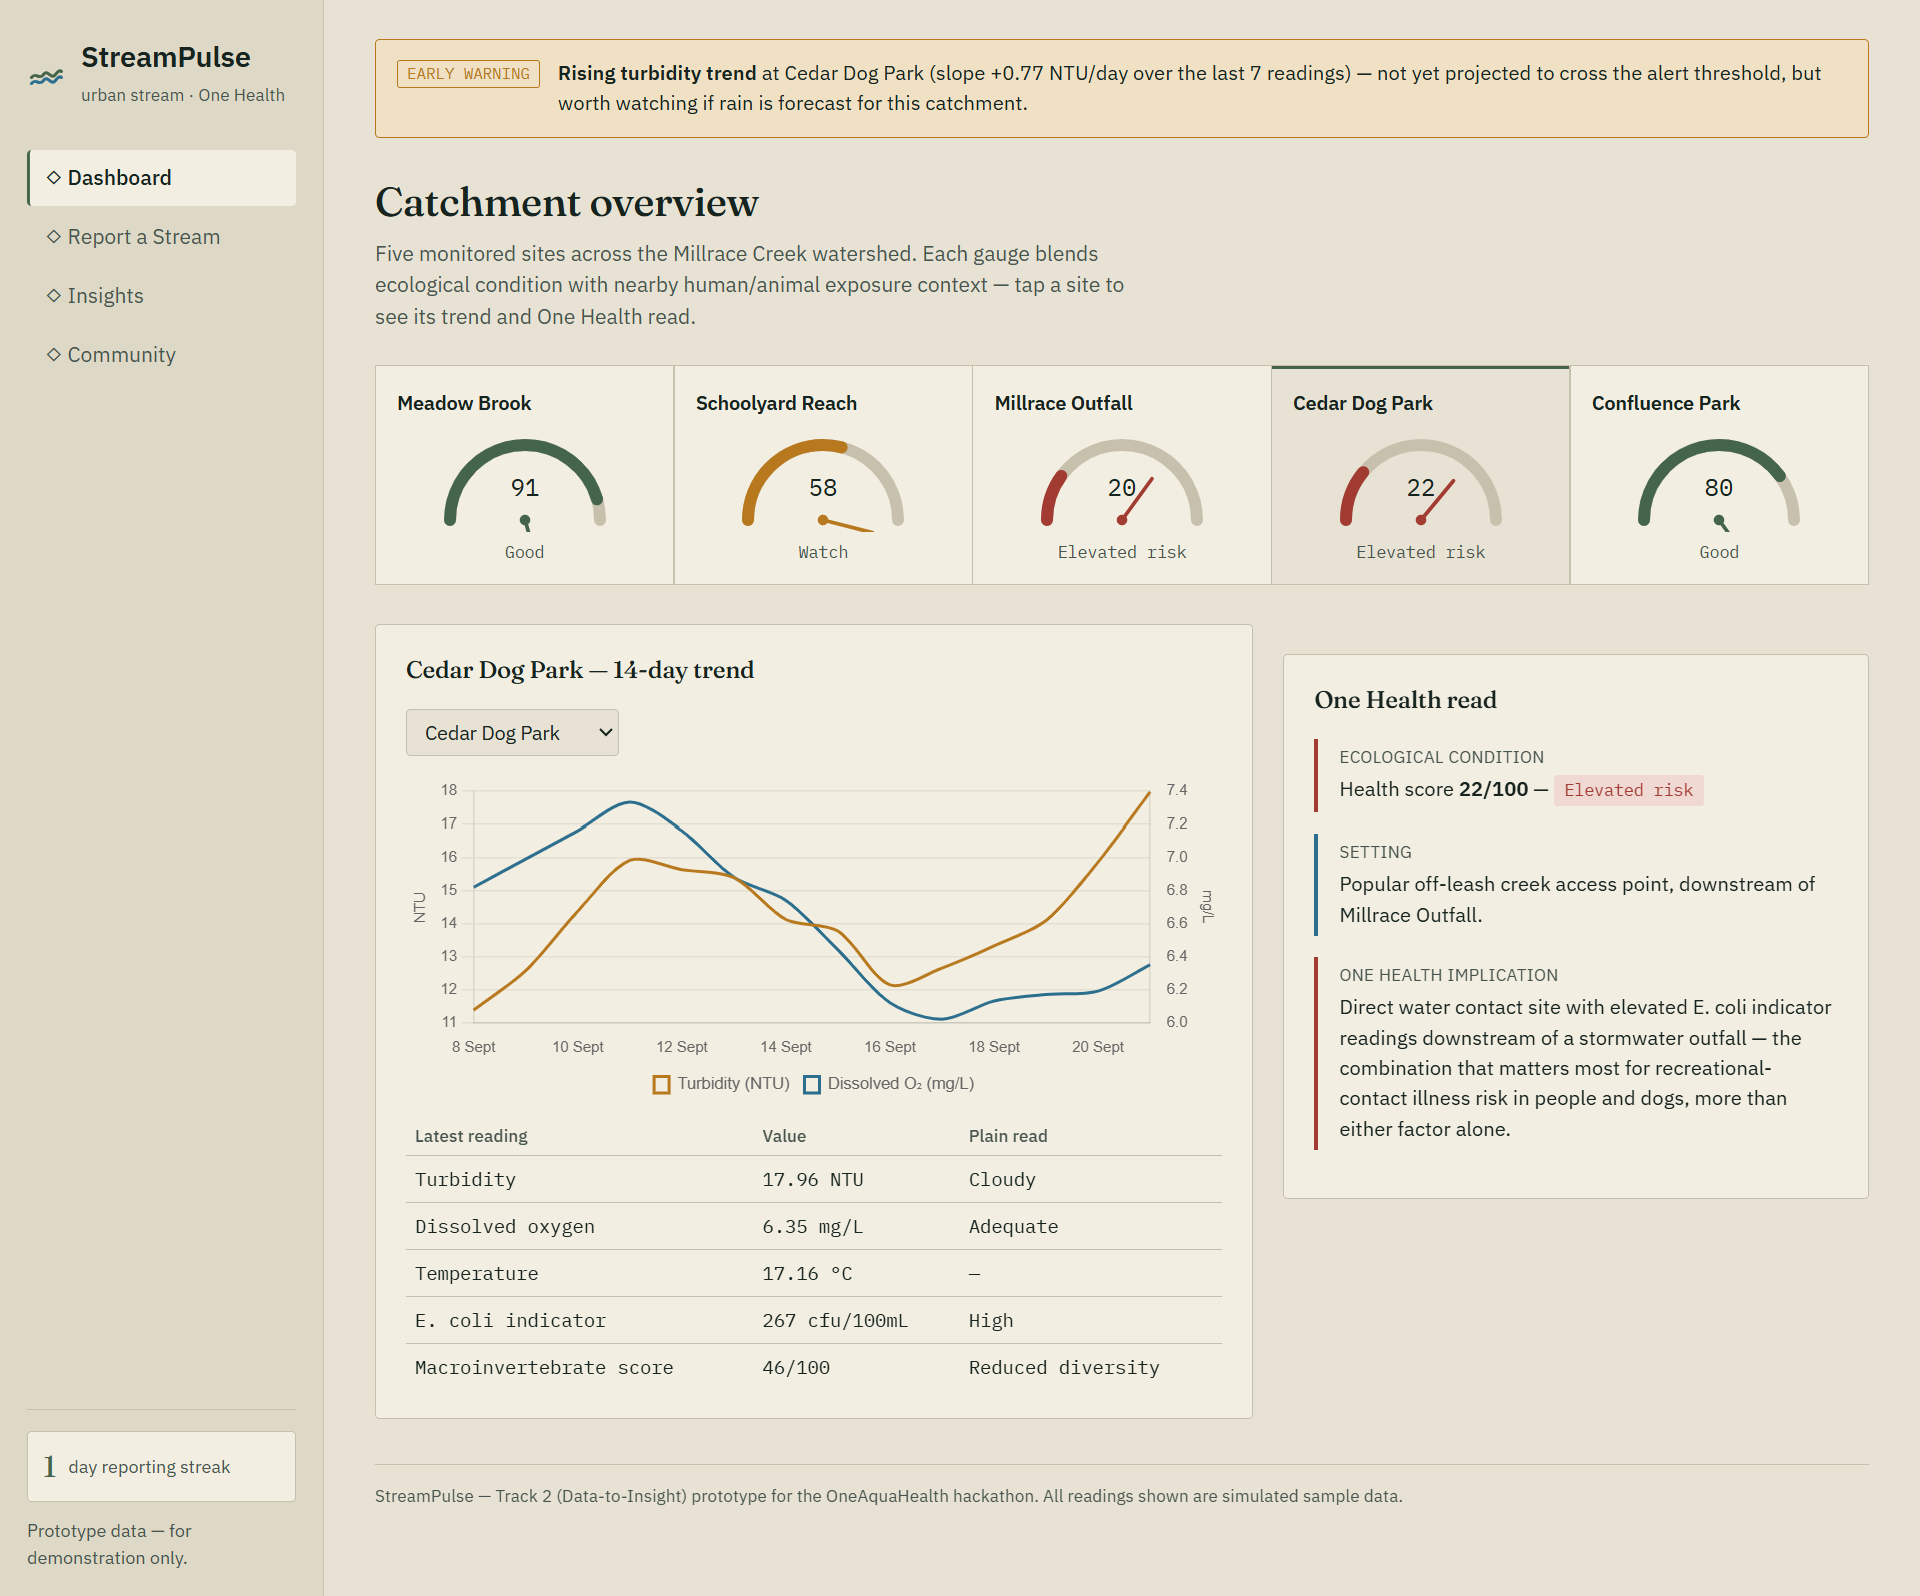
Dashboard — site health gauges, 14-day trend chart, and One Health insight for each monitored stream site
-
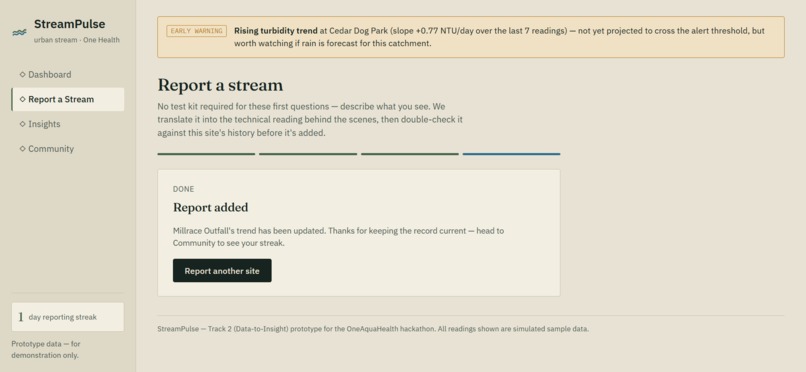
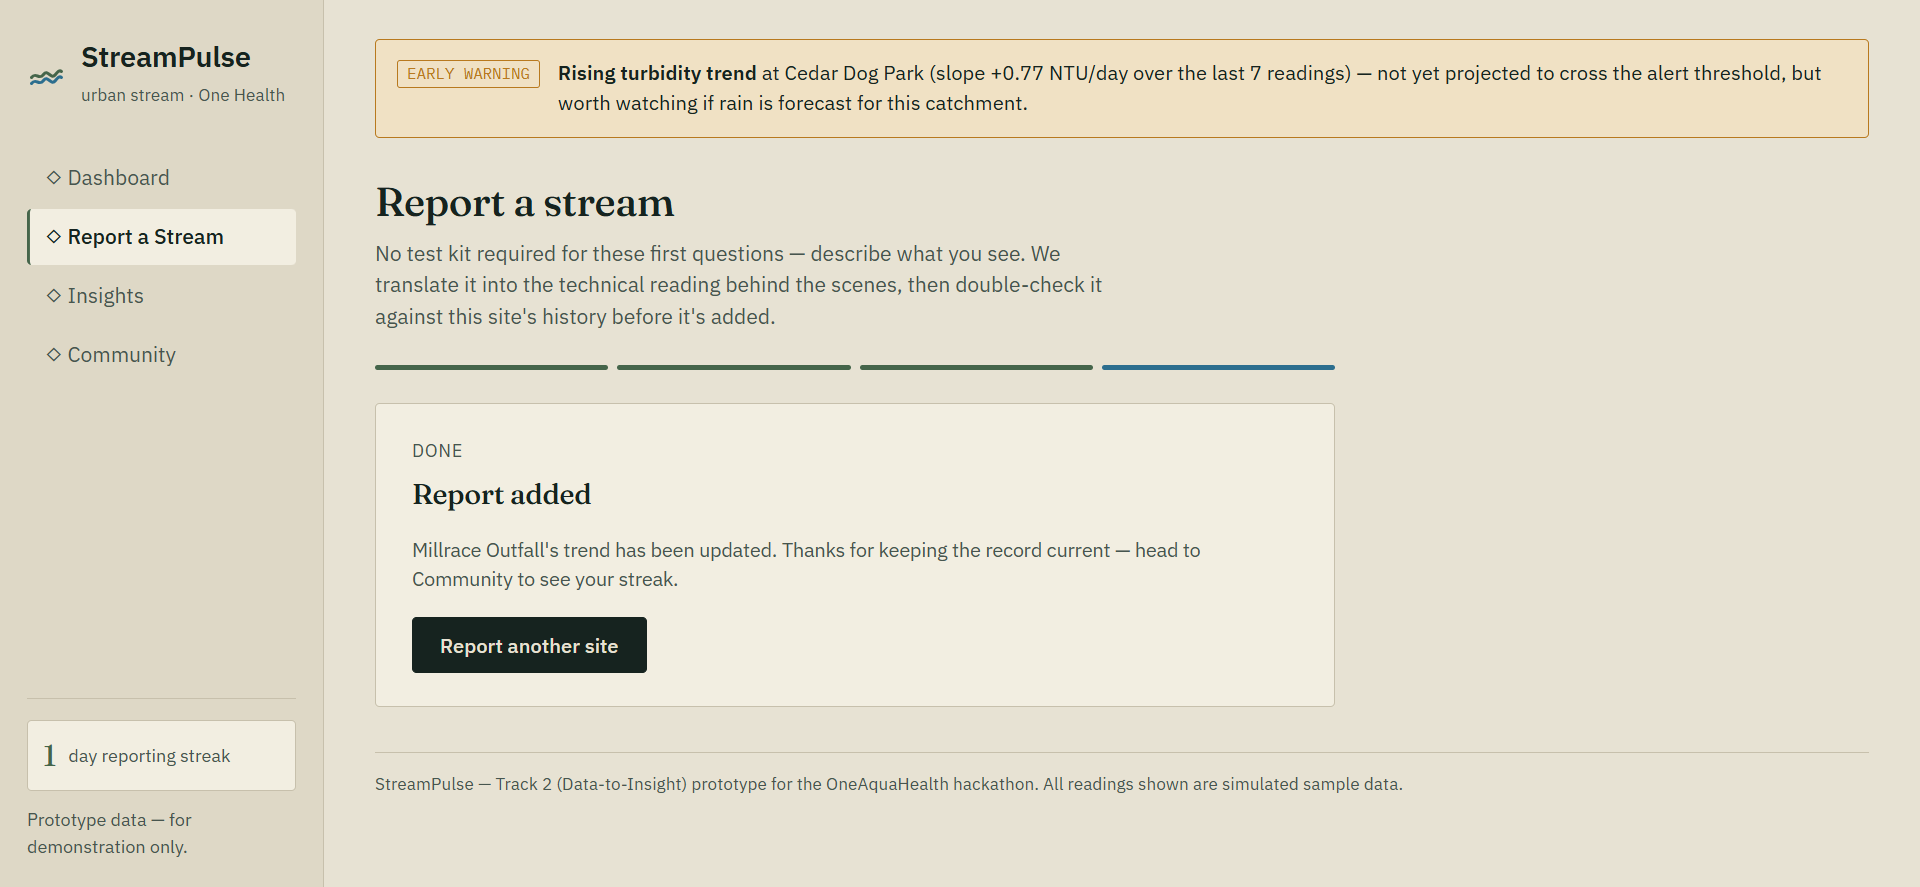
Guided, jargon-free reporting flow with explainable z-score anomaly flag
-
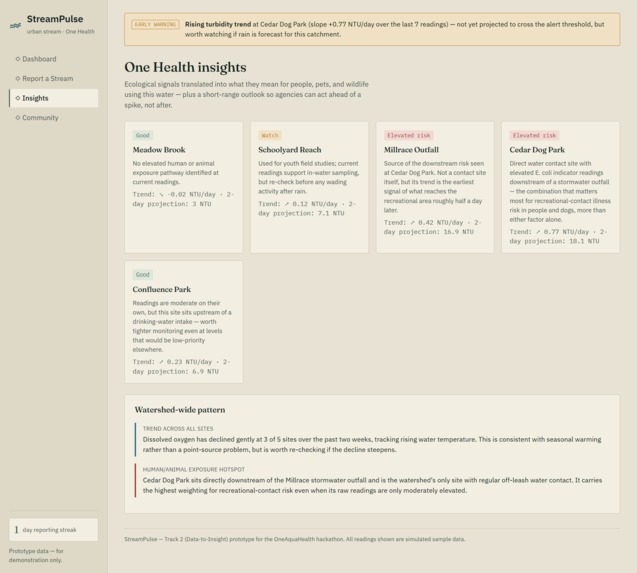
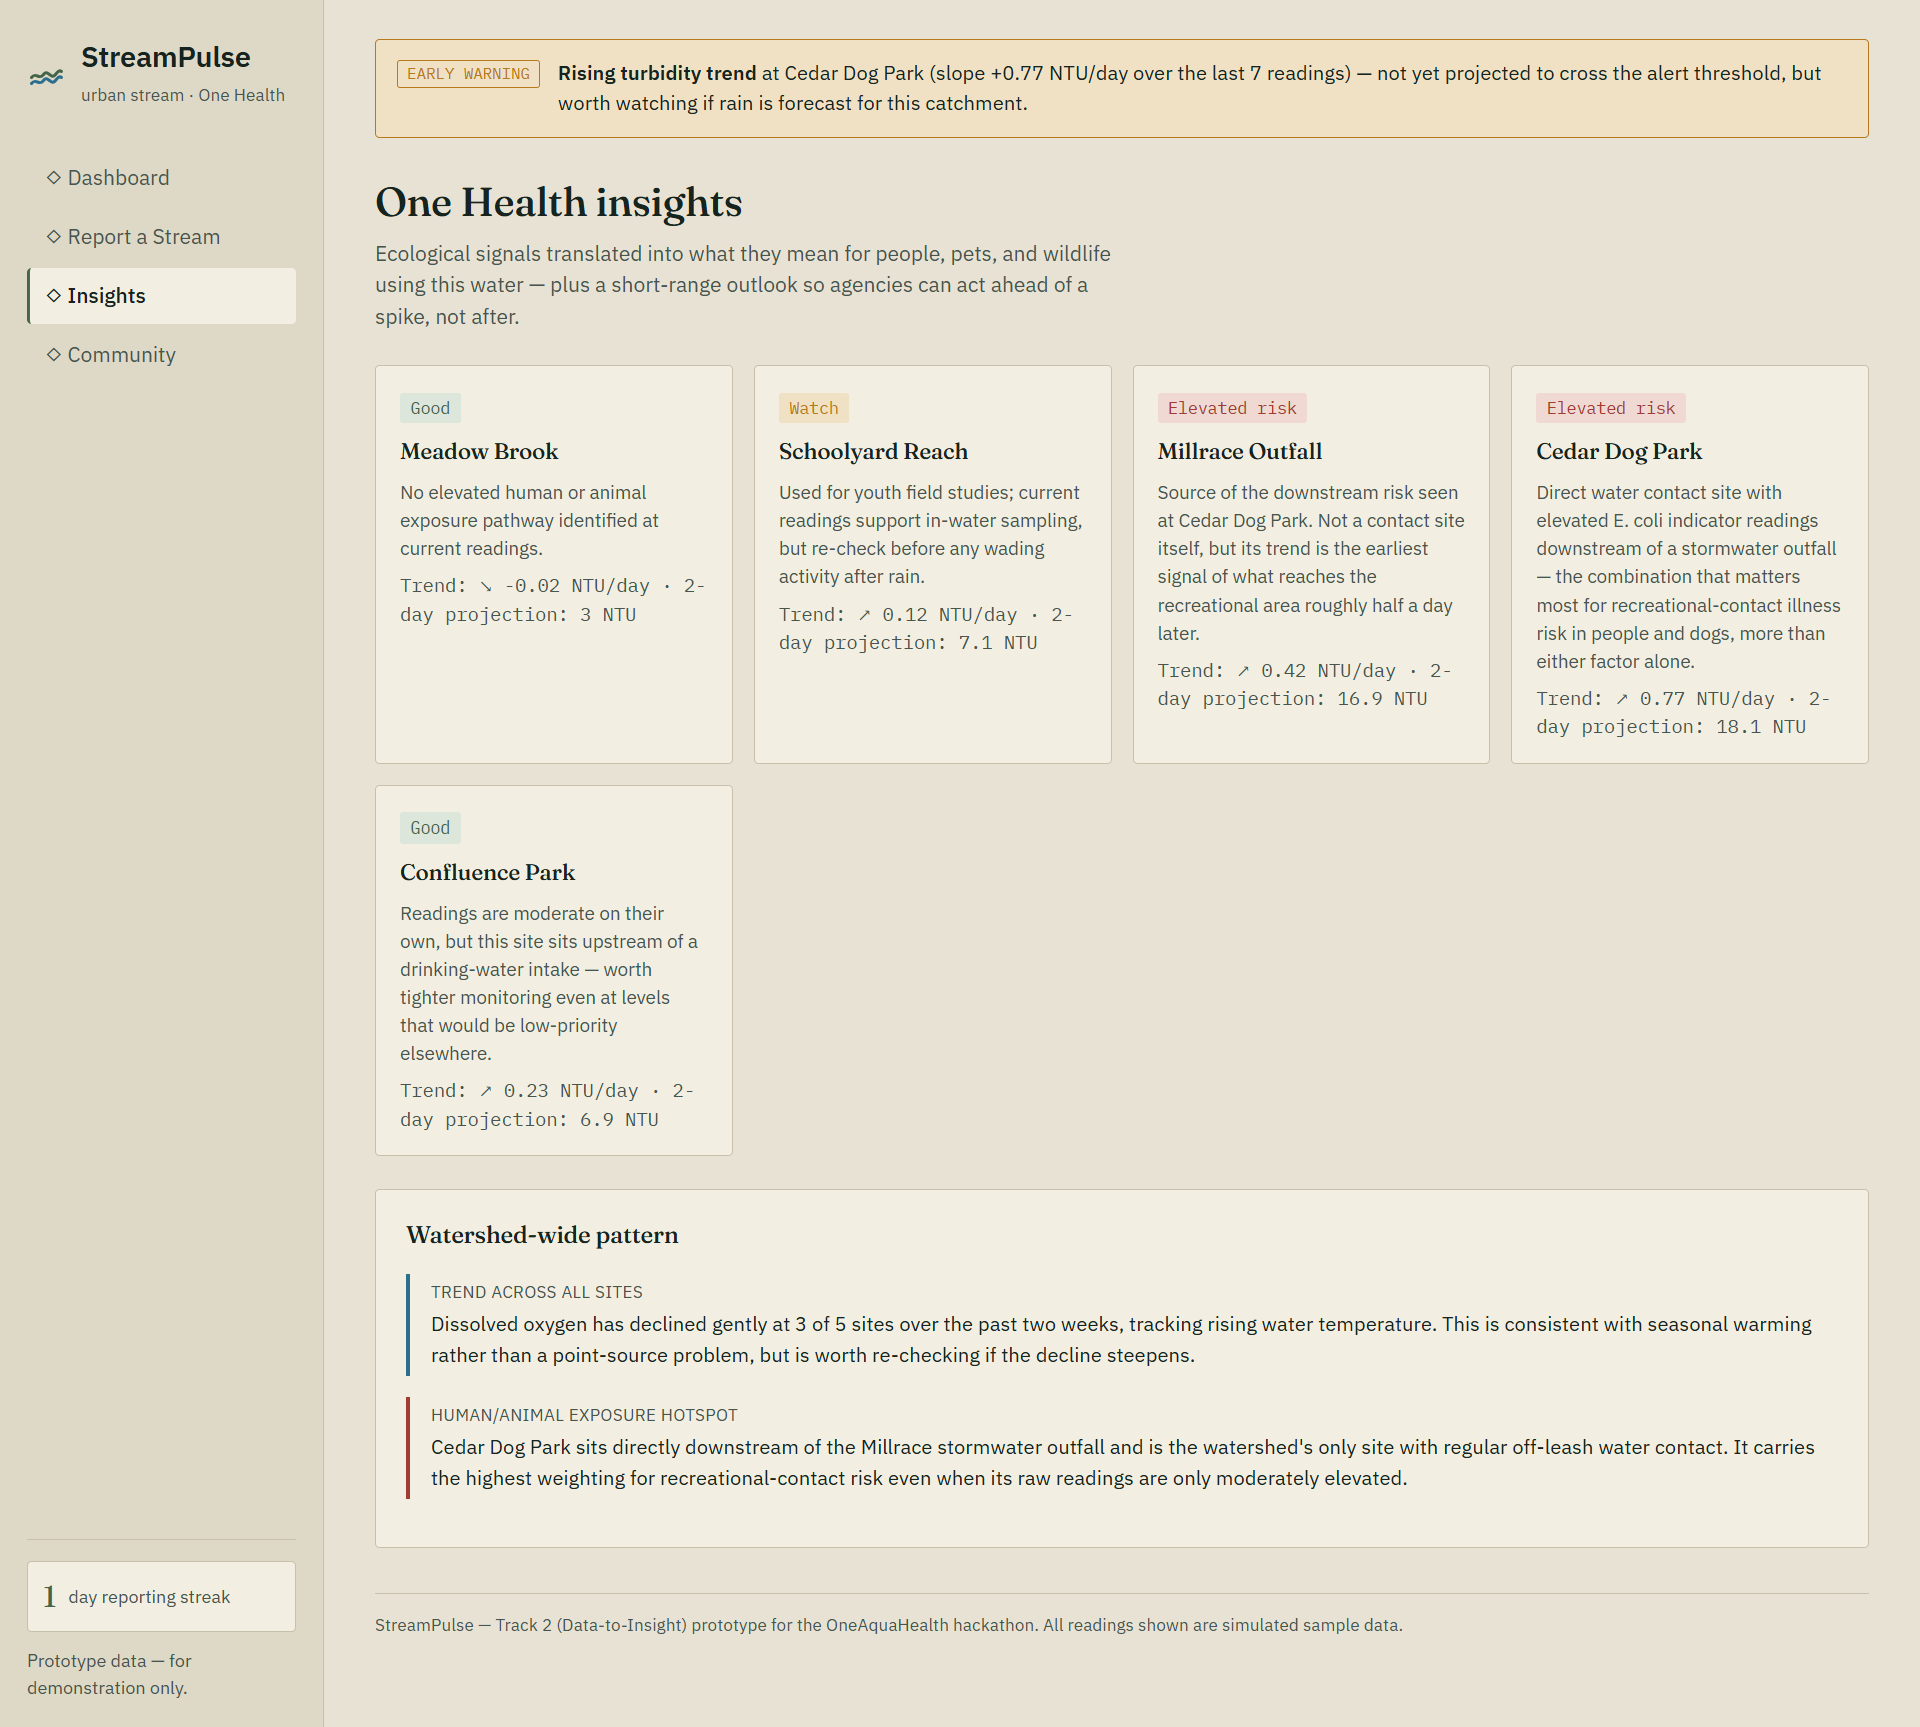
One Health insights with linear-regression early-warning forecast
-
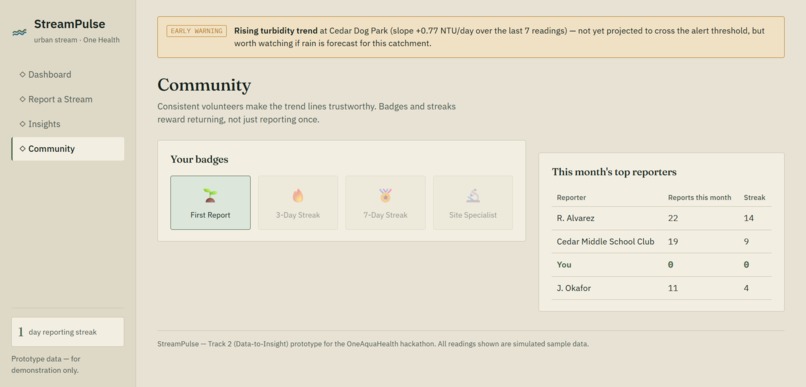
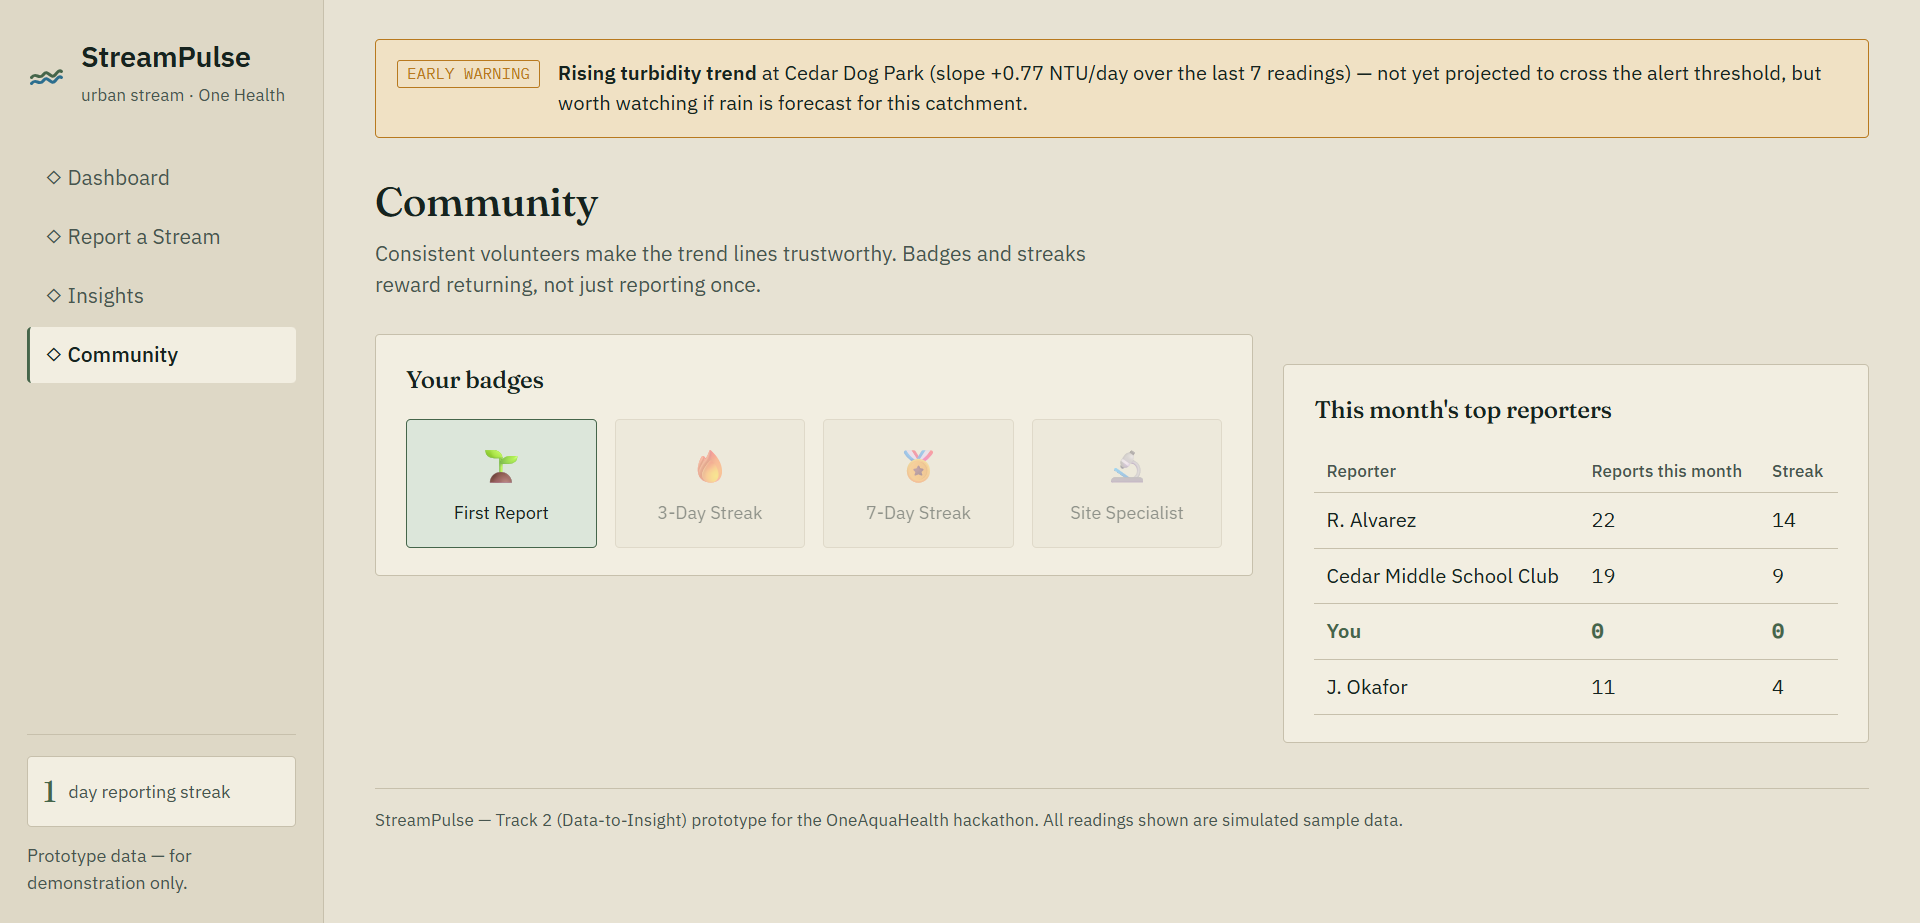
Community streaks, badges, and leaderboard for repeat participation
Inspiration
Urban streams generate a lot of citizen-collected data, but that data usually sits in spreadsheets only a trained specialist can read. Volunteers rarely see what their measurement actually means for the people, pets, and wildlife using that water — so engagement drops, and agencies miss early signals of contamination or ecological stress that could inform real public-health decisions. We wanted to build something that closes that gap: a tool that takes the exact same messy, jargon-heavy readings a volunteer collects streamside and turns them into something a person can immediately act on.
What it does
StreamPulse is a One Health dashboard for urban stream monitoring, built for Track 2: Data-to-Insight.
Dashboard: every monitored site shown as a simple health gauge with a 14-day trend chart, blending ecological condition with nearby human/animal exposure context. Report a Stream: a guided, plain-language data-entry wizard (no NTU/mg/L knowledge required) that converts descriptive answers into technical readings. Explainable AI-assist validation: every submitted reading is checked with a real z-score anomaly-detection calculation against that site's own recent history. If a reading looks statistically unusual, it's flagged with the exact math shown — never silently accepted or rejected. The volunteer decides. Early-warning forecasting: a least-squares linear regression model, fit live on each site's recent readings, projects conditions 2 days ahead and flags any site trending toward a risk threshold — before the next scheduled reading, not after. One Health insight synthesis: each site's ecological signal is paired with its exposure pathway (e.g. a stormwater outfall's readings predicting risk half a day later at a popular dog park downstream), so the same water-quality number is interpreted by who is actually exposed to it. Community & gamification: reporting streaks, badges, and a leaderboard, because trend data is only trustworthy if the same sites are monitored repeatedly.
How we built it
StreamPulse is a single self-contained web app — HTML, CSS, and vanilla JavaScript, with Chart.js for the trend charts. No backend or database was needed for this prototype: all logic (health scoring, z-score anomaly detection, linear regression forecasting) runs client-side and is fully transparent and auditable. It's hosted as a static site on GitHub Pages, so it works as a live, shareable demo with zero server cost. We deliberately used real, explainable statistical methods (z-score outlier detection, least-squares regression) rather than a black-box model, in line with Track 3's principle: AI/statistics should support human judgment, not replace it.
Challenges we ran into
Balancing simplicity for citizen volunteers against the accuracy agencies need was the core design tension. We addressed it by separating the "front door" (plain-language questions like "how clear is the water?") from the technical reading it maps to behind the scenes — so a beginner and an expert are both served by the same flow. We also had to make sure the AI-assist validation was genuinely explainable: instead of a model that silently accepts or rejects data, every flag shows its exact statistical reasoning and leaves the final decision to the person reporting.
Accomplishments that we're proud of
Getting a fully working, end-to-end prototype live — guided reporting, explainable statistical validation, predictive early-warning forecasting, and a One Health insight layer — as a single deployable static site with no backend required.
What we learned
That the hardest part of "data-to-insight" isn't the math — it's deciding what to surface to which audience. A volunteer needs a plain-language read; an agency needs the underlying number and the exposure context. Designing for both without overwhelming either was the real design problem.
What's next for StreamPulse
Connecting to real sensor/lab data feeds and the actual OneAquaHealth Citizen Science App's data model; replacing the single-metric z-score check with a multi-metric ensemble; integrating real precipitation forecast data to strengthen the early-warning model; and exploring FHIR-based interoperability so stream-health data can be shared with public-health systems.

Log in or sign up for Devpost to join the conversation.